
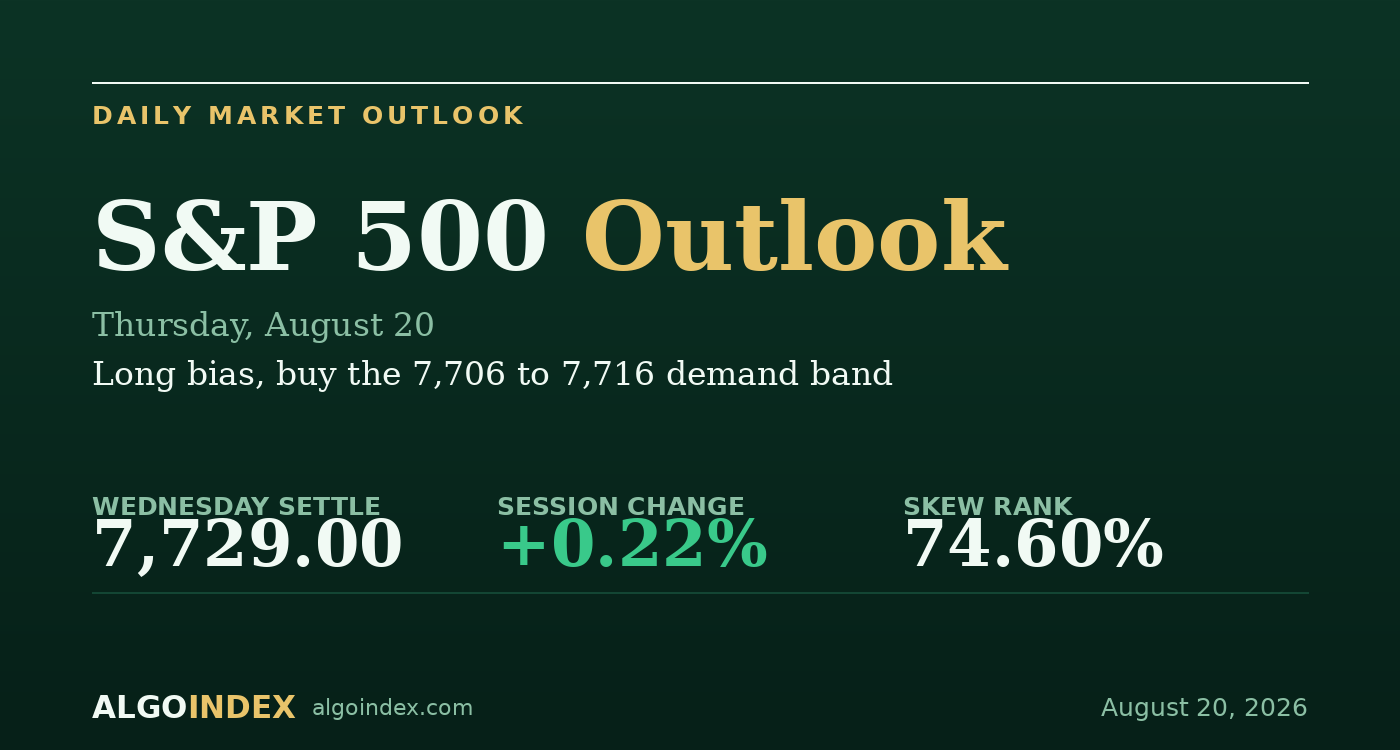
The index closed up 0.22 percent on Wednesday, and the headline number hides the day almost completely. The cash S&P added 0.22 percent, the Dow matched it, and the Nasdaq 100 fell 0.22 percent. That split is the whole session: not a broad advance, but a violent internal rotation that netted out flat at the index level. The September E-mini settled at 7,729, back on its volatility inflection line.
The driver arrived before the open. The Treasury announced larger long-end issuance alongside a plan to expand buybacks of longer-dated bonds, and the market took it as relief. The ten-year fell about five basis points, and then the reaction turned into a currency and hard-asset story rather than an equity one. The dollar dropped to a three-month low, gold rose about 4 percent, and bitcoin cleared 68,000. Those are the fingerprints of a debasement bid, and with public debt crossing 40 trillion dollars the same afternoon, that read gets more weight, not less.
Calm on top, rotation underneath
The structure into Thursday is placid where it counts. Price holds above every average beyond the five-day, short-term momentum is fully discharged with the nine-day stochastic near 22 and turning up, and dealer positioning still sits about 63 points above the level where hedging flips from dampening to amplifying. Above that flip, the options environment absorbs moves rather than feeding them, and Friday's monthly expiration tends to pull price toward the large open-interest concentrations. That's the with-the-grain case for buying a dip.
The caution is in the flow, not the chart. Cumulative hedging ran about negative 7 billion of delta into the close, and its composition changed: longer-dated put buying and longer-dated call selling rather than the short-dated churn of the prior two sessions. Positioning is quietly getting defensive underneath a market that looks calm, and semiconductors fell about 2 percent for a second day while healthcare and biotech absorbed the money. Index-level calm is concealing single-name dispersion that rarely stays quiet for long.
The inflection is the fulcrum
Everything pivots on one line. The volatility inflection sits at 7,739, a handful of points above the settle, and it's the fulcrum the session should rotate around. Above it the market pins toward the five-day at 7,768 and the 7,763 pivot; below it the 7,711 to 7,718 concentration band, where two high-conviction dealer strikes sit, should contain any midday weakness. Implied-volatility rank near 13 says options are cheap relative to the movement being delivered, while skew rank near 75 says the downside is the bid part of the surface, the same cheap-vol, expensive-protection setup that has defined this market all week.
Buy the pullback, pin to the inflection
The plan buys the 7,706 to 7,716 concentration band on a pullback, working with the dampening environment ahead of Friday's expiration rather than betting on a trend. The stop is 7,690, beneath the options-implied band low, first pivot support, and the highest-conviction strike on the map at 7,688, so the whole immediate base has to fail to be wrong, about 21 points from the middle of the entry. Targets run to the 7,739 inflection, then the 7,763 pivot, then the 7,795 upper band on an extension. A sustained trade below 7,690 opens the gamma flip at 7,666 and the setup shouldn't be re-entered, and a jobless-claims miss paired with a soft Philadelphia survey and another weak auction is the read that turns bad data from a cushion into a growth scare. performance methodology sets out how we grade these calls.
The Treasury news bought a weaker dollar and a hard-asset bid, and equities took only a sliver of it, unevenly. The index looks calm because the rotation underneath it cancelled out, not because the positioning did.
A discharged oscillator above the gamma flip, into an expiration that pins, is a dip worth buying. The edge is the 7,739 inflection, and the failure is 7,690.
This is the read our members get every session, before the bell, with the levels drawn and the setup defined. See how the same dealer-positioning work turns into systematic signals.
View pricingThe complete data picture
Every number behind Thursday’s plan, charted first; the full numeric reference follows underneath.
Full numeric reference, every remaining figure from the review
| Average | Value | Settle vs |
|---|---|---|
| 5-day | 7,767.85 | below by 38.85 |
| 20-day | 7,647.04 | above by 81.96 |
| 50-day | 7,572.29 | above by 156.71 |
| 100-day | 7,418.08 | above by 310.92 |
| 200-day | 7,189.62 | above by 539.38 |
| Year-to-date | 7,245.67 | above |
| Level | Reference |
|---|---|
| 7,919.35 | upper call concentration |
| 7,838.50 | 52-week high, mid-month |
| 7,794.35 | desk pivot, cautious below |
| 7,772.35 | strike 97.92, first magnet above |
| 7,763.08 | first pivot resistance |
| 7,739.35 | volatility inflection level, the fulcrum |
| 7,729.00 | September settle |
| 7,706 to 7,716 | primary demand band, entry, strikes 7,711 and 7,718 |
| 7,688.35 | strike 99.03, highest conviction, stop shelf |
| 7,666.35 | dealer gamma flip level |
| Metric | Reading |
|---|---|
| Call gamma | 992.43 million |
| Put gamma | negative 298.29 million |
| Net gamma | positive 694.14 million, roughly 3.3 to 1 calls |
| Index hedging flow | negative 7 billion delta, longer-dated puts bought |
| Single-stock flow | positive 2 billion, longer-dated calls bought |
| Put vs call day volume | 1,001,000 vs 623,615, ratio 1.61 |
| Put-to-call open interest | 1.38 raw |
| Implied-vol rank | 13.19 percent |
| Skew rank | 74.60 percent |
| Input | |
|---|---|
| Treasury 10-year yield | mid 4.6%, fell about 5 bp |
| Dollar index | 98.767, down 0.88%, three-month low |
| Treasury issuance | larger long-end sizes, more buybacks |
| Spot gold | above 4,500, up about 4% |
| Bitcoin | above 68,000, up about 7% |
| Public debt | crossed 40 trillion dollars |
| Volatility index | 14.88, down 6.12% |
| When | Event |
|---|---|
| Thu Aug 20 | jobless claims 08:30, Philadelphia Fed, 30-yr TIPS 13:00 |
| Fri Aug 21 | monthly options expiration, flash PMIs 09:45 |
| Wed Aug 26 | PCE price data, major chipmaker earnings |
| Aug 27-29 | central-bank symposium |
The economic releases referenced above are published on the official government calendars below. Price levels are derived from standard technical and statistical methods, and the market read is AlgoIndex's own analysis. How we grade these calls is set out in our performance methodology.
- US Census Bureau, New Residential Construction (housing starts and building permits)
- US Bureau of Labor Statistics, Import and Export Price Indexes
- Federal Reserve, Industrial Production and Capacity Utilization (G.17)
- Federal Reserve, FOMC calendar and meeting minutes
- US Department of the Treasury, auction schedule and results
- AlgoIndex performance methodology



