
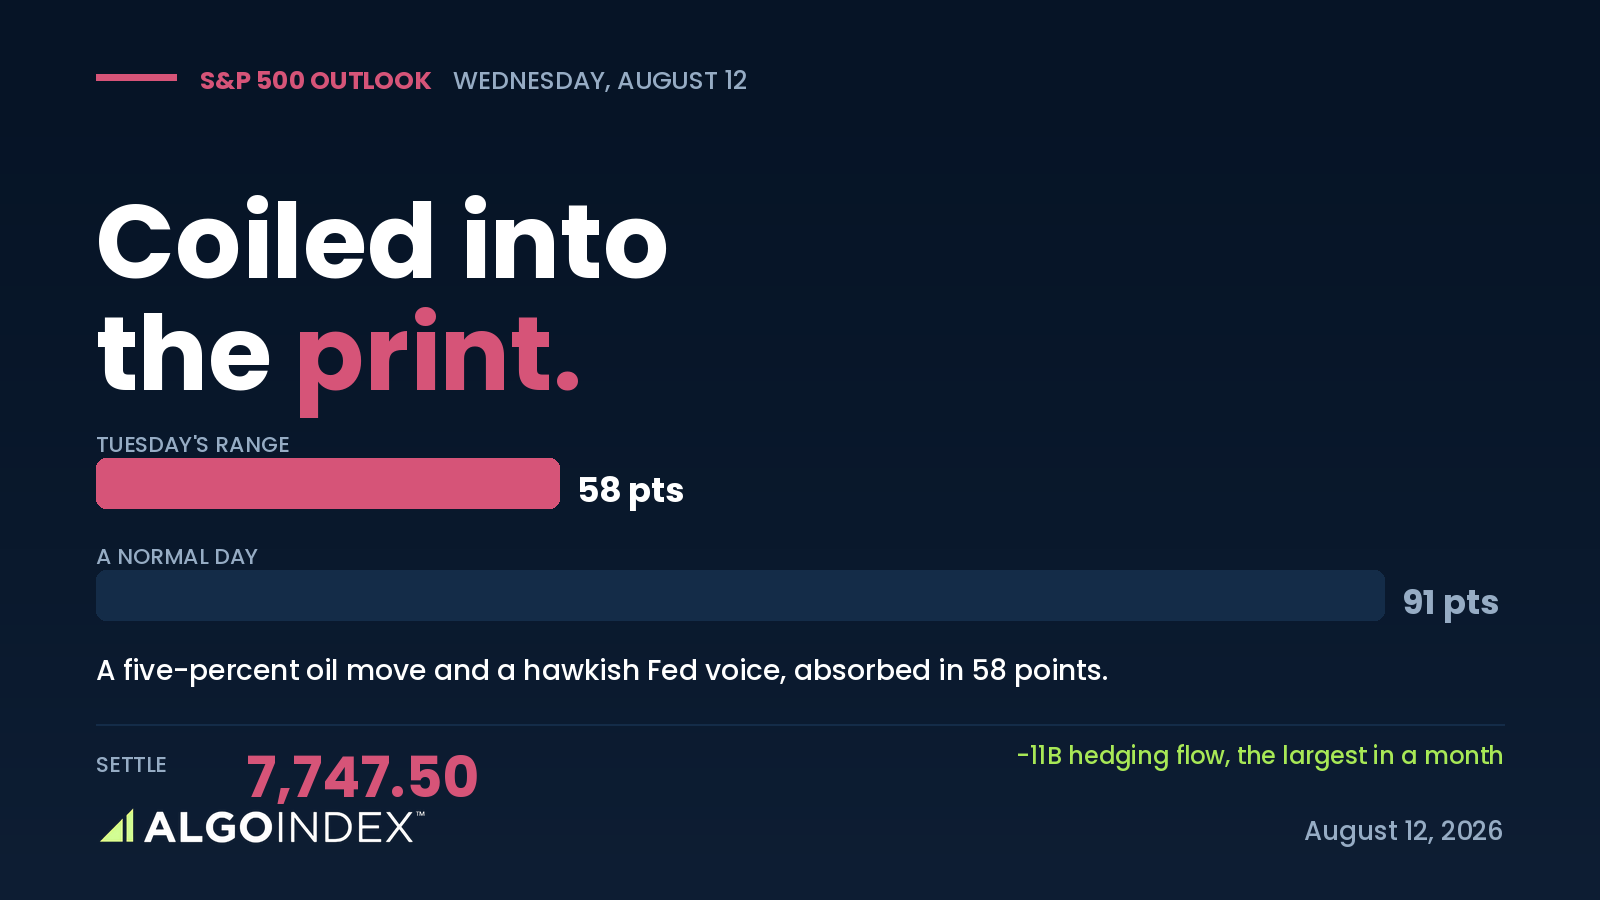
Here is a fact that should stop you: on Tuesday the S&P 500 absorbed the single largest hedging outflow of the past month, roughly minus 11 billion dollars in delta, and fell three tenths of one percent. The September E-mini settled at 7,747.50, down 27 points, in a 58-point range on a day that had every reason to move.
That compression is the story, and it has a mechanical cause. Traders spent the session flattening their books ahead of Wednesday's inflation print, buying about 6 billion of puts and selling about 5 billion of calls at the same time. Both legs point the same way. That is not a book positioning for a decline; it is a book taking off its bets before an event. The selling that would normally follow a hedging move that size did not arrive, because a pocket of dealer positioning around 7,723 to 7,728 absorbed it. So the market is compressed: a mechanical cushion beneath it, its hedges stripped away, sitting right on the line that decides whether the next move dampens or amplifies. Wednesday at 8:30 is the release.
The line that decides the reaction
One number matters more than any other tomorrow, and it is not on the calendar. It is 7,743 in futures terms, the dealer volatility inflection level. Above it, hedging flows stabilise and dampen movement. Below it, the same flows amplify. Tuesday's cash close sat eight points above its equivalent, which is to say the market is balanced on the wire going into the print. That balance is precisely why the reaction can be larger than the data itself. A cool number lets the pre-positioning unwind mechanically and the short side scramble to cover; a hot one drops price through the inflection and hands the move to amplifying hedges.
The volatility surface underlines how cheap the insurance against all this has become. One-month implied volatility reads 12.28 percent against realized of 13.95, and the implied-volatility rank sits at the 12th percentile of its year. Yet skew rank is at the 98th percentile, so puts are historically expensive relative to calls even as the absolute level of protection is the cheapest of 2026. The desk that publishes this data did the logical thing and bought dated puts into the print.
A trend still accelerating underneath the pause
Do not mistake the shallow pullback for a turn. Price sits 175 points above its 20-day average and 586 above its 200-day, and the multi-indicator composite reads a full 100 percent buy across all thirteen studies. The directional index tells the cleanest version: it reads 6.17 on a 100-day window and 33.62 on a 9-day, a monotonic climb that means the move of the last two weeks is stronger than anything in the two months before it. This is a young, accelerating trend inside a shallow pause, not a top.
The caution is that momentum has not kept pace with position. Stochastics are pinned in the high 80s while relative strength sits in the mid-60s, which is a market high in its range but only moderately bought. And there is a live tailwind that is not yet in the price: after the close, a major server maker guided next-year revenue roughly 25 percent above consensus, a direct read on accelerating AI-infrastructure demand that lands on the technology complex before Wednesday's open.
Where the buyers actually are
The four-way support band at 7,723 to 7,728 is not a line on a chart, it is where the market proved itself on Tuesday. First pivot support, the one-standard-deviation support, a moving-average convergence and the desk's named cash support all land inside five points, and that same zone is the dealer pocket that swallowed the day's entire negative flow. Positioning reinforces it: real money is long and staying long with a 937,000-contract net position, while fast money is short and pressing. A benign print turns that short base into covering fuel.
The market delivered its largest hedging outflow in a month and fell three tenths of one percent. That is a shock absorber doing its job.
The plan is a print-day plan
This is a session to trade small and conditionally. The setup buys a post-print flush into 7,723 to 7,731 only if it holds, meaning a five-minute close back above 7,731 after the low prints, with a stop below 7,699 where the desk itself flips to pressing shorts, and targets at the 7,760 pivot, then 7,783, then the 7,818 ceiling approach. If core inflation prints 0.3 percent or higher, the setup does not exist; confluence support does not hold against a repricing of September policy odds. No entries before 9:45, half size, flat before the number if you are not already positioned for it. How we grade these calls afterward is in our performance methodology.
A market this compressed does not resolve quietly, and the number that uncoils it lands one hour before the bell.
This is the read our members get every session, before the bell, with the levels drawn and the setup defined. See how the same dealer-positioning work turns into systematic signals.
View pricingThe complete data picture
Every number behind Tuesday’s plan, charted first; the full numeric reference follows underneath.
Full numeric reference , every remaining figure from the review
| Average | Value | Settle vs |
|---|---|---|
| 5-day | 7,757.65 | -3.40 (first hurdle) |
| 20-day | 7,579.58 | +174.67 |
| 50-day | 7,552.08 | +202.17 |
| 100-day | 7,348.79 | +405.46 |
| 200-day | 7,168.07 | +586.18 |
| YTD | 7,225.18 | +522.32 |
| Level | Reference |
|---|---|
| 7,713-7,720 | two + three-SD support, thin |
| 7,703 | environment-change level (desk risk pivot) |
| 7,667 | third pivot support |
| 7,615 | dealer gamma flip level |
| 7,580 | 20-day average (trend base) |
| 7,423 | structural put support base |
| Metric | Reading |
|---|---|
| Real-time hedging delta | -11B (6B put buying + 5B call selling) |
| One-month implied / realized | 12.28% / 13.95% |
| Implied-vol rank / skew rank | 12.48% / 98.41% |
| Options-implied move | 60.09 index points |
| ATM IV Wed expiry | 14.2% (about 89 bp move) |
| Call gamma / put gamma | 2.45B / -3.1B |
| Put-to-call OI / volume | 1.28 / 1.41 |
| Dealer call ceiling | 7,800 cash (7,823 futures) |
| Cohort | Net |
|---|---|
| Asset managers | long 937,033 (real money long) |
| Leveraged funds | short 329,999 (+82,598 shorts) |
| Dealers / intermediaries | short 716,826 |
| Read | fast money short, real money long |
| Implication | covering fuel on a benign print |
| Open interest | 2,069,808 |
| Input | |
|---|---|
| Hormuz | adviser: strait stays shut until conditions met |
| WTI crude | 83.54, +0.41% |
| 10-year yield | 4.68%, -2 bps (walked back from 4.73) |
| Chicago Fed | inflation is the biggest problem |
| Volatility index | 15.27, -1.17% (fell on a down day) |
| Super Micro | after-close guidance raise, AI tailwind |
| When | Event |
|---|---|
| Wed 08:30 | US CPI: 0.1% m/m, 3.4% y/y, core 0.2%/2.5% (the event) |
| Wed 10:30 | Crude inventories (API showed +9.07M) |
| Wed 13:00 | US 10-year note auction |
| Thu 08:30 | US PPI + claims + 2 Fed speakers |
| Fri 08:30 | US retail sales |
| Fri 10:00 | Consumer sentiment + inflation expectations |



