
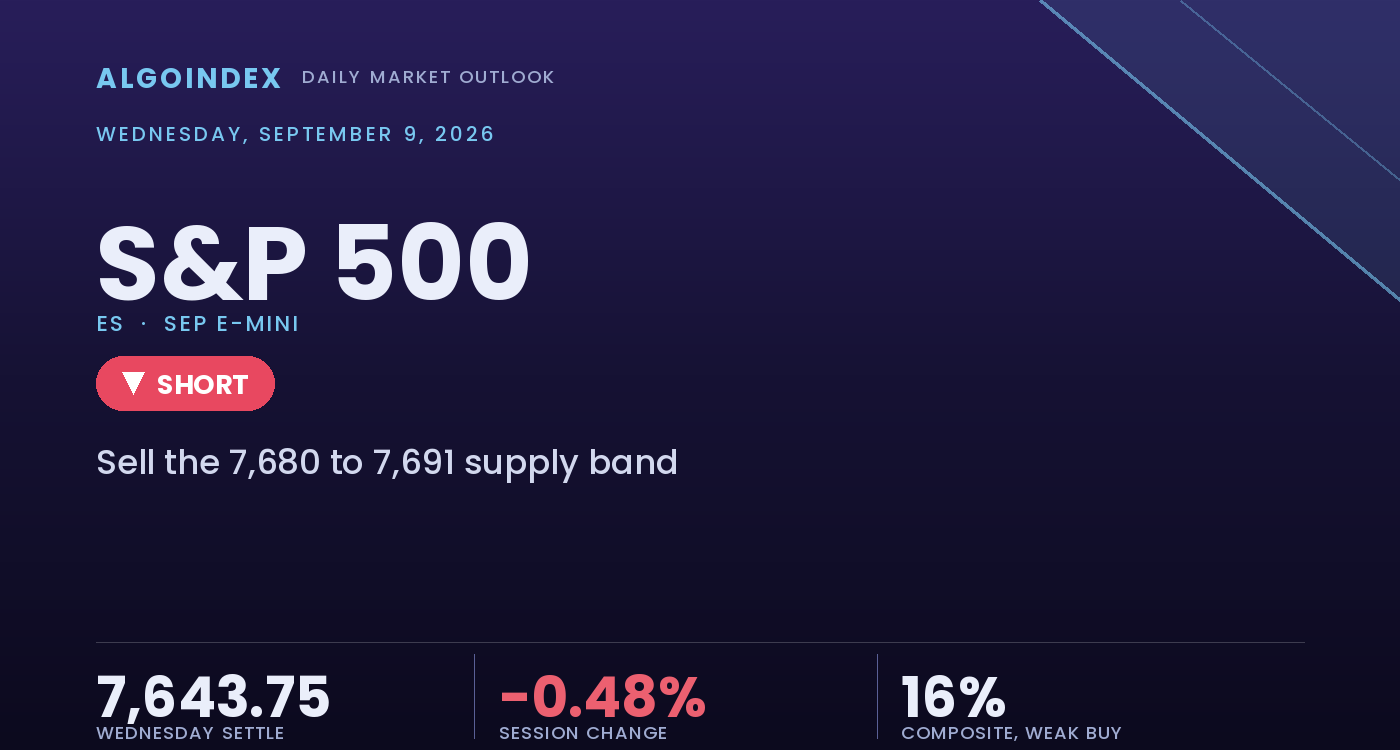
The September E-mini settled Wednesday at 7,643.75 (SPX 7,636), down 36.75 points or 0.48 percent, completing a third consecutive lower-high, lower-low session and extending a three-day slide of 111.00 points from the September 4 close. The full Globex bar spanned 62.50 points against a 14-day average daily range of 63.70, so the market consumed almost exactly one normal day of movement and no more, but the close is what separates the session from ordinary drift. Settlement printed at 24.0 percent of the range, in the lower quartile, and it did so on 1.36 million contracts, 8.0 percent above the 20-day average. Sellers finished the day in control with participation behind them. The cash index confirmed the move, closing at 7,636.36, off 0.48 percent, and the basis measured 7.39 points against settlement. The driver was a single complex working through energy and rates at once: crude closed above 101 dollars at its highest since late May and the ten-year yield rose to 4.839 percent, the highest in roughly two and three-quarter years, a combination that lifts the inflation path and the discount rate in the same motion.
The structural contradiction heading into Thursday is that a market with clearly bearish price structure is sitting directly on top of its mechanical support shelf. Settlement at 7,643.75 (SPX 7,636) is only 8.36 points above the top of the decision band at 7,635.39 (SPX 7,628), where Wednesday's session low at 7,628.75 (SPX 7,621), the 50-day average at 7,630.90 (SPX 7,624) and the modeled gamma-flip level, published at 7,628 in cash terms, occupy a band roughly 7 points wide. Above that band, dealer hedging dampens movement and the recent pattern of contained, one-range-per-day declines should persist. Below it, that dampening is withdrawn and the character of the move changes. At the same time the 14-day directional index reads 12.30, a near-absent trend-strength reading, and the 14-day relative strength index sits at 46.49, squarely neutral. Nothing is exhausted in either direction, and Thursday's producer-price release, a European central-bank decision and a 30-year auction decide whether the market steps over the threshold.
A third down day into the decision band, sitting on the gamma-flip shelf
The bearish weight is the structure and the close quality. Three consecutive down bars print progressively lower highs and lower lows: September 9 settled at 7,643.75 (SPX 7,636) after a 7,691.25 (SPX 7,684) high and a 7,628.75 (SPX 7,621) low, each session's high beneath the prior session's midpoint and each low undercutting the prior. Settlement is below both short-term averages, the 5-day at 7,695.50 (SPX 7,688) and the 20-day at 7,714.95 (SPX 7,708), and the negative directional indicator at 24.49 sits above the positive at 19.09. The two-day decline carried above-average volume rather than thinning into a vacuum, so the distribution is orderly and backed by participation.
The mechanical case against a clean downside extension is the support shelf directly beneath the market. Settlement holds 12.85 points above the 50-day average at 7,630.90 (SPX 7,624), 103.36 above the 100-day at 7,540.39 (SPX 7,533) and 5.53 percent above the 200-day at 7,243.25 (SPX 7,236), so nothing in the intermediate structure has broken and the twelve-month weighted-alpha reading of plus 12.77 remains positive. Real-time hedging flow sits almost exactly at the flip, with a market-maker gamma notional of minus 4.704 million dollars, so dealer hedging still dampens realized movement while price holds above 7,635.39 (SPX 7,628). The invalidation is a sustained trade above the 7,707.39 (SPX 7,700) modeled volatility threshold with the market holding the 7,717.08 (SPX 7,710) second pivot resistance on a close, which would end the three-day lower-high sequence.
The 7,680 to 7,691 resistance confluence and the 7,628 to 7,635 decision band frame Thursday
Two zones define the session. Above the settle, the 7,680.42 to 7,691.25 (SPX 7,673 to 7,684) confluence is the densest overhead on the map, where the first pivot resistance, Tuesday's settlement, Wednesday's opening print, the one standard deviation resistance and Wednesday's session high overlap inside 11 points, and it is the reference a recovery is faded from. A reclaim of that zone would be a genuine structural event rather than noise. Below the settle, the decision band at 7,628.75 to 7,635.39 (SPX 7,621 to 7,628) contains the session low, the 50-day average at 7,630.90 (SPX 7,624) and the modeled gamma-flip level, then the first pivot support at 7,617.92 (SPX 7,611) sits on the one-month low at 7,618.50, and major dealer-positioning support follows at 7,607.39 (SPX 7,600). The volatility surface reads cheap in absolute terms, a 12.11 percent implied-volatility rank, against a firm 76.59 percent skew rank, so downside protection is expensive even as the overall cost of options sits near the bottom of its year.
Fade the recovery into the confluence, respect the decision band, mind the producer-price release
The plan shorts a recovery into the 7,680.00 to 7,691.00 (SPX 7,673 to 7,684) confluence where the first pivot resistance at 7,680.42, Tuesday's settlement at 7,680.50, Wednesday's opening print at 7,681.00, the one standard deviation resistance at 7,686.98 and Wednesday's session high at 7,691.25 stack inside 11 points. The stop is 7,708.00 (SPX 7,701), above the modeled volatility threshold at 7,707.39 and beneath the second pivot resistance at 7,717.08 (SPX 7,710), about 22.5 points from the 7,685.50 entry midpoint, so the position exits only after the three-day lower-high sequence would be confirmed ended. Targets run to 7,643.75 (SPX 7,636), Wednesday's settlement and the first mechanical magnet, then 7,628.75 (SPX 7,621), the decision band holding the session low and the 50-day average at 7,630.90, then an extended 7,607.00 (SPX 7,600) at major dealer-positioning support reachable only if the band gives way on volume, for roughly one-to-1.9, one-to-2.5 and one-to-3.5 reward-to-risk. Two developments override the level map in real time. A materially cooler producer-price release at 8:30 AM ET, or a crude reversal beneath 98 dollars on a large government inventory build at 12:00 PM ET, removes the discount-rate pressure that has driven the last three sessions and would target the 7,680 to 7,691 confluence rather than the downside. A hot producer-price print combined with a weak 30-year auction at 1:00 PM ET argues for holding through the decision band toward 7,607. Position size is measured because the market has declined for three days into mechanical support with a neutral momentum reading and no trend strength, a configuration that more often produces a stabilisation attempt than an immediate acceleration until the 8:30 AM ET release is on the board. Our published record lays out how these calls are graded.
Wednesday settled at 7,643.75 in the lower quartile of its range for a third consecutive down day, beneath both short-term averages and on above-average volume, only 8.36 points above the decision band that holds the session low, the 50-day average and the modeled gamma-flip level. The contract is boxed between a five-object resistance confluence at 7,680 to 7,691 and a support shelf directly beneath the settle, with dealer hedging dampening movement while price holds above 7,635.39 and a producer-price release, a European central-bank decision and a 30-year auction the prints that resolve the tension. The 7,680 to 7,691 band is where a recovery is faded, the 7,628.75 to 7,635.39 decision band is the first objective, and a sustained session above 7,707.39 is what reclaims the near-term structure and voids the thesis.
A third day down into mechanical support, on a market still net long dealer gamma and carrying no trend structure, is a recovery to fade into resistance, not a level to chase lower. The edge is the 7,680 to 7,691 (SPX 7,673 to 7,684) resistance confluence, and the failure is a sustained session above the 7,707.39 (SPX 7,700) modeled volatility threshold or a materially softer producer-price print at 8:30 AM ET.
This is the read our members get every session, before the bell, with the levels drawn and the setup defined. See how the same dealer-positioning work turns into systematic signals.
View pricingThe complete data picture
Every number behind Thursday’s plan, charted first; the full numeric reference follows underneath.
Full numeric reference, every remaining figure from the review
| Average | Value | Settle vs |
|---|---|---|
| 5-day | 7,695.50 | above spot by 51.75, one of two short-term averages now lost, part of the overhead zone that must be reclaimed |
| 20-day | 7,714.95 | above spot by 71.20, the level near the upper edge of the recovery envelope that caps the failed-retest scenario |
| 50-day | 7,630.90 | below spot by 12.85, embedded in the decision band, the pivot of the whole structure whose loss would put price under every average shorter than 100 days |
| 100-day | 7,540.39 | below spot by 103.36 |
| 200-day | 7,243.25 | below spot by 400.50, the market still 5.53 percent above it |
| Level | Reference |
|---|---|
| 7,804.68 | call-side hedging boundary, cash 7,800 |
| 7,766.50 | September 3 weekly high and extended positioning resistance, cash 7,759 |
| 7,742.92 | third pivot resistance, cash 7,736 |
| 7,728.50 | Tuesday's session high and secondary dealer-positioning resistance near cash 7,720, cash 7,721 |
| 7,717.08 | second pivot resistance, the practical single-session ceiling, cash 7,710 |
| 7,707.39 | modeled volatility threshold, cash 7,700 |
| 7,691.25 | Wednesday's session high, top of the primary confluence, cash 7,684 |
| 7,686.98 | one standard deviation resistance inside the confluence, cash 7,680 |
| 7,681.00 | Wednesday's Globex opening print inside the confluence, cash 7,674 |
| 7,680.42 | first pivot resistance and base of the primary confluence, the short reference, cash 7,673 |
| 7,667.66 to 7,677.75 | intraday liquidity shelf carrying roughly 51,800 contracts, cash 7,660 to 7,670 |
| 7,654.58 | pivot point recomputed from Wednesday's range, cash 7,647 |
| 7,643.75 | September settle, in the lower quartile of the range at 24.0 percent |
| 7,635.39 to 7,628.75 | the decision band, holding the modeled gamma-flip conversion, the 50-day average at 7,630.90 and the session low, the most consequential zone on the map, cash 7,628 to 7,621 |
| 7,617.92 | first pivot support at the one-month low 7,618.50, cash 7,611 |
| 7,607.39 | major dealer-positioning support, cash 7,600 |
| 7,600.52 | one standard deviation support, cash 7,593 |
| 7,592.08 | second pivot support, cash 7,585 |
| 7,555.42 to 7,557.39 | third pivot support and the structural threshold where positive dealer gamma is fully removed, cash 7,548 to 7,550 |
| 7,540.39 | 100-day moving average, cash 7,533 |
| 7,507.39 | put-side hedging boundary, cash 7,500 |
| Metric | Reading |
|---|---|
| Call gamma / put gamma | call gamma of 6.92 billion against put gamma of 289.3 million, with gamma tilt at 1.036 and market-maker gamma notional at minus 4.704 million dollars, a very small negative figure reflecting a market sitting almost exactly at its flip threshold |
| Positioning versus the flip | the 7,643.75 settlement sits 8.36 points above the top of the decision band at 7,635.39 and the modeled gamma-flip level published at 7,628 cash, or 7,632.68 in the source's own futures domain, the switch where the dampening effect weakens |
| Directional pivot | the positioning desk's own directional pivot sits at 7,690 cash, last updated September 4, and remains above the market, with price now below it for two sessions |
| Real-time hedging flow | same-day-expiry attribution shows a net minus 5 billion dollars of delta on the session, composed of minus 8 billion in put buying carried over from Tuesday and plus 2.5 billion in same-day call buying that stepped in against the intraday decline, with the index long-gamma structure described as intact into Friday's inflation release |
| Volatility threshold and gamma flip | cash 7,700 (ES 7,707.39) and cash 7,628 (ES 7,635.39), so the whole zone between the two is a region where mechanical support is real but weakens as price falls through it |
| Concentration strikes | the mapped cash levels are 8,000, 7,800, 7,700, 7,600 and 7,500, the primary gamma concentration at cash 8,000, the call-side boundary at cash 7,800 (ES 7,804.68) and the put-side boundary at cash 7,500 (ES 7,507.39) |
| Fund-level gamma | the broad exchange-traded fund reads minus 912.766 million dollars with a tilt of 0.770 and the small-cap fund minus 1.106 billion, where the genuine dealer short-gamma exposure concentrates, helping explain the small-cap index falling nearly three times the broad index, 1.3 percent against 0.48 percent |
| Fixed-strike volatility | fixed-strike volatilities rose modestly, Friday's implied volatility up 1.5 points to an at-the-money 15.1 percent, which the surface converts to a 0.94 percent expected intraday move for that session |
| Largest expiries | the heaviest expiry by gamma is December 17, 2026 and the heaviest by delta is March 18, 2027, both well beyond the near-term horizon and the signature of structural positioning |
| Put-to-call | call volume 692,226 against put volume 1,044,000 for a put-to-call volume ratio of 1.51, call open interest 10.063 million against put open interest 14.207 million for a derived 1.412, with a separately published open-interest ratio of 1.33 that does not reconcile and is treated as low confidence |
| 25-delta risk reversal and surface | the 25-delta risk reversal at negative 0.039 with implied-volatility rank at 12.11 percent and skew rank at 76.59 percent, cheap absolute volatility against expensive downside protection |
| Directional framing | the surface frames the market as waiting for Friday's inflation release and the September 16 policy meeting before moving substantially from 7,700 cash, with crude pressing 100 dollars pulling the cash index toward 7,600 as a measured decline and positive gamma fully removed below 7,550 cash |
| Cohort | Weekly change |
|---|---|
| Commitments composition | as of September 1 commercial participants were long 1,496,598 and short 1,530,711, adding 3,444 longs and cutting 26,508 shorts for a net improvement near 30,000 contracts, while non-commercials added 4,964 longs against 12,911 shorts, a net bearish shift, and leveraged funds added 14,785 longs against 17,145 shorts, so commercials reduced short exposure while speculative and leveraged categories added to shorts |
| Open interest and trend | open interest stands at 1,952,061 contracts, and the weighted alpha reading of plus 12.77 confirms the twelve-month trend remains positive despite the current three-day decline, the same split the moving-average stack and the multi-indicator composite both show, with both first notice and expiration falling on the September 18 quarterly expiration so roll flow builds mechanically through the coming sessions |
| Input | |
|---|---|
| Fed policy | Wednesday's ten-year note auction cleared at a 4.834 percent high yield against 4.683 percent previously on a bid-to-cover of 2.710 against 2.530, so coverage improved while the clearing yield rose about 15 basis points, an 11:00 AM ET Treasury announcement of a buyback of up to 6 billion dollars in longer-dated paper deepened the afternoon decline, and short-term rate futures now assign roughly a 45 percent chance to a rate increase at the September 16 meeting |
| Dollar and rates | the ten-year yield closed at 4.839 percent, up 0.010 and the highest in roughly two and three-quarter years, while the dollar index closed at 98.782, down 0.05 percent and essentially unchanged, a term-premium move driven by inflation expectations and supply rather than by a shift in policy-rate expectations, which compresses valuation without offering the offsetting currency signal |
| Volatility | the volatility index rose 4.84 percent to 16.47, breaking and closing above the 16 handle where roughly 210,000 lots of short put open interest sit, with the volatility-of-volatility measure up 6 points to 95, its highest in more than a week, indicating institutional demand for convexity rather than simple directional hedging |
| Large-cap leadership | leadership was narrow and thematically coherent, semiconductors and artificial-intelligence infrastructure names higher with the leading merchant processor up 3.04 percent and a large personal-computing hardware maker up 3.91 percent, energy producers higher, telecom and managed care lower, and one social-media platform up 7 percent on the launch of a new artificial-intelligence agent product |
| Breadth | breadth was negative but not washed out, the traders index closing near 1.06 to 1.07, up about a third on the session, a discount-rate rotation rather than a growth scare, with the small-cap index down 1.3 percent, the Dow down 0.77 percent to a five-week low, the broad index down 0.48 percent and the technology-heavy index down only 0.29 percent, an ordering by rate sensitivity that reproduces the ordering by loss almost exactly |
| Cross-asset | crude was the transmission mechanism, closing above 101 dollars at the highest since May 22 on an escalating situation around Iran, higher energy prices feeding the inflation expectations that underpin the rate-increase case, gold futures fell 0.35 percent to 4,445.0 a notable non-confirmation of a genuine inflation panic, and Bitcoin fell roughly 0.5 to 0.6 percent to near 78,000, consistent with general risk reduction |
| Institutional positioning | commercials reduced short exposure while speculative and leveraged categories added shorts, open interest 1,952,061 and weighted alpha plus 12.77, a market with a bearish near-term tilt inside an intact twelve-month uptrend, consistent with a 14-day directional index at 12.30 and no trend structure to lean on |
| When | Event |
|---|---|
| Thu Sep 10 | the European central-bank decision at 8:15 AM ET expected to lift the main rate to 2.65 percent from 2.40 percent, United States producer prices at 8:30 AM ET expected to accelerate to 5.3 percent annually from 4.7 percent with core at 4.6 percent against 4.2 percent, initial claims in the same window, a monthly oil market report at 8:00 AM ET, weekly government crude inventories at 12:00 PM ET and a 30-year bond auction at 1:00 PM ET |
| Fri Sep 11 | consumer prices at 8:30 AM ET with the headline expected at 0.4 percent monthly against 0.1 percent prior and 3.4 percent annually and core at 0.2 percent monthly and 2.4 percent annually, a risk skewed higher given the crude rally, and preliminary consumer sentiment at 10:00 AM ET with a 51 consensus and one-year inflation expectations at 4.2 percent against 4.0 percent prior |
| Tue Sep 16 | the policy statement and updated projections at 2:00 PM ET with the press conference at 2:30 PM ET, the pivotal event of the following week given the roughly 45 percent chance of a rate increase now priced |
| Sep 17 to 18 | the Japanese central bank follows September 17, and the September quarterly options expiration alongside the September E-mini contract expiration both fall on Friday, September 18, arguing for measured position sizing across the whole week |
The economic releases referenced above are published on the official government calendars below. Price levels are derived from standard technical and statistical methods, and the market read is AlgoIndex's own analysis. How we grade these calls is set out in our performance methodology.
- US Bureau of Economic Analysis, Personal Income and Outlays (PCE)
- US Bureau of Economic Analysis, Gross Domestic Product
- US Bureau of Economic Analysis, release schedule
- US Census Bureau, Advance Durable Goods (M3) release schedule
- US Energy Information Administration, Weekly Petroleum Status Report
- US Department of the Treasury, auction schedule and results
- AlgoIndex performance methodology



