
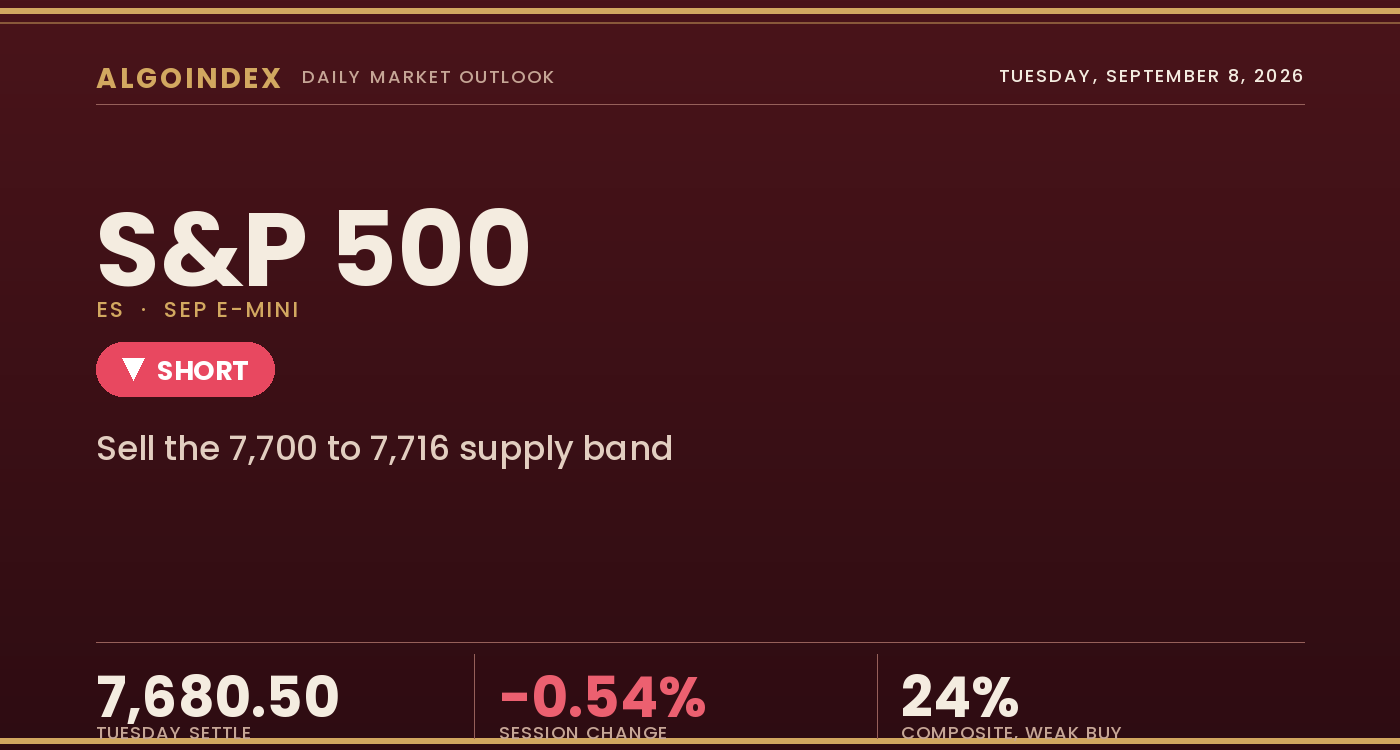
The September E-mini settled Tuesday at 7,680.50 (SPX 7,674), down 41.50 points or 0.54 percent, in a session that reopened at 7,715.50, posted its 7,728.50 high overnight and then spent the entire regular day beneath the 7,700 to 7,717 band, with the highest regular-hours reading of 7,717.75 made inside the first thirty minutes and never revisited. The contract printed its low of 7,672.25 in the final half hour and closed 8.25 points off it, in the bottom 14.7 percent of a 56.25 point range. That single statistic is the most informative of the day: this was not a market that sold off and stabilized, it was a market that made its low late and closed into it. The cash index finished at 7,674.20, down 0.58 percent. The driver was geopolitical and it arrived late, as crude extended a rally toward the 100 dollar area on renewed military exchanges involving Iran and the equity deterioration coincided with a sequence of tanker and island strike headlines from the middle of the afternoon.
The structural contradiction heading into Wednesday is worth stating plainly, because it is the reason a straightforward bearish extension is not the base case. Dealer positioning on the cash index remains net long gamma by a wide margin, call gamma near 8.4 billion against put gamma of roughly 128 million and gamma notional positive near 669 million dollars, a configuration that dampens realized movement and pulls price toward areas of concentration. Against it, the index absorbed roughly negative 13 billion dollars of delta on the day, the most negative reading of the past thirty sessions, and positioning is defensive and lengthening in duration ahead of Thursday's producer prices and Friday's consumer prices. The market closed 1.20 points above the modeled gamma-flip level at 7,673 (SPX equivalent, ES 7,678.65), the threshold where that dampening effect weakens. The result is a defensive, directionless close settling on the switch, immediately before a data-light Wednesday whose only first-order event is a 1:00 PM ET ten-year note auction.
A late geopolitical break into a market pinned by dealer gamma
The mechanical case against a clean downside extension starts with dealer positioning. The gamma positioning index reads 1.95 and gamma tilt 1.13, with call gamma near 8.4 billion against put gamma of roughly 128 million, an arrangement that has hedgers selling strength and buying weakness and pulling price toward the centre of the mapped range. Price also remains 48.88 points above the 50-day at 7,631.62, 139.75 above the 100-day at 7,540.75 and 6.03 percent above the 200-day at 7,243.43, so nothing in the intermediate structure has broken. This is a short-term deterioration inside an intact intermediate uptrend, and the 50-day is the level whose failure would change that characterization.
The bearish weight is the close quality and the lost averages. The settle at 7,680.50 (SPX 7,674) sits below both short-term averages, the 5-day at 7,702.65 and the 20-day at 7,716.74 (SPX 7,711), beneath the prior-quarter high shelf at 7,700 and beneath the positioning desk's own directional pivot at 7,690 cash, and it did so on the most negative delta reading in thirty sessions. Trend structure does not exist to lean on in either direction: the 14-day directional index reads 11.59 with the positive line at 20.29 barely beneath the negative at 21.32, the 20-day reads 9.63, and the multi-indicator composite has decayed from 100 percent buy a month ago to 16 percent a week ago to 24 percent, weak in strength and weakening in direction. The invalidation is a sustained trade above 7,717, acceptance rather than a single wick, which reclaims both the first pivot resistance at 7,715.25 and the 20-day average and neutralizes the near-term downside.
The 7,700 to 7,716 resistance band and the 7,673 gamma-flip level frame Wednesday
Two zones define the session. Above the settle, the 7,700 to 7,716 (SPX 7,694 to 7,710) band is the densest overhead confluence, where the round number and prior-quarter high shelf at 7,700.00 with roughly 11,000 lots of same-day positioning, the 5-day average at 7,702.65, the first pivot resistance at 7,715.25 and the 20-day average at 7,716.74 stack within 17 points, and it is where a failed retest is faded. Below, the first line is the modeled gamma-flip level at 7,673 cash, or 7,678.65 in the futures domain, two points beneath the settle, then Tuesday's session low at 7,672.25 (SPX 7,666), then the first pivot support at 7,659.00 (SPX 7,653). The volatility surface reads cheap in absolute terms, a 5.40 percent implied-volatility rank, against a firm 88.19 percent skew rank and an expensive downside, protection concentrated in puts into a data-light Wednesday whose one first-order event is the afternoon auction.
Fade the failed retest into the resistance band, respect the flip level, mind the auction
The plan shorts a failed retest into the 7,700 to 7,716 (SPX 7,694 to 7,710) band where the round number and prior-quarter high shelf at 7,700.00, the 5-day average at 7,702.65, the first pivot resistance at 7,715.25 and the 20-day average at 7,716.74 stack within 17 points, taken only on a retest that fails to hold above 7,717. The stop is 7,730 (SPX 7,724), above the 7,728.50 overnight high and the lower edge of the 4-hour supply band, about 22 points from the 7,708 entry midpoint, so the position exits only after the descending sequence of lower highs would be confirmed broken. Targets run to 7,672 (SPX 7,666), Tuesday's session low and a combination level carrying a 93.13 conviction score, then 7,659 (SPX 7,653), the first pivot support with a 96.50 conviction score just beneath at 7,649, then an extended 7,637 (SPX 7,631) at the second pivot support immediately above the 50-day, reachable only if momentum extends through the second target on expanding volume, for roughly one-to-1.6, one-to-2.2 and one-to-3.2 reward-to-risk. Two developments override the level map in real time. A strong ten-year note auction at 1:00 PM ET that pushes yields lower would remove the rate-driven pressure and, combined with heavy positive dealer gamma, favour mean reversion toward 7,700 rather than continuation. An overnight geopolitical escalation that gaps the market beneath 7,659 removes the retest entry entirely; a gap into the objectives is not chased, since the dense band of high-conviction concentration levels between cash 7,600 and 7,703 makes a clean directional run less likely than a series of stalls. Position size is halved for three independent reasons: no trend structure to lean on, positive dealer gamma working against continuation, and a data-light Wednesday between a live geopolitical situation and Thursday's producer prices. Our published record lays out how we grade these calls.
Tuesday settled at 7,680.50 in the bottom 14.7 percent of its range with the low made in the final half hour, beneath both short-term averages, beneath the prior-quarter high shelf and beneath the positioning desk's directional pivot, and did so on the most negative delta reading in thirty sessions. The contract is boxed between a resistance confluence at 7,700 to 7,716 and a gamma-flip level two points below the settle, with positive dealer positioning dampening realized movement and a 1:00 PM ET ten-year note auction the print that resolves the tension. The 7,700 to 7,716 band is where a failed retest is faded, the 7,672 to 7,659 shelf is the first objective, and a sustained session above 7,717 is what reclaims the near-term structure and voids the thesis.
A late geopolitical break, on a market pinned by positive dealer gamma and carrying no trend structure, is a failed retest to fade into resistance, not a level to chase lower. The edge is the 7,700 to 7,716 (SPX 7,694 to 7,710) resistance confluence, and the failure is a sustained session above 7,717 or a strong ten-year note auction at 1:00 PM ET.
This is the read our members get every session, before the bell, with the levels drawn and the setup defined. See how the same dealer-positioning work turns into systematic signals.
View pricingThe complete data picture
Every number behind Wednesday’s plan, charted first; the full numeric reference follows underneath.
Full numeric reference, every remaining figure from the review
| Average | Value | Settle vs |
|---|---|---|
| 5-day | 7,702.65 | above spot by 22.15, now inside the overhead band with the prior-quarter high shelf, part of the zone that must be reclaimed |
| 20-day | 7,716.74 | above spot by 36.24, the level that caps the failed-retest scenario alongside the first pivot resistance |
| 50-day | 7,631.62 | below spot by 48.88, the line whose failure would convert a short-term pullback into an intermediate structural break |
| 100-day | 7,540.75 | below spot by 139.75 |
| 200-day | 7,243.43 | below spot by 437.07, the market still 6.03 percent above it |
| Level | Reference |
|---|---|
| 7,805.65 | call-side hedging boundary, cash 7,800 |
| 7,771.50 | third pivot resistance just beneath the prior week high near 7,762, cash 7,765 |
| 7,750.00 | second pivot resistance corresponding to the September 3 close 7,754.75, cash 7,744 |
| 7,728.50 | overnight session high and lower edge of the 4-hour supply band, cash 7,722 |
| 7,720.65 | modeled volatility threshold, cash 7,715 |
| 7,716.74 | 20-day moving average, cash 7,711 |
| 7,715.25 | first pivot resistance overlapping the 20-day average, the most defensible short reference, cash 7,709 |
| 7,702.65 | 5-day moving average inside the overhead band, cash 7,697 |
| 7,700.00 | round number and prior-quarter high shelf flipped to resistance with roughly 11,000 lots of same-day positioning, cash 7,694 |
| 7,693.75 | pivot point recomputed from Tuesday's range and confirmed current, cash 7,688 |
| 7,680.50 | September settle, in the bottom 14.7 percent of the range |
| 7,678.65 | modeled gamma-flip level, cash 7,673 |
| 7,672.25 | Tuesday's session low, printed in the final half hour, cash 7,666 |
| 7,659.00 | first pivot support recomputed from Tuesday's range, cash 7,653 |
| 7,645.86 | one standard deviation support, cash 7,640 |
| 7,637.50 to 7,631.62 | second pivot support paired with the 50-day moving average, the most consequential downside band, cash 7,631 to 7,626 |
| 7,618.50 | one-month low set on September 2, cash 7,612 |
| 7,602.75 | third pivot support, cash 7,597 |
| 7,505.65 | put-side hedging boundary, cash 7,500 |
| Metric | Reading |
|---|---|
| Call gamma / put gamma | call gamma near 8.4 billion against put gamma of roughly 128 million, a ratio near 65 to 1, with gamma notional positive at approximately 669 million dollars, cash index |
| Positioning indices | the gamma positioning index reads 1.95 and gamma tilt 1.13, so market makers are long options and hedge by selling strength and buying weakness, the single largest reason to doubt a clean downside extension |
| Positioning versus the flip | the 7,674.20 cash close sits 1.20 points above the modeled gamma-flip level at 7,673 cash, or 7,678.65 in the E-mini domain, so the market settled directly on the switch where the dampening effect weakens |
| Directional pivot | the positioning desk's own directional pivot sits at 7,690 cash, framed as constructive above and unconstructive below and raised to that level on September 4 from 7,650, with the index closing 15.80 points beneath it, an unconstructive close by that framework |
| Real-time hedging flow | the cash index absorbed roughly negative 13 billion dollars of delta on the day, the most negative reading of the past thirty sessions, split into about negative 7 billion of call selling and negative 6 billion of put buying, with single-stock flow comparatively light near negative 2 billion, so the defensiveness was expressed at the index level |
| Volatility threshold and gamma flip | cash 7,715 (ES 7,720.65) and cash 7,673 (ES 7,678.65), so the whole zone between the two is a region where mechanical support is real but weakening as price falls through it |
| Concentration strikes | the mapped cash levels are 8,000, 7,700, 7,600 and 7,000, the primary gamma concentration at cash 8,000, the call-side boundary at cash 7,800 (ES 7,805.65) and the put-side boundary at cash 7,500 (ES 7,505.65) |
| A pinning episode | roughly 11,000 lots of same-day expiry positioning sat at both cash 7,700 and cash 7,650 on Tuesday and defined the day's range between them, a clean example of the pinning mechanism at work |
| Concentration by conviction | conviction scores near price read cash 7,703 at 96.34, 7,688 at 92.61, 7,672 at 93.13, 7,657 at 90.06, 7,649 at 96.50, 7,618 at 96.71 and 7,603 at 96.97, a dense band between cash 7,600 and 7,703 so a downside move should meet repeated resistance rather than travel cleanly |
| Largest expiries | the heaviest expiry by gamma is December 17, 2026 and the heaviest by delta is March 18, 2027, the signature of structural positioning that extends well beyond the current cycle |
| Put-to-call | call volume 632,970 against put volume 962,940 for a put-to-call volume ratio of 1.52, a published open-interest ratio of 1.32, and raw open interest of 9.889 million calls against 13.912 million puts for 1.41 on a straight division, ratios computed over different expiry sets and not asserted to reconcile |
| 25-delta risk reversal and surface | the 25-delta risk reversal at negative 0.034 with implied-volatility rank at 5.40 percent and skew rank at 88.19 percent, cheap absolute volatility against expensive downside protection |
| Cohort | Weekly change |
|---|---|
| Flow composition and defensiveness | Tuesday's flow was the most defensive of the last month, the cash index absorbing approximately negative 13 billion dollars of delta, the most negative reading of the past thirty days, composed of roughly negative 7 billion from call selling and negative 6 billion from put buying that sum exactly to the total, with single-stock flow comparatively light near negative 2 billion, so the defensiveness was expressed at the index level rather than name by name |
| Duration and open interest | the desk characterizes Tuesday's activity as longer-dated relative to the tactical short-dated flow of the prior week, consistent with hedging against Thursday's producer prices and Friday's consumer prices rather than a single session, with open interest in the September contract at 1,967,470 and both first notice and expiration falling on the September 18 quarterly expiration, ten days out, so roll flow builds mechanically through the coming sessions |
| Input | |
|---|---|
| Fed policy | Tuesday's three-year note auction stopped at a 4.474 percent high yield against 4.291 percent prior, an increase of 18.3 basis points on a bid-to-cover of 2.720 against 2.710, so investors demanded meaningfully more yield to absorb the same paper; investment-bank commentary now describes the base case for the September 16 meeting as a rate increase rather than a hold, anchored on the September 4 payrolls of 162,000 against a 55,000 consensus with the prior month revised from negative 23,000 to positive 21,000 |
| Dollar and rates | the dollar index closed at 98.836, down 0.07 percent and essentially unchanged, and the ten-year yield finished at 4.792, down 0.013, with the New York Fed's one-year inflation measure easing to 3.58 percent from 3.63 percent, the counterweight to the auction result |
| Volatility | the volatility index rose 2.75 percent to 15.71 after recording its lowest intraday reading of the year on the prior session, with the volatility-of-volatility measure up 4 points to 88.69 and fixed-strike volatilities gaining 4 to 6 points this week, a still-low absolute level beginning to pay for protection from a complacent start, implied-volatility rank at 5.40 percent, one-month implied 11.18 percent over realized 8.28 percent |
| Large-cap leadership | the move understates how narrow the session was, the broad index down 0.58 percent, the Dow down 1.18 percent and the Nasdaq 100 down only 0.12 percent, mega-cap technology absorbing the session far better than the broad market, so a 0.58 percent index decline came with decisively negative breadth beneath it |
| Breadth | breadth was materially worse than the index decline implies, the advance-decline reading closing near negative 650 issues and deteriorating toward negative 658 after the close, advancing-versus-declining volume near negative 535 million shares and consolidating toward negative 840 million, with the short-term trading arbitrage near 0.80 to 0.85, not a washed-out extreme, and these are closing readings still consolidating rather than fixed values |
| Cross-asset | crude was the transmission mechanism, Brent holding near 100 dollars and the West Texas benchmark approaching 93 in the rally's fourth session, higher energy prices feeding the inflation expectations that underpin the rate-increase case, copper reaching a record 14,617 dollars per tonne with copper-linked names up 5 to 9 percent, and the dollar-yen pair breaking through 155.0 and extending, thin holiday liquidity cited in part |
| Geopolitics | the decisive driver arrived late and remains live overnight, a sequence of reported explosions on Kharg Island from 2:47 PM ET, strikes near the Jask coast from 2:55 PM ET and confirmation of United States strikes on Iranian tankers from 3:13 PM ET, with the most severe headlines, a naval warning to tankers near Kuwaiti and Bahraini ports and further tanker strikes, crossing after the 4:00 PM ET close and not yet priced by an equity session, the primary overnight risk; separately the administration directed removal of Canadian-origin products from federal procurement schedules at 4:30 PM ET |
| Institutional positioning | positioning is defensive and lengthening in duration ahead of Thursday's producer prices and Friday's consumer prices while the mechanical environment still resists large moves, a combination that argues for reduced exposure rather than a committed directional stance, consistent with a 14-day directional index at 11.59 and no trend structure to lean on |
| When | Event |
|---|---|
| Wed Sep 9 | a genuinely light United States macro day whose single first-order event is the ten-year note auction at 1:00 PM ET, the prior having cleared at 4.683 percent on a 2.530 cover, with Chinese consumer and producer prices at 9:30 PM ET Tuesday, French industrial production at 2:45 AM ET, employer costs at 10:00 AM ET, an energy short-term outlook report at 12:00 PM ET, a major consumer-hardware product event and European central bank commentary also at 1:00 PM ET, and no scheduled 8:30 AM ET release |
| Thu Sep 10 | the European central bank decision at 8:15 AM ET expected to lift the main rate to 2.65 percent from 2.40 percent, United States producer prices at 8:30 AM ET expected to accelerate to 5.3 percent annually from 4.7 percent with core at 4.6 percent against 4.2 percent, initial claims in the same window, a monthly oil market report at 8:00 AM ET and a thirty-year bond auction at 1:00 PM ET, with two large software and database earnings reports after the close |
| Fri Sep 11 | consumer prices at 8:30 AM ET with the headline expected at 0.4 percent monthly against 0.1 percent prior and 3.4 percent annually and core at 0.2 percent monthly and 2.4 percent annually, a 30 basis point expected monthly acceleration whose risk skews higher given the crude rally, and consumer sentiment at 10:00 AM ET |
| Sep 16 to 18 | the policy statement and projections at 2:00 PM ET Tuesday September 16, and the September contract expiry alongside quarterly index expiration on September 18 |
The economic releases referenced above are published on the official government calendars below. Price levels are derived from standard technical and statistical methods, and the market read is AlgoIndex's own analysis. How we grade these calls is set out in our performance methodology.
- US Bureau of Economic Analysis, Personal Income and Outlays (PCE)
- US Bureau of Economic Analysis, Gross Domestic Product
- US Bureau of Economic Analysis, release schedule
- US Census Bureau, Advance Durable Goods (M3) release schedule
- US Energy Information Administration, Weekly Petroleum Status Report
- US Department of the Treasury, auction schedule and results
- AlgoIndex performance methodology



