
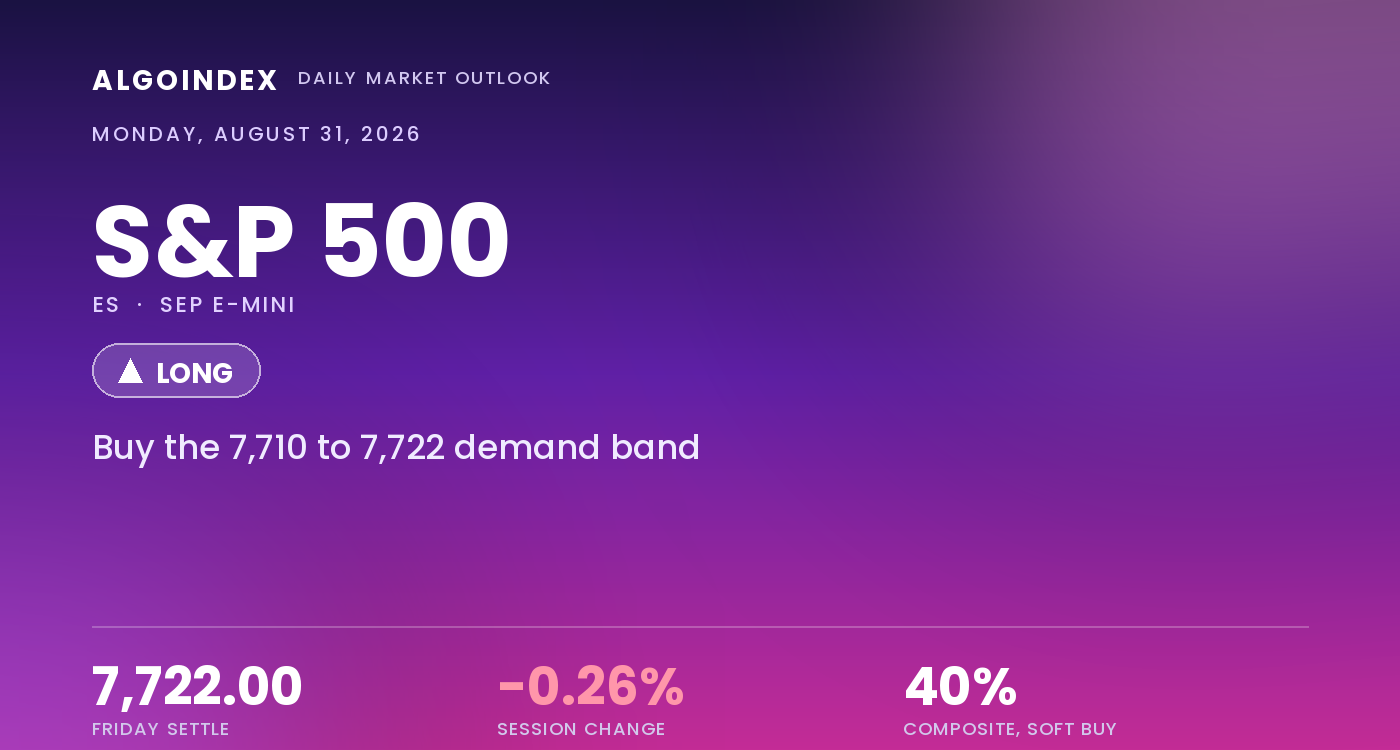
The September E-mini settled Friday regular trade at 7,722.00 (SPX 7,712), lower by 20.50 points or 0.26 percent, after a session that inverted itself at 10:00 AM ET. The contract opened at 7,733.75, pushed to a session and weekly high of 7,782.50 in the first two hours, then surrendered the entire advance and spent the afternoon grinding in a narrow band above 7,711.75. Volume of 1,456,221 contracts ran above the 1,221,215 twenty-day average, so the reversal was distributed rather than a thin-liquidity artifact. The driver was monetary. Federal Reserve Chair Kevin Warsh, speaking from 10:00 AM ET, acknowledged better summer inflation data while refusing to concede that the underlying trend had improved, and market-implied odds of a September policy hike moved from roughly 35 percent to roughly 58 percent across the session. Equities gave back an early rally built on the first half of that message.
The contradiction that tempers conviction sits in the weekly frame. Friday was a loss, but the week closed higher by 30.75 points, and the 7,782.50 weekly high was printed Friday and rejected, leaving an upper-wick weekly candle rather than broken structure. The settlement sits 11.09 points beneath the 20-day average at 7,733.09 (SPX 7,723), the first meaningful loss of that reference in the advance, yet it holds 121.42 points above the 50-day and 507.48 points above the 200-day. The damage is at the front of the curve, in rates and short-term price structure, not in the trend. Dealer positioning is net long gamma, notional positive at about 820.94 million dollars with a tilt of 1.202, which dampens rather than amplifies movement. Monday carries no scheduled United States release and a two-day weekend headline gap behind an unpriced Strait of Hormuz escalation.
The damage is at the front, not in the trend
The constructive read starts with location and mechanics. The 7,722.00 settlement holds well above the 50-day at 7,600.58 and the 200-day at 7,214.52, and that longer sequence remains properly ordered for an uptrend. Dealer positioning is net long gamma, a mean-reverting condition that pulls price toward nearby concentrations and suppresses range rather than feeding a trend, and Monday offers no United States data to override it. The base at 7,712 to 7,710 was confirmed twice on Friday, once by the session low at 7,711.75 and once by the volatility inflection level that converts to about 7,710, and the market tested it and held it into the close. The multi-indicator composite's long-horizon group still reads 67 percent buy.
The qualifier is that the front end took real damage and the trend is weak. Friday lost the 20-day average at 7,733.09, the first meaningful loss of that reference in the recent advance, and price now sits wedged between the 5-day at 7,703.25 and the 20-day just 29.84 points apart. Trend strength is genuinely absent: the directional index reads 15.23 on the 14-day and 11.96 on the 20-day, both well under the 20 line, so breakouts do not sustain here, they revert. The composite's short-horizon group averages 20 percent buy against that 67 at the long end, and breadth was clearly negative beneath the modest decline, the advance-decline line closing at minus 359. Behind all of it sit two days of weekend exposure to an unpriced supply-access story.
The 7,710 base and the 7,733 band frame Monday
Two zones define the session and they sit about 25 points apart. Below, the 7,712 to 7,710 (SPX 7,700) base is the most important support on the board, holding Friday's low and the volatility inflection level arrived at from two independent methods; a decisive loss of it exposes 7,695.00 (SPX 7,685) and the 7,693 confluence beneath. Above, the 7,733 to 7,739 (SPX 7,723 to 7,729) band pairs the 20-day average with the computed pivot and is the single cleanest read on whether Friday was a pause or a turn; reclaiming it opens the 7,750.79 one standard deviation resistance and then the 7,765.75 (SPX 7,756) first pivot resistance. The volatility surface carries the session's sharpest contradiction, implied-volatility rank in the bottom eight percent of its year while skew rank sits in the top eight, options cheap overall but downside protection specifically expensive.
Buy the defended base, respect the decision band, size it down
The plan buys the defended 7,710 to 7,722 (SPX 7,700 to 7,712) base that holds and turns, not the 7,782 rejection into overhead supply. That base combines Friday's 7,711.75 session low with the volatility inflection level at about 7,710, two independent methods arriving at the same price, so it is a defended level rather than an arbitrary line. The stop is 7,692 (SPX 7,682), placed beneath the entire support band where the 7,695.00 first pivot support and the 7,693.21 one standard deviation support sit, about 24 points from the 7,716 entry midpoint, so the position exits only after that band has genuinely failed rather than merely been tested. Targets run to the 7,739 (SPX 7,729) pivot and 20-day decision band, then the 7,766 (SPX 7,756) first pivot resistance, then 7,782 (SPX 7,772) only if the decision band is reclaimed on expanding volume. The first target sits slightly beneath a one-to-one payoff by design; it is a scale-out reference, and the structure earns its keep at the second and third. Two developments override the level map in real time. A weekend Strait of Hormuz escalation that gaps crude materially higher would transmit to equities through inflation expectations into a rate path that has already repriced hawkishly, and voids the long outright; equally, a benign weekend into a data-empty session against a speculative net short of 302,971 contracts carries genuine upside squeeze risk, which argues for the long rather than against it. Our published record lays out how we grade these calls.
Friday repriced the front of the curve without touching the trend. The E-mini lost the 20-day but held the weekly frame and closed on top of the 7,710 base that two independent methods defend. That base is the line that defines Monday, the 7,733 to 7,739 band is where the session is decided, and a sustained loss of 7,710 turns the tilt lower toward 7,695 and the confluence beneath.
A front-end repricing that spares the trend is a base to buy, not a rejection to chase. The edge is the 7,710 to 7,722 (SPX 7,700 to 7,712) base, and the failure is a sustained thirty-minute close beneath 7,710.
This is the read our members get every session, before the bell, with the levels drawn and the setup defined. See how the same dealer-positioning work turns into systematic signals.
View pricingThe complete data picture
Every number behind Monday’s plan, charted first; the full numeric reference follows underneath.
Full numeric reference, every remaining figure from the review
| Average | Value | Settle vs |
|---|---|---|
| 5-day | 7,703.25 | above by 18.75, price wedged between the 5-day and 20-day |
| 20-day | 7,733.09 | below by 11.09, the reference lost on Friday's close |
| 50-day | 7,600.58 | above by 121.42 |
| 100-day | 7,492.02 | above by 229.98 |
| 200-day | 7,214.52 | above by 507.48 |
| Level | Reference |
|---|---|
| 8,010.00 | primary gamma concentration strike, cash 8,000 |
| 7,838.50 | 52-week and contract high, cash 7,828 |
| 7,810.00 | primary call-side ceiling, cash 7,800 |
| 7,809.50 | second pivot resistance, cash 7,799 |
| 7,782.50 | Friday session and weekly high, cash 7,772, target 3 |
| 7,771.87 | three standard deviation resistance, cash 7,762 |
| 7,765.75 | first pivot resistance, cash 7,756, target 2 |
| 7,762.72 | two standard deviation resistance, cash 7,753 |
| 7,760.00 | concentrated call strike area, cash 7,750 |
| 7,750.79 | one standard deviation resistance, cash 7,741 |
| 7,738.75 | computed pivot point, cash 7,729, target 1 |
| 7,733.09 | 20-day average, cash 7,723, the decision band |
| 7,730.00 | upper edge of Friday balance, first mapped positioning level, cash 7,720 |
| 7,722.00 | September settle and opening pivot |
| 7,710.00 to 7,712.00 | defended base, Friday low and volatility inflection, cash 7,700, the line that defines Monday |
| 7,693.21 to 7,695.00 | first pivot and one SD support, cash 7,683 to 7,685, the stop shelf |
| 7,681.28 | two standard deviation support, cash 7,671 |
| 7,668.00 to 7,672.13 | second pivot and three SD support, cash 7,658 to 7,662 |
| 7,655.00 | weekly low, the higher-low pivot, cash 7,645 |
| 7,638.00 | dealer gamma flip level, cash 7,628 |
| 7,624.25 | third pivot support, cash 7,614 |
| 7,600.58 | 50-day average, cash 7,590 |
| Metric | Reading |
|---|---|
| Call gamma / put gamma | call gamma 8.01 billion against put gamma negative 2.41 billion, cash index |
| Index gamma tilt and notional | tilt 1.202, market-maker notional positive 820.94 million, net positive and dampening |
| Real-time hedging flow | negative 3.5 billion net delta on the day, driven by 2.8 billion of put buying, more than half in same-day expiries that do not carry into Monday |
| Single-stock hedging flow | negative 1.6 billion net delta, Nvidia negative 2.6 billion and Tesla negative 1.8 billion, the remaining constituents collectively positive |
| Volatility inflection and gamma flip | cash 7,700 (ES 7,710) and cash 7,628 (ES 7,638), both beneath spot |
| Concentration strike, call ceiling, put base | cash 8,000 (ES 8,010), cash 7,800 (ES 7,810), cash 7,500 (ES 7,510) |
| Put-to-call | open interest 1.43, put volume 913,116 over call volume 627,351 for a 1.46 volume ratio |
| 25-delta risk reversal | negative 0.032, a mild downside skew, cash index |
| Volatility surface | one-month implied 11.52 percent over realized 10.62 percent, implied-vol rank 7.59 percent, skew rank 92.89 percent |
| Directional pivot | cash 7,650 (ES 7,660), constructive above, the desk pivot last revised Aug 20 |
| Cohort | Weekly change |
|---|---|
| Equity fund speculators | net short increased 35,462 contracts to 302,971 in the week ended Aug 25, a larger short base that is also squeeze fuel into a benign headline |
| Fund managers | net long cut 5,608 contracts to 946,814, longs trimmed in the week ahead of Friday's repricing |
| Input | |
|---|---|
| Fed policy | Chair Warsh's 10:00 AM ET remarks acknowledged better inflation data while refusing to concede the trend had improved; September hike odds moved from roughly 35 percent to roughly 58 percent |
| Dollar and rates | the 10-year yield rose 0.049 to 4.718 percent and the dollar index gained 0.548 to 99.677, a real-yield event confirmed by a sharp gold decline |
| Index dispersion | the E-mini fell 0.26 percent while the Nasdaq contract fell 0.69 percent, the weakness concentrated in a few large names |
| Large-cap leadership | Nvidia fell about 5 percent and Tesla about 2 percent, the Nvidia decline substantially a mechanical expiration-hedge unwind that does not repeat Monday |
| Breadth | advance-decline minus 359 and advancing-minus-declining volume about minus 685 million shares, composite tick 21 and trading index 1.05, persistent unhurried distribution |
| Semiconductors | the sector fund fell about 4 percent, rejected its gamma reference near 570 and broke a positioning level near 565 to close 553 |
| Volatility | the volatility index closed 14.42 down 0.55 percent while volatility-of-volatility rose 4.5 percent to 86.61, hedging demand moving into convexity rather than simple downside |
| Geopolitics | a late-afternoon Strait of Hormuz escalation landed after the 4:00 PM ET close and was not priced, leaving two days of weekend supply-access exposure |
| When | Event |
|---|---|
| Sun Aug 30 | futures reopen at 6:00 PM ET after roughly 49 hours closed, carrying unhedged weekend headline exposure |
| Mon Aug 31 | no scheduled United States release, German preliminary inflation at 8:00 AM ET the only set-piece |
| Tue Sep 1 | Palo Alto Networks reports after the close |
| Wed Sep 2 | Broadcom reports, the more consequential semiconductor read-through for the index |
| Fri Sep 4 | the August employment report, the week's dominant catalyst and the reason not to commit full size to a Monday directional view, with Labor Day on Sep 7 and monthly options expiration on Sep 18 |
The economic releases referenced above are published on the official government calendars below. Price levels are derived from standard technical and statistical methods, and the market read is AlgoIndex's own analysis. How we grade these calls is set out in our performance methodology.
- US Bureau of Economic Analysis, Personal Income and Outlays (PCE)
- US Bureau of Economic Analysis, Gross Domestic Product
- US Bureau of Economic Analysis, release schedule
- US Census Bureau, Advance Durable Goods (M3) release schedule
- US Energy Information Administration, Weekly Petroleum Status Report
- US Department of the Treasury, auction schedule and results
- AlgoIndex performance methodology



