
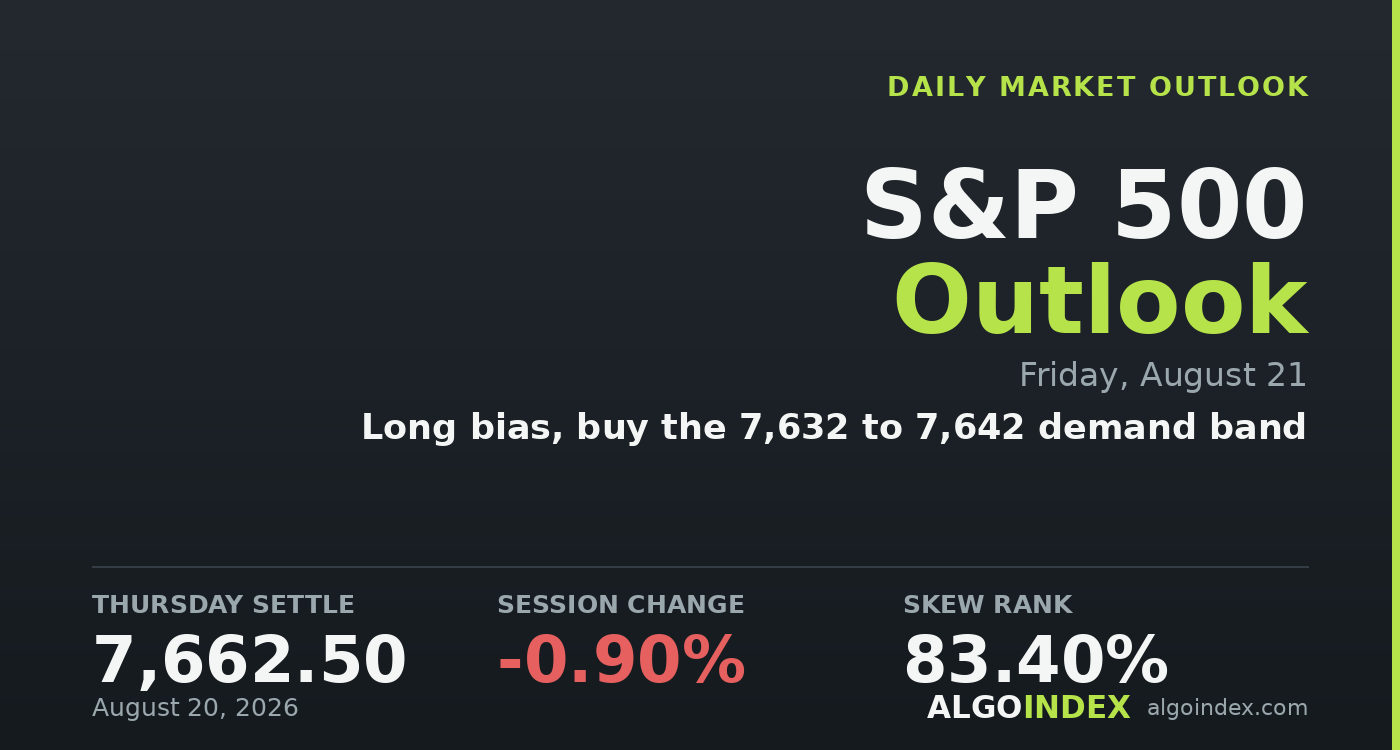
The September E-mini settled at 7,662.50, and the cash index gave back about 0.9 percent to close near 7,641, its weakest finish in five sessions. It wasn't a violent break, just an orderly slide inside a 61-point range, but the character of the selling is what counts. A large discount retailer dropped 9 percent on soft sales, its worst day since 2022, and that landed on top of a retail sales print of minus 0.6 percent when plus 0.1 was expected. The consumer is the story here, and it's not a flattering one.
The one support that had lifted risk the day before was gone by the open. Long-end Treasury yields reversed higher even after the Treasury Secretary floated larger buyback operations and a coming fiscal plan, so the market read the move as treating a symptom rather than the cause. The thirty-year inflation-protected auction cleared at 2.973 percent against 2.473 percent before, a half-point jump that shows the concession buyers are demanding. Add crude above 85 dollars pressing the inflation side, and equities walked into Friday without a rate tailwind.
A cushion that expires on Friday
The constructive case is location and structure. The nine-day raw stochastic sits at 5.39 percent against a 20-day reading near 67, the numerical signature of a sharp, contained pullback inside a longer uptrend that still holds above every intermediate and long average. Dealer positioning is also net positive by the published measures, a gamma index of 1.308 and positive notional of 281 million dollars, and that cushion absorbed part of a very large negative flow day. Price is sitting right on the 20-day average at 7,668.91, so the first real signal Friday is whether the opening hour accepts or rejects that line.
The caution is in the flow and the calendar. Roughly half of the day's negative 10 billion dollars of hedging delta came from longer-dated put buying, which is positioning ahead of named catalysts rather than a reaction to today. And the cushion itself is temporary: the top gamma and top delta expirations both land Friday, so a large slice of the dealer long gamma that's dampened this week's ranges rolls off at the settlement. The market enters its biggest structural event of the month sitting just under the 7,683 gamma flip, with the stabilizer set to expire.
The 20-day is the line
Everything hinges on a tight band. The 20-day average at 7,668.91 and the gamma flip at 7,683.45 form the overhead wall, and reclaiming that band restores the dampening dynamic that held for most of the week. Beneath price, today's low at 7,657.75 and the 7,630 to 7,642 confluence form the base, where the four-week 38.2 percent retracement, the first pivot support and the computed target all stack within two points of each other. Implied-vol rank near 11 says movement is cheap, while skew rank above 83 says protection isn't, the same cheap-vol, expensive-puts setup that's defined the whole week.
Buy the band, aim at the flip
The plan buys the 7,632 to 7,642 confluence on a pullback, working with the dampening environment ahead of Friday's expiration rather than betting on a trend, and only at half size because the flash purchasing managers data prints at 09:45 shortly after the open. The stop is 7,617, beneath the one-standard-deviation support at 7,618 that would be the first sign the pullback is extending, about 20 points from the middle of the entry. Targets run to the 20-day at 7,668.91, then the 7,683 gamma flip, then the 7,708 five-day average on an extension. A sustained trade below 7,618 opens the 7,600 pairing and the setup shouldn't be re-entered, and a purchasing managers composite well beneath its 53.9 forecast, paired with another long-end backup, is the read that turns soft data into a growth scare. performance methodology sets out how we grade these calls.
The market enters the month's biggest structural event sitting just under the gamma flip, with the very cushion that's dampened this week's ranges scheduled to roll off at the settlement. Calm on the surface, defensive underneath.
A washed-out oscillator into an expiration that pins is a dip worth buying at half size. The edge is the 7,632 to 7,642 band, and the failure is 7,617.
This is the read our members get every session, before the bell, with the levels drawn and the setup defined. See how the same dealer-positioning work turns into systematic signals.
View pricingThe complete data picture
Every number behind Friday’s plan, charted first; the full numeric reference follows underneath.
Full numeric reference, every remaining figure from the review
| Average | Value | Settle vs |
|---|---|---|
| 5-day | 7,708.35 | below by 45.85 |
| 20-day | 7,668.91 | below by 6.41 |
| 50-day | 7,583.03 | above by 79.47 |
| 100-day | 7,440.82 | above by 221.68 |
| 200-day | 7,196.20 | above by 466.30 |
| Level | Reference |
|---|---|
| 8,020.45 | primary gamma concentration strike, cash 8,000 |
| 7,920.45 | primary call-side ceiling, cash 7,900 |
| 7,838.50 | 52-week high, the record |
| 7,745.45 | volatility inflection level, cash 7,725 |
| 7,708.35 | five-day average, 1 SD resistance |
| 7,683.45 | dealer gamma flip level, cash 7,663 |
| 7,668.91 | twenty-day average, the pivot |
| 7,662.50 | September settle |
| 7,632 to 7,642 | primary demand band, entry, three-way confluence |
| 7,618.12 | one SD support, stop shelf |
| 7,600.17 | second pivot support, 40-day crossover |
| 7,520.45 | primary put-side support base, cash 7,500 |
| Metric | Reading |
|---|---|
| Call gamma | 3.03 billion |
| Put gamma | negative 114.4 million |
| Cash-index gamma notional | positive 281.0 million, gamma index 1.308 |
| Index hedging flow | negative 10 billion delta, about half longer-dated puts |
| Put vs call day volume | 843,018 vs 626,602, ratio 1.345 |
| Put-to-call open interest | 1.31 |
| 25-delta risk reversal | negative 0.038 |
| Implied-vol rank | 10.71 percent |
| Skew rank | 83.40 percent |
| Input | |
|---|---|
| Long-end Treasury yields | reversed higher, rate tailwind gone |
| 30-year TIPS auction | cleared 2.973%, up from 2.473% |
| Crude oil | above 85 dollars, inflation side |
| Volatility index | 16.02, up 8% |
| Vol-of-vol index | 89.86, up 4% |
| Money market assets | 7.93 trillion, up 900 million |
| When | Event |
|---|---|
| Fri Aug 21 | monthly options expiration, US flash PMIs 09:45 |
| Wed Aug 26 | PCE price data, major chipmaker earnings |
| Aug 27-29 | central-bank symposium, Fed Chair speaks Aug 28 |
| Wed Sep 16 | rate decision with updated projections |
The economic releases referenced above are published on the official government calendars below. Price levels are derived from standard technical and statistical methods, and the market read is AlgoIndex's own analysis. How we grade these calls is set out in our performance methodology.
- US Census Bureau, New Residential Construction (housing starts and building permits)
- US Bureau of Labor Statistics, Import and Export Price Indexes
- Federal Reserve, Industrial Production and Capacity Utilization (G.17)
- Federal Reserve, FOMC calendar and meeting minutes
- US Department of the Treasury, auction schedule and results
- AlgoIndex performance methodology



