
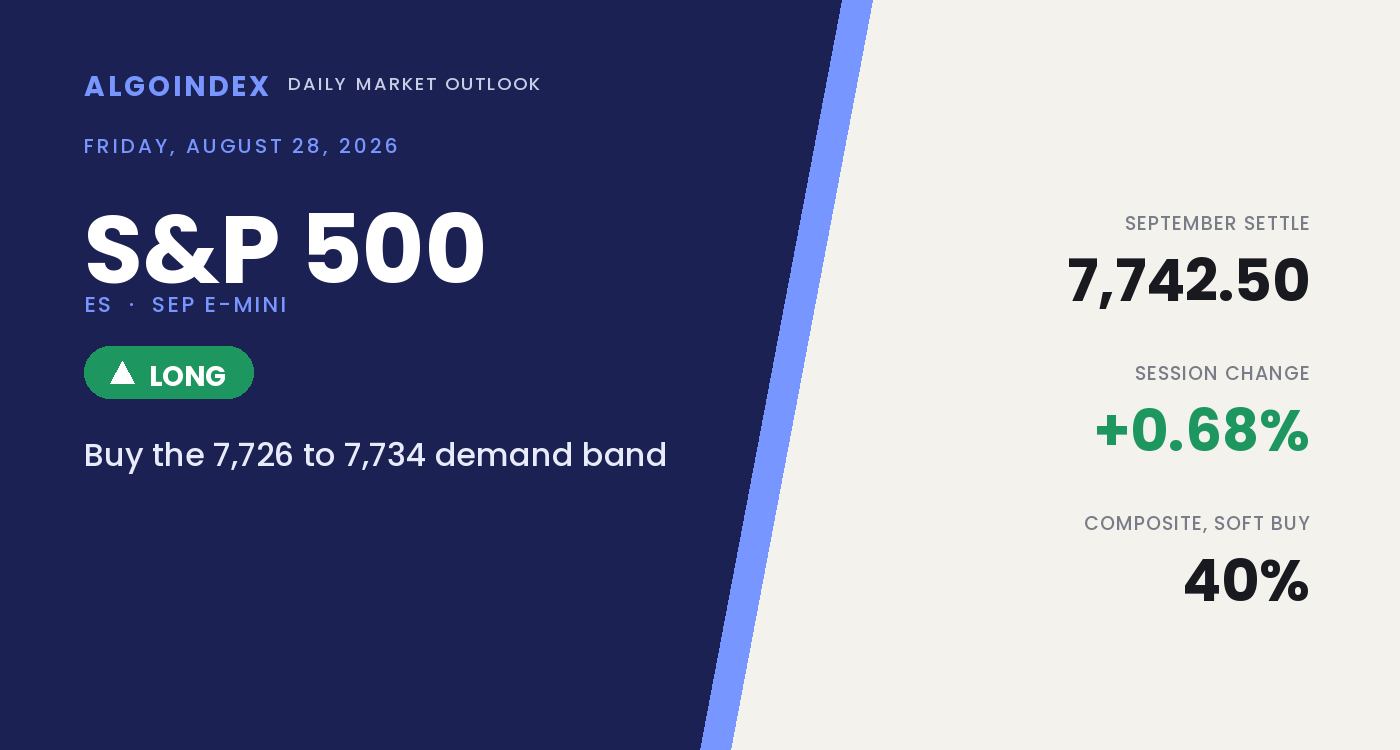
The September E-mini settled Thursday regular trade at 7,742.50 (SPX 7,731), higher by about 0.68 percent, with the cash index up 55.29 points or 0.72 percent at 7,730.99. Both finished in the upper quarter of their ranges, and the close pushed price back above the 20-day average at 7,733.38 (SPX 7,722) after several sessions of drift beneath it. The advance had a single author. Results and forward guidance from the dominant artificial-intelligence chipmaker, released after Wednesday close, reset appetite across the technology complex, lifting semiconductors about 3 percent and enterprise software about 7 percent. The Nasdaq 100 gained 1.43 percent against the broad index at 0.72 and the Dow at 0.20. This was a technology event the S&P inherited rather than a broad participation day, and that distinction sets the terms for Friday.
The contradiction sits in the breadth data. The index gained three quarters of a percent while the New York advance-decline line closed at negative 217 and the volume-weighted measure at negative 8.07 million shares. More issues fell than rose, and the ones that fell traded modestly heavier, so the advance rests on a small number of very large names rather than the median stock. That narrowness is not a sell signal, but it thins the base beneath the print. Dealer positioning is net long gamma, with a market-maker notional of plus 264.49 million dollars, which favors mean reversion toward the dense concentration band above rather than trend extension. Options are cheap, the implied one-day move near 0.62 percent, into a Friday that carries a symposium speaker and a payrolls revision at 10:00 AM ET and a full weekend hold behind the close.
The reclaim of the 20-day is thin
The constructive read starts with location. Thursday settle at 7,742.50 sits above every average in the stack, and the 20-day through 200-day sequence is properly ordered for an uptrend, each shorter average above the next longer one. Price closed 9.12 points above the 20-day at 7,733.38 after working beneath it for several sessions, which changes the short-term posture. Momentum backs a continuation rather than a turn. Short-dated fast stochastics have reset, the 9-day at 44.80 and the 14-day at 35.47 in the lower middle of their range, while the 50-day and 100-day hold near 77 and 90. Relative strength sits in the mid-50s across every window with no overbought condition anywhere, so there is room above.
The qualifier is that the reclaim is thin and the trend is weak. The overnight session has already traded back to 7,729.75, beneath the 20-day again, so the average is the immediate battleground rather than a settled matter. Trend strength is genuinely low. The directional index reads 19.35 on the 9-day and 14.76 on the 14-day, both under the 20 line that marks an established trend, and the longer settings are lower still. The multi-indicator composite closed at 40 percent buy with soft strength, its short-horizon group averaging 20 percent while the long-horizon stack holds 67. The mechanical tailwind that carried Thursday afternoon, a same-day short-call unwind around the 7,730 cash strike, is spent, so Friday opens without it.
The 7,733 shelf is where Friday turns
Two zones frame Friday. Below, the 7,733.38 to 7,733.58 (SPX 7,722) shelf pairs the 20-day average with the computed pivot, the level the overnight session is already sitting on and the pivot on which the session character turns. Holding above it into 10:00 AM ET sets up a run at the 7,755.50 (SPX 7,744) session high; losing it opens the 7,711 to 7,713 (SPX 7,700) confluence where the first pivot support, the one standard deviation support and the mapped positioning support converge within 1.2 points. Above, the cap is a combined band at 7,761 to 7,769 (SPX 7,750 to 7,757), where the computed target level, the first pivot resistance and the two short-term average stall levels stack together, and it is where a chase of the current print pays the worst. Volatility is priced near the bottom of its year, thirty-day implied at 11.70 percent under realized 12.12 percent, while the mild downside skew of the 25-delta risk reversal shows protection still bid.
Buy the pullback, respect the cap, size it down
The plan buys a pullback into the 7,726 to 7,734 (SPX 7,714 to 7,722) shelf that holds and turns, not the 7,742 close into a heavy overhead band. That shelf combines the reclaimed 20-day average and the computed pivot, so it is a defended level rather than an arbitrary line. The stop is 7,711 (SPX 7,700), tucked beneath the confluence where the first pivot support at 7,711.67, the one standard deviation support at 7,712.67 and the mapped positioning support at 7,711.51 converge within 1.2 points, about 19 points from the 7,730 entry midpoint. Targets run to the 7,755 (SPX 7,744) session high, then the 7,764 (SPX 7,753) first pivot resistance above the computed target level, then 7,772 (SPX 7,761) only if momentum carries through the 7,765.50 to 7,768.75 average stall band on expanding volume. Two developments override the level map in real time. A hawkish surprise from the 10:00 AM ET symposium speaker, or a materially weaker preliminary payrolls revision than the positive 157,000 consensus arriving in the same minute, invalidates the long regardless of price, so the setup stands down across the 9:55 AM to 10:15 AM ET reaction window. Weekend exposure warrants separate consideration, since two days and a continuing symposium separate Friday close from the Sunday reopen and the Middle East situation is unresolved. Our published record lays out how we grade these calls.
The gap reclaimed the 20-day on a single, narrow, technology-led advance, but the reclaim is thin and the overnight session has already slipped back beneath it. The 7,733 shelf where the 20-day and the pivot meet is where Friday either proves the reclaim or fails it. Constructive above it into the symposium, capped at 7,761 to 7,769, and a decisive loss of 7,700 turns the tilt lower.
A thin reclaim on negative breadth is a pullback to buy, not a print to chase. The edge is the 7,726 to 7,734 (SPX 7,714 to 7,722) shelf, and the failure is a decisive break below 7,700 that holds.
This is the read our members get every session, before the bell, with the levels drawn and the setup defined. See how the same dealer-positioning work turns into systematic signals.
View pricingThe complete data picture
Every number behind Friday’s plan, charted first; the full numeric reference follows underneath.
Full numeric reference, every remaining figure from the review
| Average | Value | Settle vs |
|---|---|---|
| 5-day | 7,704.40 | above by 38.10, below the 20-day, the consolidation signature |
| 20-day | 7,733.38 | above by 9.12, the reclaimed pivot shelf |
| 50-day | 7,600.69 | above by 141.81 |
| 100-day | 7,492.08 | above by 250.42 |
| 200-day | 7,214.55 | above by 527.95 |
| Level | Reference |
|---|---|
| 8,011.51 | primary gamma concentration strike, cash 8,000 |
| 7,911.51 | primary call-side ceiling, cash 7,900 |
| 7,838.50 | 52-week and contract high, cash 7,827, set Aug 13 |
| 7,811.51 | upper mapped positioning magnet, cash 7,800 |
| 7,786.33 | second pivot resistance, cash 7,775 |
| 7,784.68 | two standard deviation resistance, cash 7,773 |
| 7,772.33 | one standard deviation resistance, cash 7,761, target 3 |
| 7,765.50 to 7,768.75 | 18-day and 9-day average stall band, cash 7,754 to 7,757 |
| 7,764.42 | first pivot resistance, cash 7,753, target 2 |
| 7,761.69 | computed target level, cash 7,750 |
| 7,755.50 | Thursday session high, cash 7,744, target 1 |
| 7,742.50 | September settle |
| 7,733.38 to 7,733.58 | 20-day average and computed pivot, cash 7,722, the shelf Friday turns on |
| 7,726 to 7,734 | primary demand shelf, the entry |
| 7,711.51 to 7,712.67 | positioning, first pivot and one SD support, cash 7,700, the stop shelf |
| 7,702.75 | Thursday session low, cash 7,691 |
| 7,698.88 to 7,700.32 | 9-day average crossing and two SD support, cash 7,687 to 7,689 |
| 7,690.84 | three standard deviation support, cash 7,679 |
| 7,686.51 | volatility inflection level, cash 7,675 |
| 7,661.51 | directional pivot, cash 7,650, refreshed Aug 20 |
| 7,642.51 | dealer gamma flip level, cash 7,631 |
| Metric | Reading |
|---|---|
| Call gamma / put gamma | about 4.5 billion / negative 2.0 billion, cash index |
| Index gamma tilt and notional | tilt 1.107, market-maker notional plus 264.49 million, net positive and dampening |
| Real-time hedging flow | about negative 1.3 billion net delta on the day, call and put buying, more than half in same-day expiries |
| Single-stock hedging flow | plus 5.5 billion net delta, a 30-session high, 4.6 billion from the dominant chipmaker in longer-dated calls |
| Volatility inflection and gamma flip | cash 7,675 (ES 7,686.51) and cash 7,631 (ES 7,642.51), both well beneath spot |
| Concentration strike, call ceiling, put base | cash 8,000 (ES 8,011.51), cash 7,900 (ES 7,911.51), cash 7,500 (ES 7,511.51) |
| Put-to-call | open interest 1.43, corroborated at 1.43 on the cash index, put volume 570,826 over call volume 399,592 |
| 25-delta risk reversal | negative 0.038, a mild downside skew, cash index |
| Directional pivot | cash 7,650, ES 7,661.51, constructive above, last set Aug 20 |
| Options impact and next-expiration gamma | next-expiration gamma 8.16 percent |
| Input | |
|---|---|
| Driver | results and forward guidance from the dominant artificial-intelligence chipmaker after Wednesday close reset technology risk appetite, semiconductors up about 3 percent and enterprise software about 7 percent |
| Index dispersion | Nasdaq 100 plus 1.43 percent, cash S&P plus 0.72, Dow plus 0.20, a technology event the broad index inherited |
| Breadth | New York advance-decline minus 217, volume-weighted advance-decline minus 8.07 million shares, arms index 0.850, a narrow advance on negative breadth |
| Dollar and rates | dollar index effectively unchanged at 99.135, the 10-year yield up 0.009 to 4.669 percent, neither expressing a view |
| Jobless claims | initial 203,000 against a 208,000 consensus, continuing 1.778 million, both improved and pointing to a stable labor market |
| Core PCE | 3.7 percent year over year, one tenth above the 3.6 consensus and level with the prior month |
| Volatility | volatility index 14.50 down 4.73 percent, thirty-day implied 11.70 percent under realized 12.12 percent, implied-vol percentile at 4 percent |
| Single-stock flow | index-constituent hedging flow plus 5.5 billion net delta, a 30-session high, 4.6 billion from the single chipmaker in longer-dated calls |
| When | Event |
|---|---|
| Fri Aug 28 | at 10:00 AM ET the symposium speaker and the preliminary benchmark payrolls revision 157,000 against a prior minus 911,000 arrive together, final consumer sentiment 51, a Federal Reserve speaker at 9:00 AM ET before the open |
| Sat Aug 29 | the central-bank symposium continues |
| Mon Aug 31 | Chicago regional activity index |
| Tue Sep 1 | manufacturing activity index consensus 55.2 and job openings 7.3 million |
| Wed Sep 2 | private payrolls and a Bank of Canada decision, ahead of the Sep 7 Labor Day holiday and the Sep 18 monthly options expiration |
The economic releases referenced above are published on the official government calendars below. Price levels are derived from standard technical and statistical methods, and the market read is AlgoIndex's own analysis. How we grade these calls is set out in our performance methodology.
- US Bureau of Economic Analysis, Personal Income and Outlays (PCE)
- US Bureau of Economic Analysis, Gross Domestic Product
- US Bureau of Economic Analysis, release schedule
- US Census Bureau, Advance Durable Goods (M3) release schedule
- US Energy Information Administration, Weekly Petroleum Status Report
- US Department of the Treasury, auction schedule and results
- AlgoIndex performance methodology



