
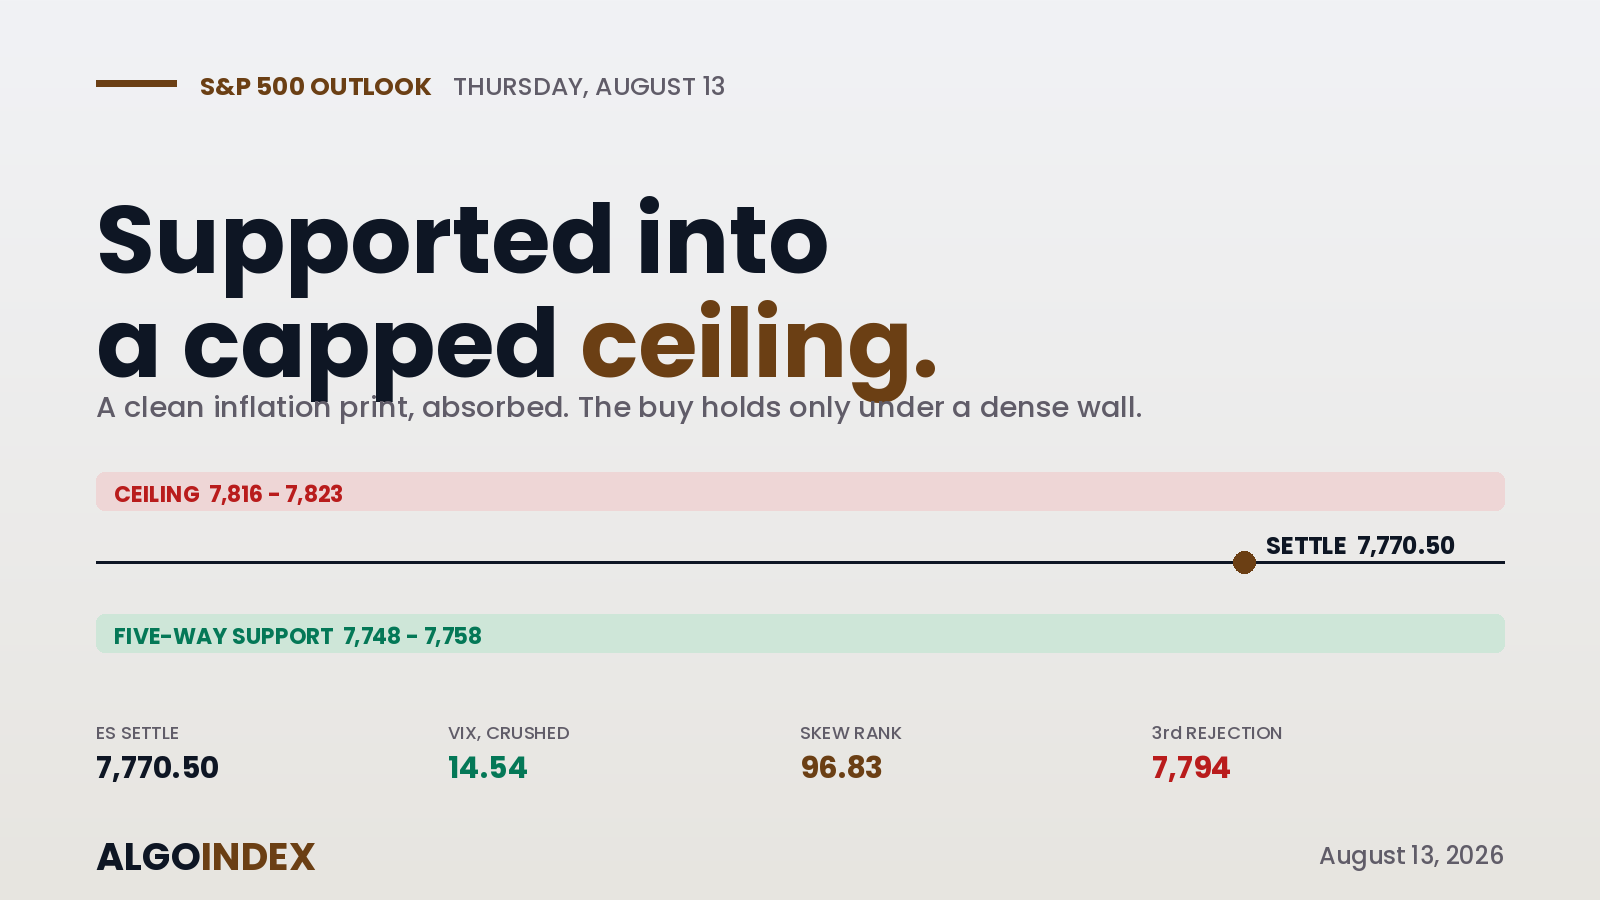
The July inflation report landed at 8:30 on Wednesday morning exactly on forecast across all four lines, and the S&P did what a positively positioned market does with a clean number: it spiked, and then it spent six hours failing to hold the spike. The September E-mini settled at 7,770.50, up a third of a percent, back essentially on its own pivot after tagging 7,794 in the first hour and giving it all back.
That failure is the tell. The market got its bullish catalyst and could not convert it into a new high, because it is waiting for the second half of the inflation pair, Thursday's producer print. The structural picture is the cleanest contradiction in weeks, and it is about price, not direction. Dealer positioning is emphatically dampening, with gamma notional at plus 883 million and the volatility inflection at 7,742.70 sitting below the settle, so hedging absorbs movement in both directions and the path of least resistance is a grind. But that grind is walking straight into the densest resistance on the board: the dealer call ceiling at 7,822.70, the record high at 7,820.25, and pivot R2 at 7,816.50, all inside six points. Supported into a capped level.
The rejection that keeps repeating
The 7,790 to 7,795 band has now capped this market three sessions running, on August 10, 11 and 12. It coincides with the heaviest short-horizon supply on the chart, and above it the volume profile thins out immediately toward the record. So the market has to grind through a genuine supply shelf to reach the ceiling, and once through it the move to 7,816 should be fast. That is the whole shape of Thursday: a defined shelf to clear, a defined ceiling to fade.
The one mechanical tailwind is real. When implied volatility fell and spot rose on Wednesday, put deltas across the dealer book declined, forcing the market makers who were short those puts to buy back the futures they held as a hedge. That is a self-reinforcing bid that strengthens as price rises, and it is the reason a positive-gamma market can drift up for days after a volatility-crushing event. It also reverses the instant implied volatility rises again, which is exactly what a hot producer print would do.
Narrow leadership, first crack
Look under the 0.26 percent index gain and the advance is narrow to the point of fragility. The memory complex rose about 8 percent and a server maker jumped 19 percent, while two of the largest software weights fell more than 2 percent each. The index rose because roughly a third of its weight was repriced on a hardware-scarcity story and another large slice was sold. Rotations shaped like that are powerful while the scarcity story holds and fragile when it is questioned, because the same concentrated flow reverses through the same narrow door. And after the close, the first crack appeared: an AI-chip specialist reported collapsing hardware revenue and a 14 percent gross margin. If that reads across on Thursday's open, it removes the exact leadership that produced Wednesday's gain.
Buy the shelf, respect the print
The plan buys the five-way demand confluence at 7,748 to 7,758, where pivot S1, three standard-deviation methods and Wednesday's actual low stack inside ten points, on a hold rather than a touch. The stop sits below 7,738, beneath the inflection where dealer hedging flips from absorbing to amplifying, and targets run to the 7,771 pivot, then 7,793, then the 7,816 ceiling. Speculative funds are net short and offside above 7,794, which is covering fuel. But this is a print-day plan: if core monthly producer inflation comes in at 0.4 percent or higher against its 0.3 percent forecast, the setup does not exist, because confluence support does not hold against a repricing of September policy odds. Half size, no entries before 9:45, and mind the 30-year auction after Wednesday's 432 billion dollar deficit. How we grade these calls afterward is in our performance methodology.
The market got its bullish catalyst, spiked, and then spent six hours failing to hold the spike. That is a market waiting for the next number.
A market pinned between a dealer base it cannot fall through and a dealer ceiling it cannot rise through does not stay there, it waits for the number that frees it.
This is the read our members get every session, before the bell, with the levels drawn and the setup defined. See how the same dealer-positioning work turns into systematic signals.
View pricingThe complete data picture
Every number behind Wednesday’s plan, charted first; the full numeric reference follows underneath.
Full numeric reference , every remaining figure from the review
| Average | Value | Settle vs |
|---|---|---|
| 5-day | 7,768.70 | +1.80 (hugging it) |
| 20-day | 7,596.92 | +173.58 |
| 50-day | 7,555.65 | +214.85 |
| 100-day | 7,371.23 | +399.27 |
| 200-day | 7,175.47 | +595.03 |
| YTD | 7,232.21 | +538.29 |
| Level | Reference |
|---|---|
| 7,725.50 | pivot S2 (first downside target) |
| 7,702.70 | dealer risk pivot (bearish below) |
| 7,647.70 | dealer gamma flip level |
| 7,630.68 | 38.2% from four-week high |
| 7,596.92 | 20-day average |
| 7,422.70 | structural put-side base |
| Metric | Reading |
|---|---|
| Gamma notional / tilt | +883.2M / 1.292 (dampening) |
| One-month implied / realized | 12.16% / 14.02% |
| Implied-vol rank / skew rank | 11.70% / 96.83% |
| Options-implied move | 59.31 index points |
| Model implied one-day move | 0.72% |
| Real-time hedging flow | -3B to +4B to -1.5B, no net move |
| Put-to-call OI | 1.28 |
| Vanna mechanism | falling IV + rising spot = dealer buying |
| Cohort | Net |
|---|---|
| Asset managers | long 937,033 (real money long) |
| Leveraged funds | short 329,999 (+82,598 shorts, offside) |
| Dealers | short 716,826 (mechanical hedge) |
| Read | fast money short and offside above 7,794 |
| Small-cap gamma | NEGATIVE (amplifies) vs large-cap positive |
| Open interest | 2,069,808 |
| Input | |
|---|---|
| CPI (all four lines) | exactly on forecast, 3.4% / 2.5% core |
| Sept hike odds | 40% from 51% |
| 10-year yield | 4.692%, refused to rally |
| July deficit | -432.3B vs -346B forecast |
| Leadership | narrow AI hardware; SMCI +19%, memory +8% |
| Cerebras | hardware miss, first crack |
| When | Event |
|---|---|
| Thu 08:15 | Fed dissenter speaks (pre-PPI) |
| Thu 08:30 | US PPI 4.9% y/y, core monthly 0.3% (accelerating) |
| Thu 08:30 | Jobless claims 202k |
| Thu 13:00 | 30-year bond auction (after weak 10-year) |
| Fri 08:30 | US retail sales |
| Fri 10:00 | Consumer sentiment + inflation expectations |



