
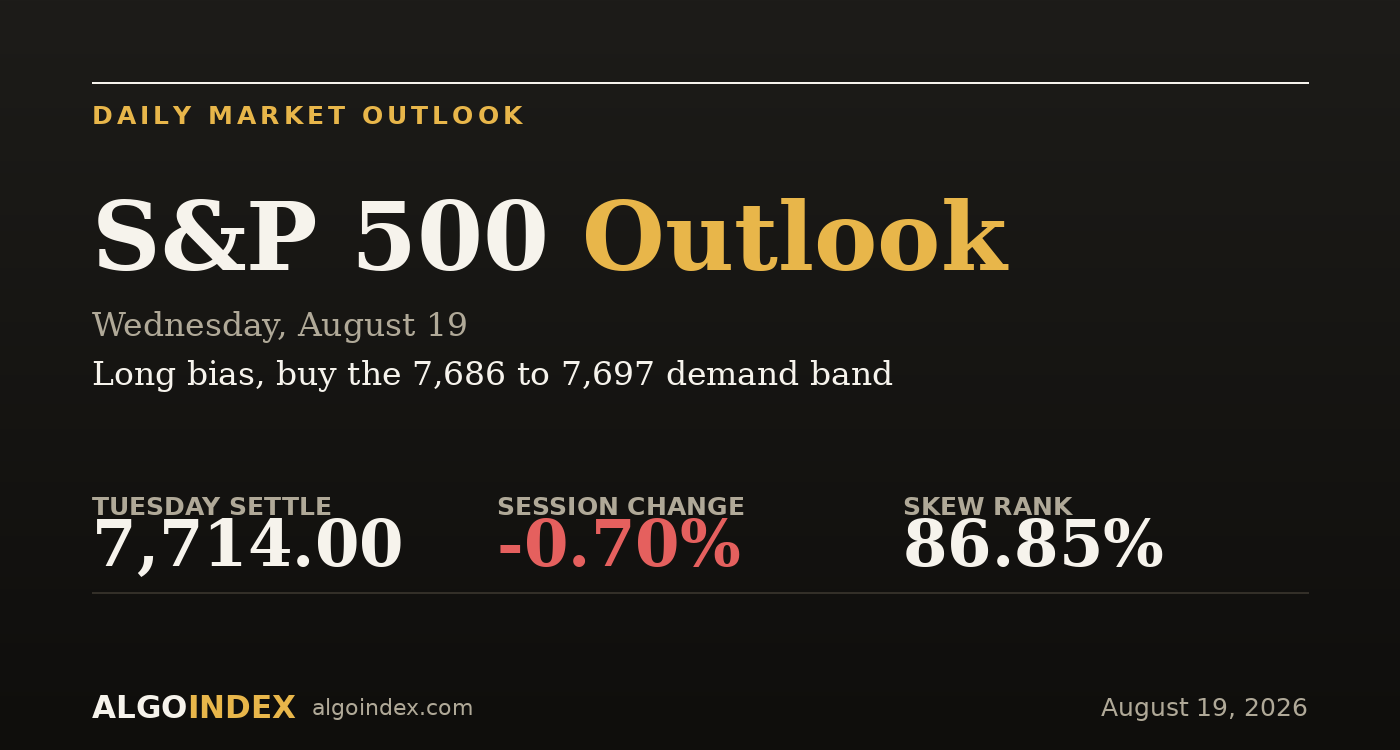
Tuesday's selling came from one place. The chip complex fell about 5 percent, the Nasdaq 100 dropped 1.7 percent, and the S&P gave back 0.7 percent to settle at 7,714. A plausible trigger crossed the feed at 2:39 in the afternoon, when a senior figure at a large AI laboratory said the firm had slowed the scaling of its frontier training runs. In an index whose leadership is concentrated in exactly that theme, the read is simple: this was a semiconductor event, not a macro one.
The number that governs Wednesday is where the settle sits relative to one line. Dealer positioning flips from dampening to amplifying at 7,720.45 in the futures, and the contract closed at 7,714, about six points beneath it. That's the boundary between hedging that absorbs moves and hedging that feeds them, and the market closed on the wrong side by a margin small enough that the open can flip it either way. Everything that follows is conditioned on that line.
One spent impulse inside an intact trend
The technical evidence is split, and the split is the useful part. The nine-day stochastic has collapsed to 2.85, about as washed out as short-term momentum gets, while the hundred-day still reads above 91. Price holds above its 20, 50, 100 and 200-day averages and has slipped below only the five-day. That's a spent selling impulse sitting inside a medium-term advance that hasn't broken, which is the setup for a reflex bounce, provided the demand band holds.
The reason the trade is conditional and not a simple dip-buy is the environment plus the calendar. Beneath the flip, dealer hedging amplifies, so a long entered here works against the mechanical backdrop until 7,720.45 is reclaimed. And the afternoon stacks a 20-year auction at one o'clock into Federal Reserve minutes at two, on a long end already under stress from firmer crude and higher yields. Bad bond-market news is the live risk, and it arrives on a schedule.
Cheap volatility, expensive protection
The options surface says two things at once. One-month implied volatility at 12.03 sits below one-month realized at 13.46, with an implied-volatility rank near 11, so options are cheap relative to the movement the market is actually delivering, which favors owning premium rather than selling it. At the same time the skew rank near 87 says the downside is the richly bid part of that surface. Cheap volatility, expensive puts, and a market that has already paid up for protection into the exact afternoon it now has to trade through.
Buy the washout, respect the flip
The plan buys the 7,686 to 7,697 band, where four methods and a 96-conviction dealer strike at 7,688 line up, and it does so as a bounce trade rather than a trend trade while price sits beneath the flip. The stop is 7,650, below the 7,655 structural shelf so the whole secondary support structure has to fail to be wrong, which is about 42 points from the middle of the entry. Targets run to the 7,720 flip, then the 7,742 magnet, then the 7,765 inflection. A fifteen-minute close beneath 7,655 voids it, and a tailing auction or minutes read as materially more hawkish than the data justifies is the exit regardless of level. performance methodology sets out how we grade these calls.
The index sold a single theme, not the economy, and it closed a handful of points on the wrong side of the one line that decides whether dealer hedging helps or hurts. Wednesday resolves it, and it resolves it in the afternoon.
A washed-out oscillator inside an intact trend is a bounce worth buying. Beneath the flip and ahead of the minutes, it's a bounce worth buying small.
This is the read our members get every session, before the bell, with the levels drawn and the setup defined. See how the same dealer-positioning work turns into systematic signals.
View pricingThe complete data picture
Every number behind Wednesday’s plan, charted first; the full numeric reference follows underneath.
Full numeric reference, every remaining figure from the review
| Average | Value | Settle vs |
|---|---|---|
| 5-day | 7,764.15 | price below by about 50 |
| 20-day | 7,646.11 | above by about 68 |
| 50-day | 7,571.92 | above by about 142 |
| 100-day | 7,417.89 | above by about 296 |
| 200-day | 7,189.53 | above by about 524 |
| Year-to-date | 7,245.56 | above |
| Level | Reference |
|---|---|
| 7,920.45 | call-side resistance strike |
| 7,795.45 | desk pivot, broken Monday |
| 7,765.45 | volatility inflection level |
| 7,742.45 | strike 98.58, strongest magnet |
| 7,731.58 | computed pivot, first decision band |
| 7,720.45 | dealer gamma flip level |
| 7,714.00 | September settle |
| 7,686 to 7,697 | primary demand band, strike 7,688.45 |
| 7,655.45 | structural support shelf |
| 7,632 to 7,642 | dense confluence, 38.2% retracement |
| Metric | Reading |
|---|---|
| Put gamma | 1.35 billion |
| Call gamma | 208.3 million |
| Put-to-call gamma ratio | above 6 to 1 |
| Aggregate positioning notional | positive 456 million dollars |
| Index hedging flow | positive 3 billion delta, put selling |
| Single-stock flow | negative 2.5 billion delta |
| Implied-vol rank | 10.84 percent |
| Skew rank | 86.85 percent |
| Put vs call day volume | 795,328 vs 505,343 |
| Input | |
|---|---|
| Treasury yields | sharply higher, long-end stress |
| Payrolls (Aug 7) | negative 23,000 vs 80,000 forecast |
| Retail sales (Aug 14) | down 0.6% vs plus 0.1% forecast |
| Core CPI (Aug 12) | 0.2% monthly, in line |
| Import prices (Tue) | negative 0.4% vs 0.1% expected |
| WTI crude | held near 84 dollars |
| Volatility index | 15.85, up 4% |
| When | Event |
|---|---|
| Wed Aug 19 | Fed minutes 14:00, 20-yr auction 13:00, vol expiration |
| Thu Aug 20 | platform and largest US retailer earnings |
| Fri Aug 21 | monthly options expiration |
| Aug 26 | dominant chipmaker earnings |
| Aug 27-29 | central-bank symposium |
The economic releases referenced above are published on the official government calendars below. Price levels are derived from standard technical and statistical methods, and the market read is AlgoIndex's own analysis. How we grade these calls is set out in our performance methodology.
- US Census Bureau, New Residential Construction (housing starts and building permits)
- US Bureau of Labor Statistics, Import and Export Price Indexes
- Federal Reserve, Industrial Production and Capacity Utilization (G.17)
- Federal Reserve, FOMC calendar and meeting minutes
- US Department of the Treasury, auction schedule and results
- AlgoIndex performance methodology



