
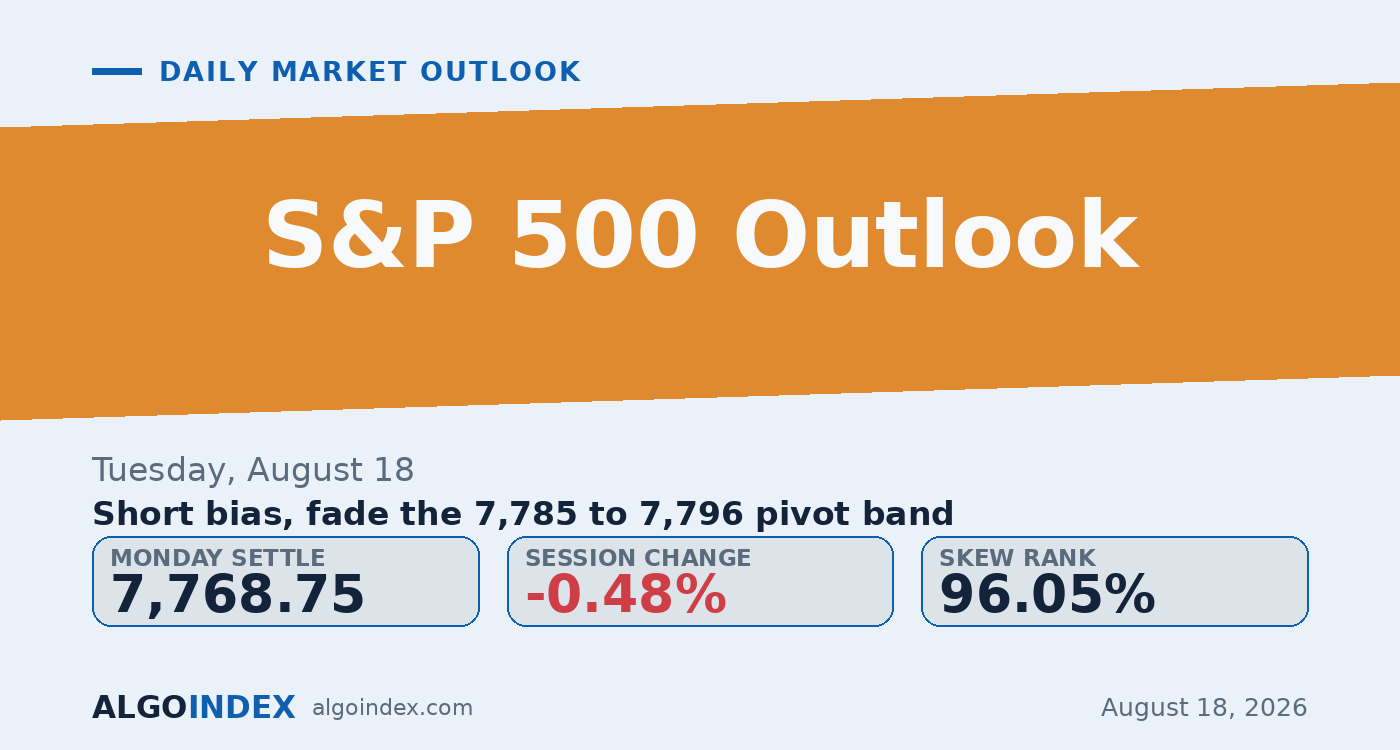
The escalation crossed before the open, and the index sold from there. A senior Iranian official was reported near 08:26 ET, roughly an hour ahead of the cash bell, to have moved the country's posture from defensive to offensive, and equities traded down into that headline for the rest of the session. The September E-mini settled at 7,768.75, lower by 0.48 percent, while the cash index gave back 0.52 percent to close at 7,745.06. Both stocks and bonds finished lower, and that combination is the fingerprint of an inflation scare rather than a growth one.
The shape of the day matters more than the size of it. Price reopened near 7,820, stalled at the 7,828 node, lost the 7,796 desk pivot that the positioning desk itself treats as its line between constructive and defensive, and accepted into a 7,762 low before a soft settle. It closed beneath both that pivot and the 7,786 volatility inflection, the first time in this advance the short-term structure has actually broken. What didn't break is the trend. Price still sits above every average except the five-day, and the dealer gamma flip is 66 points below the market. Monday cracked the pivot, not the uptrend.
Trend intact, pivot broken
There are three separate readings here and only one of them turned. The trend is the first, and it's still constructive: price holds above every moving average but the five-day, the multi-indicator composite reads a near-full buy, and directional strength accelerates hard as the window shortens, from a flat 6 on the hundred-day to a decisive 33 on the nine-day. The second reading is dealer positioning, which remains dampening, with call gamma of 2.72 billion against put gamma near zero and the flip level far beneath the market. Those two together are the reason Friday's soft data and Monday's headline produced a decline measured in fractions of a percent rather than whole ones.
The third reading is the one that changed, and it's the loudest. The nine-day stochastic collapsed to 38.95 while the fourteen through hundred-day held above 86, the composite slipped from a full buy to 96 percent, and Monday's hedging flow ran to negative 9 billion of delta as longer-dated call unwinding forced dealers to sell futures. The five-day average at 7,782.85 now sits above price and caps the first bounce. Underneath all of it, the macro refuses to help: payrolls printed negative a week ago, retail sales contracted Friday, and yet the ten-year yield rose into the weak data and one-year inflation expectations ticked higher. Soft numbers aren't buying a policy cushion, and that removes a support equities have leaned on all year.
A market that sold its own protection
The tell is in the volatility. Implied-volatility rank sits at 5.94 percent, the bottom six percent of the past year, while skew rank sits at 96.05 percent. The zero-day straddle implied a 29 basis point move on Monday and the index delivered 59, roughly double what was paid for. Cheap volatility, expensive downside protection, and a market not paying enough for the movement it is actually producing. Traders noticed and bought roughly 146,000 volatility calls for the trouble. That leaves the near-term market structurally underhedged, right into a Wednesday that opens with a volatility expiration and then stacks a twenty-year auction and the meeting minutes inside one afternoon.
Fade the pivot, don't chase the break
The plan doesn't chase the decline. It sells strength back into the 7,785 to 7,796 band, the exact area that stacks the computed pivot, the volatility inflection, the five-day average and the desk pivot within a few points, and only while price holds beneath it. The stop sits at 7,812, above the two standard deviation resistance and the moving-average stall, which is about 22 points of risk from the middle of the entry. Targets run to the 7,762 shelf, then the 7,746 pivot support, then the 7,724 three-way grouping. Two consecutive fifteen-minute closes above 7,807 void it, and a credible de-escalation headline or Brent back beneath 88 dollars removes the driver regardless of level. performance methodology sets out how we grade these calls afterward.
Payrolls were negative, sentiment had collapsed, and yields still rose, because the story is inflation, not growth. Monday layered a geopolitical bid on top of that, and the index lost the one level its own positioning desk calls the line.
A market can be in a strengthening uptrend and still be worth fading for a single session. The edge here is location, the 7,796 line, not a call on direction.
This is the read our members get every session, before the bell, with the levels drawn and the setup defined. See how the same dealer-positioning work turns into systematic signals.
View pricingThe complete data picture
Every number behind Tuesday’s plan, charted first; the full numeric reference follows underneath.
Full numeric reference, every remaining figure from the review
| Average | Value | Settle vs |
|---|---|---|
| 5-day | 7,782.85 | price below by 17.85 |
| 20-day | 7,629.19 | above by 135.81 |
| 50-day | 7,562.21 | above by 202.79 |
| 100-day | 7,394.01 | above by 370.99 |
| 200-day | 7,182.73 | above by 582.27 |
| Year-to-date | 7,239.61 | above by 525.39 |
| Level | Reference |
|---|---|
| 7,796 | options desk pivot, bearish below |
| 7,821 | heaviest options strike, 99.86% |
| 7,838.50 | contract high, Aug 13 |
| 7,785.90 | volatility inflection level |
| 7,762.50 | session low, acceptance shelf |
| 7,746.67 | first pivot support |
| 7,725.95 | two-SD support, three-way near 7,720 |
| 7,702.90 | dealer gamma flip level |
| 7,520.90 | downside structural support base |
| Metric | Reading |
|---|---|
| Call gamma | 2.72 billion |
| Put gamma | negative 214.69 million |
| Call-to-put ratio | roughly 12.7 to 1 |
| Gamma notional | positive 1.113 billion dollars |
| Monday hedging flow | negative 9 billion of delta |
| Implied-vol rank | 5.94 percent |
| Skew rank | 96.05 percent |
| Put vs call day volume | 809,039 vs 531,763, 1.52 to 1 |
| Cohort | Weekly change |
|---|---|
| Commercials | net short about 142,000; shorts +36,963 |
| Dealers | net short about 780,000; shorts +42,794 |
| Asset managers | net long about 948,000; trimmed both sides |
| Leveraged funds | cut shorts by 49,848 to 486,190 |
| September open interest | 2,020,644 |
| Input | |
|---|---|
| 10-year yield | 4.720%, up 3 bp |
| Dollar index | 99.580, down 0.06% |
| Payrolls (Aug 7) | negative 23,000 vs 80,000 forecast |
| Retail sales (Aug 14) | down 0.6% vs 0.1% forecast |
| Core CPI (Aug 12) | 0.2% monthly, in line |
| Brent crude | cleared 90 dollars, three-week high |
| When | Event |
|---|---|
| Tue Aug 18 | Import prices 08:30, data-light session |
| Wed Aug 19 | Vol expiration, 20-yr auction 13:00, Fed minutes 14:00 |
| Thu | Jobless claims, regional manufacturing |
| Fri | Flash purchasing-managers surveys |
| Aug 26 | Dominant chipmaker earnings |
| Aug 27-29 | Central-bank symposium |
The economic releases referenced above are published on the official government calendars below. Price levels are derived from standard technical and statistical methods, and the market read is AlgoIndex's own analysis. How we grade these calls is set out in our performance methodology.
- US Census Bureau, New Residential Construction (housing starts and building permits)
- US Bureau of Labor Statistics, Import and Export Price Indexes
- Federal Reserve, Industrial Production and Capacity Utilization (G.17)
- Federal Reserve, FOMC calendar and meeting minutes
- US Department of the Treasury, auction schedule and results
- AlgoIndex performance methodology



