
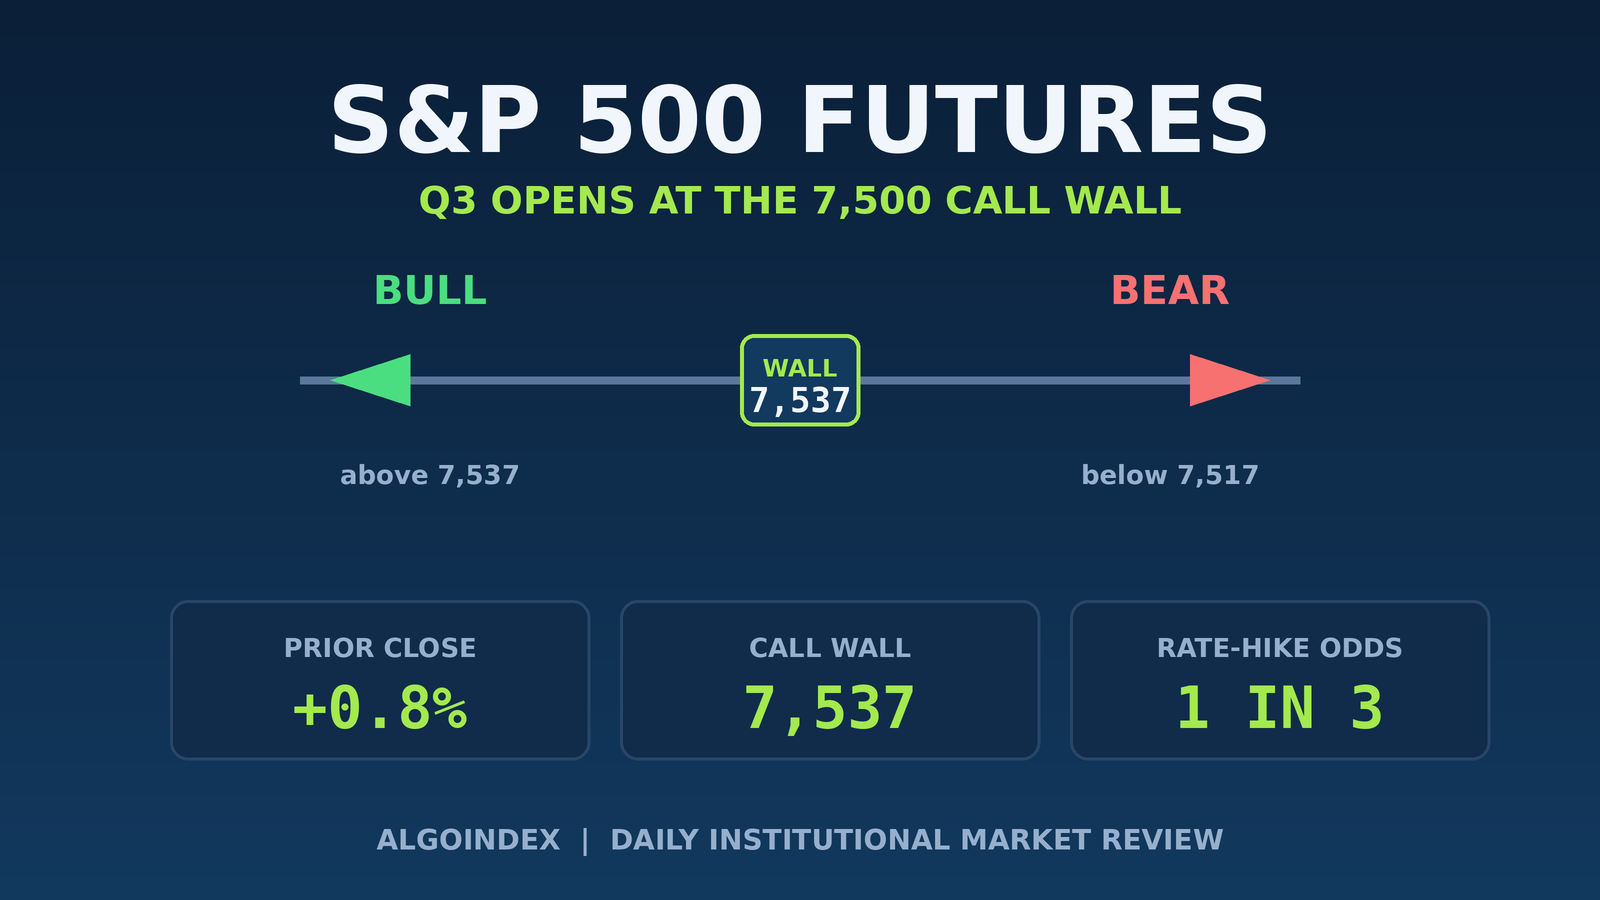
The best quarter for American stocks in six years ended one point short of a wall. The S&P 500 cash index closed the final session of the second quarter at 7,499.35, up eight tenths of a percent, its technology and semiconductor leaders doing the heavy lifting, and stopped almost exactly beneath 7,500, the price where dealers are sitting on roughly twenty thousand call contracts. On the first morning of the third quarter the E-mini has drifted a touch lower, quoted near 7,536 against a prior settle of 7,548.25, and the question that defines the day is simple: can the market climb over its own ceiling.
That ceiling is not a chart line. It is a position. Dealers who are long a large block of calls at the 7,500 cash strike have to sell futures as price rises toward it to stay hedged, which is exactly what turns a strike into resistance. Reclaim it and hold, and a supportive strip of positive gamma running up to 7,600 cash tends to cushion pullbacks and let the market grind; reject it, and the same machinery that pins price can let it slide. The E-mini equivalent of that wall sits near 7,537, a whisker above the current print, so the entire session hinges on a level the market is already leaning against.
A supportive market sitting on a nervous one
Two forces are pulling in opposite directions. The near-term picture is friendly. Price sits above every major moving average, the daily uptrend is intact, and the desk read expects a benign ten o'clock manufacturing survey to let the market capture 7,500 cash and press 7,520, with a further reach into 7,550 to 7,600 reserved for a quiet payrolls print tomorrow. Real-time hedging flow into the prior close leaned persistently toward call demand, and a holiday-shortened week tends to crush volatility, both tailwinds for a slow drift higher once the wall is reclaimed.
The medium-term picture is where the caution lives. The news wire is fixated on hawkish central-bank messaging, with traders now assigning roughly a one-in-three chance of another US rate increase this month and nine of eighteen committee participants penciling one in for 2026. The Dollar Index near 101.37 is trading at the upper end of its three-month range, and the ten-year yield has firmed toward 4.45 to 4.48 percent. Firmer rates and a stronger dollar are a headwind for multiples already stretched near records. More telling, the one-month implied correlation reading has slid back to about five, a depressed level the desk treats as an early warning of volatile downside spasms, and it has begun adding small downside hedges into what it sees as an over-extended bullish crowd.
The structure, level by level
Above the 7,537 wall, the first stop is the overnight and prior-session high at 7,550 to 7,551, then 7,557, the futures equivalent of the 7,520 cash resistance the desk names as today's upside target. The computed pivots stack from 7,583 to 7,587 (cash 7,550) through 7,615, 7,618, and on to 7,637 (cash 7,600), the top of the positive-gamma strip, before the 52-week high at 7,693.75 roughly two percent overhead. Underneath, the daily pivot at 7,532.58 anchors a 7,526 to 7,533 shelf, and the real base sits at 7,510 to 7,517, where the overnight low, the 40-day average near 7,517.52, and the 20-day near 7,504 converge. Lose that base and the first pivot support at 7,497 gives way to 7,485 and the one-standard-deviation support at 7,482, with the broader bull-versus-bear line down at 7,417 (cash 7,380).
Momentum confirms a trend that is intact but no longer thrusting. The fourteen-day relative strength reads 53.61, the nine-day 54.46, none of them stretched, while the fourteen-day directional index at 21.6 shows the negative directional line marginally above the positive one, a hint the very-near-term push has lost thrust. Volatility is compressed on every measure, with the average true range near 102 points and at-the-money implied volatility around 13 percent for today, an expected cash move of roughly eighty-one basis points, about sixty E-mini points. It is a contained, range-friendly session unless a catalyst forces expansion.
The complete data picture
Every level and reading from the desk review, for traders who want the full map rather than the summary.
Level map (ES futures, cash equivalent in parentheses)
| Zone | Level (ES) | What it is |
|---|---|---|
| Resistance | 7,693.75 | 52-week high, about 2% overhead |
| Resistance | 7,669 / 7,642 | 3rd pivot resistance / 2 s.d. |
| Resistance | 7,637 (7,600) | Cash 7,600, top of gamma strip |
| Resistance | 7,618 / 7,615 | 2nd pivot resistance / 1 s.d. |
| Resistance | 7,583 to 7,587 (7,550) | First computed resistance (T2) |
| Resistance | 7,557 (7,520) | Desk upside target (T1) |
| Resistance | 7,550 to 7,551 | Overnight / prior-session high |
| Pivot / wall | 7,537 to 7,540 (7,500) | Call wall, about 20,000 dealer calls |
| Support | 7,526 to 7,533 | Daily pivot 7,532.58, ON shelf |
| Support | 7,510 to 7,517 | ON low, 40-day 7,517.52, 20-day 7,504 |
| Support | 7,497 (7,461) | First pivot support |
| Support | 7,485 / 7,482 | 18-day average / 1 s.d. |
| Support | 7,454 / 7,446 | 2 s.d. / 2nd pivot support |
| Support | 7,436 / 7,417 / 7,411 | Cash 7,400 / bull-bear line / 3rd pivot |
By the numbers
Moving averages: 5-day 7,482 · 20-day 7,504 · 50-day 7,463 · 100-day 7,168 · 200-day 7,071 · YTD 7,146 (price above all). Oscillators: RSI 14-day 53.61, 9-day 54.46, 50-day 55.64; stochastic %K about 66 / %D about 54; directional index 21.6 (negative line 20.6 over positive 17.4); multi-indicator opinion 48% buy. Cross-asset: Dollar Index 101.37 (+0.2%), 10-year yield 4.45 to 4.48%, VIX 16.5 to 16.7, vol-of-vol 86.9, gold about 4,040, WTI about 68.9.
The three paths (desk probabilities)
Path A, capture and grind (about 45%): a benign 10:00 survey lets the E-mini reclaim and hold 7,537, then grind to 7,557 and, on momentum, 7,583 to 7,587, aided by the gamma strip.
Path B, rejection and rotate (about 30%): price probes 7,540 to 7,557, is rejected, and rotates back to the 7,517 to 7,533 pivot, closing near the wall.
Path C, breakdown (about 25%): a firm survey or hawkish forum remark breaks 7,510 to 7,517, targeting 7,497 then 7,485 to 7,482, the correlation-spasm scenario the desk is hedging.
Expected range today: low band 7,485 to 7,510, most-likely mid 7,527 to 7,557, high band 7,583 to 7,637.
Today's calendar (ET)
- 07:00 · Mortgage applications, 30-year contract rate eased to 6.57% from 6.59% (released)
- 10:00 · Manufacturing survey, the first-order intraday catalyst (inside RTH)
- During the session · Central-bank chair remarks at the European policy forum
- Thursday · June payrolls report, the marquee week event
- Friday · Market closed for the July 4th observance
The setup is honest about its own tension. The higher-probability intraday edge is a continuation long, taken only on a reclaim of 7,537 that holds as support after the opening range forms, targeting 7,557, then 7,583 to 7,587, with a stop below 7,524 and invalidation on a fifteen-minute close back under 7,517. The alternate is the mirror image and the desk's own hedge: a failed push into 7,540 to 7,557 that then loses 7,517 opens a fade toward 7,497 and 7,485. A firm survey or a hawkish forum remark that lifts the dollar and yields tips the balance to the second story.
A record quarter has left the S&P 500 exactly where the options market drew its line. Above 7,537 the path of least resistance is a quiet, dealer-supported grind into the holiday; below 7,517 the correlation warning starts to speak. The market spent three months climbing to this wall. Today it finds out whether it can climb over it.
Trade the levels, not the noise.
AlgoIndex marks the dealer walls before each session and scores whether they hold. See the running numbers in the gamma level accuracy tracker, then view pricing.
Foundational guides: Call walls and put walls, gamma exposure (GEX), dealer gamma positioning, and ES contract specs.



