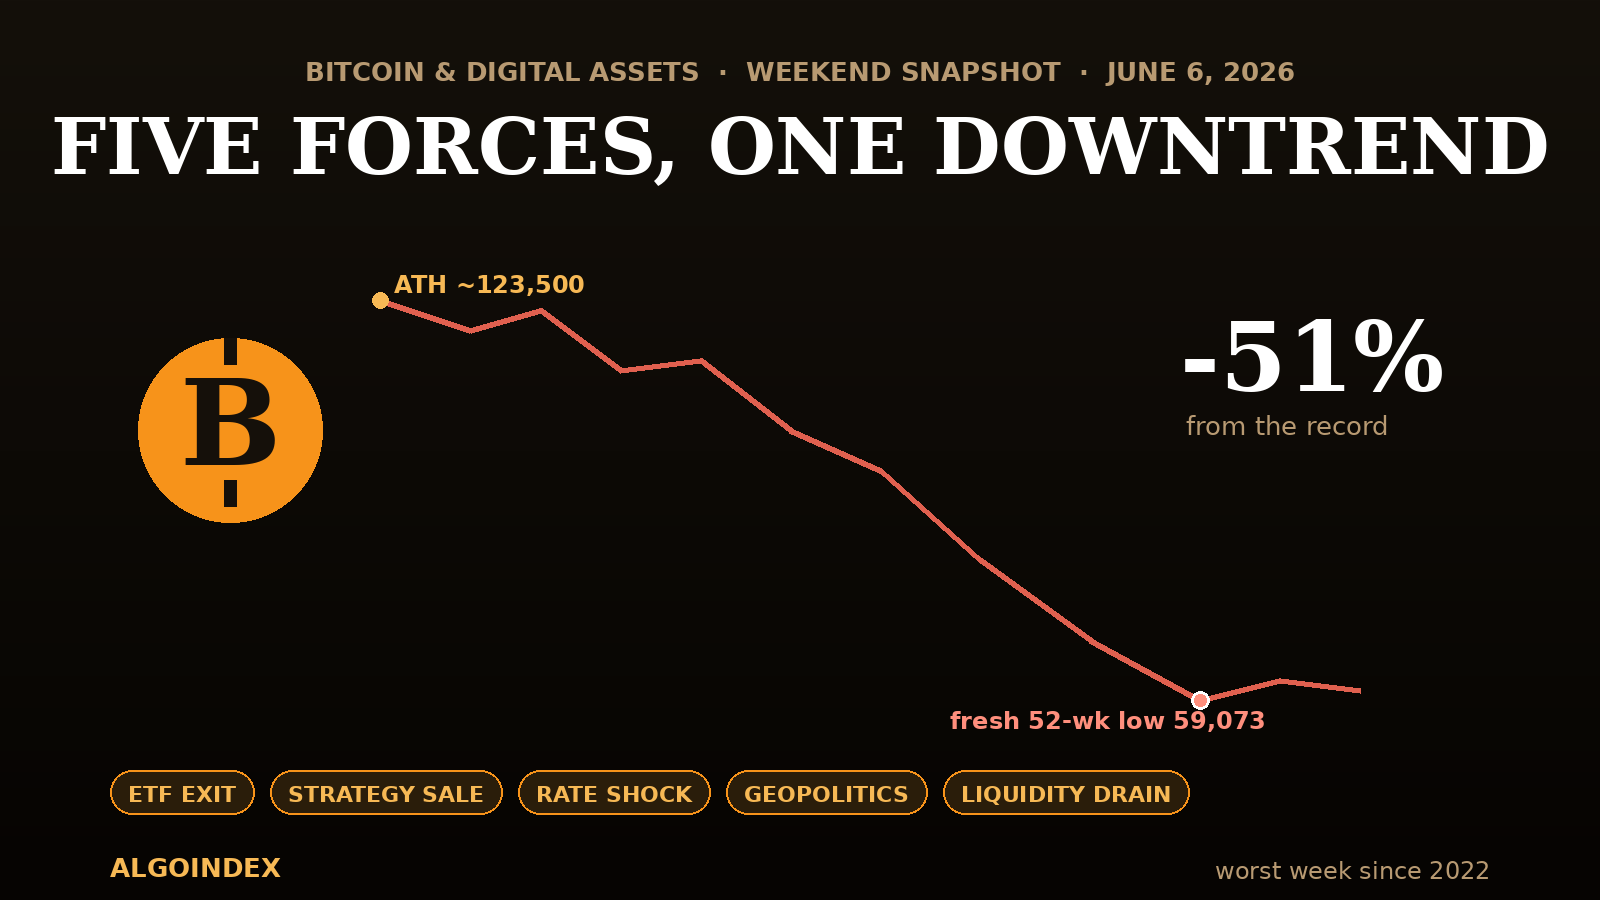
Bitcoin spent the 2024 to 2025 cycle being repriced as an institutional asset. Over the past two weeks it has been repriced again, in the other direction. Trading near 60,750 on Saturday, the original digital asset sits roughly 51 percent below its October 2025 record near 123,500, having just printed its worst week since the 2022 bear market. This is no longer a pullback inside an uptrend. On the weekly and daily charts the structure has objectively flipped: a clean sequence of lower highs and lower lows, every meaningful support shelf from the 2025 advance broken, and a fresh 52-week low on the board. What makes the move worth dissecting is not its depth but its mechanism. Five separate forces converged at once, and the same hot payrolls print that hit equities on Friday was the spark that lit all of them together.
Five Forces, One Downtrend
A 51 percent decline rarely has one cause, and this one has five. They are independent in origin but reinforcing in effect, which is why the move has been so orderly and so relentless rather than a single panic spike. Understanding the decline means understanding the convergence.
The dominant force is the disappearance of the institutional bid. Spot Bitcoin exchange-traded funds have bled net outflows on the order of 40,000 coins, roughly 2.8 to 3.5 billion dollars, across ten-plus consecutive sessions since May 20, the worst sustained outflow streak since the products launched. That same institutional cohort drove the entire 2024 to 2025 advance, and it is now in sustained retreat. The second force is a sentiment break: Strategy, the corporate treasury formerly known as MicroStrategy, made its first-ever Bitcoin sale, just 32 coins to support dividend obligations, but the size is beside the point. The corporate-treasury model that added a reflexive, leveraged bid through 2025 depended on the market believing those holders would never sell. That belief is now broken.
The third force is the macro rates shock detailed below, the same hot payrolls print that crushed equities Friday. The fourth is geopolitical risk-off from the unresolved Iran and Strait of Hormuz situation. The fifth is structural: an equity initial-public-offering supercycle and the race to fund artificial-intelligence capital spending are pulling marginal risk capital out of digital assets. None of these alone would produce a 51 percent decline. Together, hitting a market already extended and leveraged, they produced exactly that.
The Waterfall: How the Structure Broke
The decline reads the same on every timeframe. The weekly chart printed a wide-range bearish bar down about 12,870 points, 17.5 percent, that closed near its low with no lower wick of consequence, the signature of trend continuation rather than capitulation. The daily chart shows the full waterfall: a topping shoulder near 84,000, a break of the prior-quarter low shelf near 74,156 that accelerated everything, and a near-vertical drop into the 60,000 to 61,000 zone, with price now below every major daily moving average. The four-hour chart is where the bounce thesis lives: the cascade from 74,000 broke its measured downside extensions at 67,090, 65,142, and 62,991, overshot to a low near 59,000, then reclaimed the deepest extension and stabilized around 60,000 to 61,000.
An independent computed-pivot model corroborates the chart almost exactly and adds precision. Spot last traded 60,834 against a daily pivot of 61,539, sitting just under it, a short-term bearish tell. Today's low of 59,073 printed a fresh 52-week low, matching the 13-week and one-month lows at the same price, which means Bitcoin is at its lowest level in a full year with no horizontal support from the past year's price memory beneath it. The model stacks upside resistance at 64,005, 66,372, and 68,838, aligning tightly with the four-hour extension band, while the standard-deviation envelope runs from 65,407 at plus-one to 55,110 at minus-three. The most striking read is the relative-strength grid: the 30 percent level corresponds to 64,342 and the 20 percent level to 61,400, so at spot near 60,800 the daily reading is already pressed below 20, deeply oversold. The 9-, 18-, and 40-day moving averages all sit far overhead in the 73,000 to 76,000 zone, and the multi-indicator composite reads 72 percent Sell and strengthening. The grid and the chart agree: oversold, on a fresh 52-week low, with 59,000 to 59,300 the line that decides whether this stabilizes or cascades.
The Bid That Vanished, and the Leverage That Flushed
The exchange-traded-fund flow record is the cleanest real-time read on institutional conviction, and right now it is the dominant variable. Until that series prints multiple consecutive days of net inflows, any price bounce should be read as mechanical short-covering rather than a return of the structural bid. The streak of outflows since May 20 is the institutional cohort that built the bull market unwinding it.
If the vanishing bid is the bearish half of the positioning story, the flushed leverage is the constructive half. The decline was amplified by forced deleveraging: roughly 1 billion dollars liquidated on the May 28 break of 73,000, then a 1.85 billion dollar single-day cascade into the low 60,000s, one of the largest of the year. That violence has a silver lining. Much of the speculative long leverage that built up near the highs has now been purged, funding rates have likely reset toward neutral or negative, and open interest has been cleaned out. A market that has already liquidated its weak longs is harder to push lower on the same news, which is the mechanical basis for the near-term bounce thesis.
The Strategy Overhang, and What Sentiment Is Saying
Strategy's 32-coin sale matters not for its volume but for what it signals about a 10-billion-dollar problem. The company's average cost basis is roughly 75,700 per coin, putting the position at an unrealized loss on the order of 10 billion dollars at current prices, with the broader corporate-treasury cohort showing tens of billions in mark-to-market losses. The important nuance: Strategy's debt covenants reportedly carry no automatic Bitcoin-sale trigger at current levels, so forced liquidation is not imminent. The risk is reflexive, the market front-running the possibility, and it becomes a genuinely dangerous, self-reinforcing question only in the 50,000 to 52,000 zone. Sentiment, meanwhile, sits at or near capitulation extremes, with the crypto fear-and-greed complex spending extended stretches in extreme fear. That is a contrarian positive on a multi-week horizon, but it is not a timing tool. The signal to respect is the combination of extreme fear plus a confirmed price higher-low plus stabilizing fund flows. Two of those three are not yet present.
Ether, Dominance, and the Macro Through-Line
Ether is the tell that this is a risk-off liquidity event, not a Bitcoin-specific story. It has underperformed throughout the decline, losing the 2,000 handle to trade near 1,880, and that relative weakness has dragged the broad altcoin complex down harder than Bitcoin. The Ether-to-Bitcoin ratio falling during a selloff is the hallmark of a flight to relative quality within crypto: capital that stays in the asset class rotates toward Bitcoin, while the higher-beta, longer-duration alternatives bear the brunt. Bitcoin dominance is rising, which signals fear and risk-aversion within the asset class, the opposite of an altcoin-season condition. There is no altcoin-season signal anywhere on the horizon while dominance is climbing.
The through-line connecting all of it is macro. Crypto did not sell off in isolation; it fell as part of a synchronized, multi-asset de-grossing. The proximate trigger is the same one that hit equities Friday: a hot US payrolls print, 172,000 jobs against an 88,000 consensus, that repriced December Fed-hike odds above 60 percent, lifted the 10-year Treasury yield to 4.53 percent and the 30-year above 5.02 percent, and pulled liquidity out of the longest-duration assets first. Bitcoin, as the highest-beta, longest-duration risk asset on the board, is mechanically the most sensitive to a real-yield shock. The live news feed made the linkage explicit, tying the digital-asset selloff directly to the same hawkish-Fed risk-off that hit stocks. The cross-asset signature is the diagnostic: equities, bonds, gold (down 3.7 percent Friday), crude, and crypto all fell together while the dollar firmed. When everything sells at once and nothing hedges, it is leverage leaving the system, not a discrete fear about any one asset.
A hawkish Fed with no rate relief until at least the June 16 to 17 meeting keeps the liquidity backdrop hostile. That makes Wednesday's May inflation report a first-order event for Bitcoin: a hot print extends the risk-off and pressures the 59,000 support, while a soft print is the single most likely catalyst for a sharp relief rally. And because crypto trades 24/7, it will be the first asset to price any weekend Iran or Hormuz headline, making it a leading indicator for Monday's equity open.
Three Paths Through the Next Three Weeks
The market sits at a high-stakes inflection: deeply oversold and on major support, inside a confirmed downtrend. The resolution is two-sided and gated on flows plus the inflation print. Here is how the next one to three weeks most likely break down.
The weight of evidence favors the volatile basing process over an immediate continuation, but the structure is bearish and the burden of proof is on the bulls. Three things flip the thesis constructive together: two-plus consecutive days of net-positive fund inflows, a confirmed daily higher-low above 59,000 followed by a reclaim of 67,000, and a reclaim of the broken 74,000 prior-quarter low on a daily close. Until that confluence resolves, the single most important confirmation is the flow record, the single most important risk level is 59,000 on a daily-close basis, and the single most important external catalyst is Wednesday's inflation report. Below 59,000 opens 56,000 to 57,000; below 52,000 the picture turns structurally serious. This remains a two-sided, headline-driven range to be traded from the edges, not a trend to be chased in either direction.
This analysis is for educational purposes and reflects a fast-moving weekend market as of roughly 11:40 AM ET on Saturday, June 6, 2026. It is not investment advice. Digital assets are highly volatile and can move 10 percent or more in a single session; conduct independent research before acting.