The number that was supposed to be soft came in hot, and the market that was priced for cuts had to reprice for a hike in the span of a single eight-thirty release. By the closing bell on Friday, June 5, the S&P 500 had posted its worst session since April 2025: SPX settled at 7,383.74, down 200.57 points or 2.64 percent, while the E-mini contract closed near 7,368.25, off 232.75 points or 3.06 percent from Thursday's futures settle and still ticking lower toward 7,361 after the cash close. The Nasdaq Composite fell 4.18 percent and the Nasdaq-100 future dropped 5.4 percent, the worst single tech session in more than a year, erasing roughly one trillion dollars of market value. This was not a slow bleed. It was a controlled demolition in three acts, and the wiring ran straight from the labor report through the rate market into the most crowded equities on the board.
The trigger was the May payrolls print: 172,000 jobs against an 88,000 consensus, with upward revisions to prior months, an unemployment rate steady at 4.3 percent, and no soft-labor story left to tell. December rate-hike odds jumped from 48 percent to above 60 percent, the entire Treasury curve lurched higher, and a market already wounded by a funding question hanging over artificial-intelligence capital spending simply gave way. What follows is the full anatomy of the session and the map into Monday, June 8. The pre-market scenario map that framed the morning is in One Number, Three Paths.
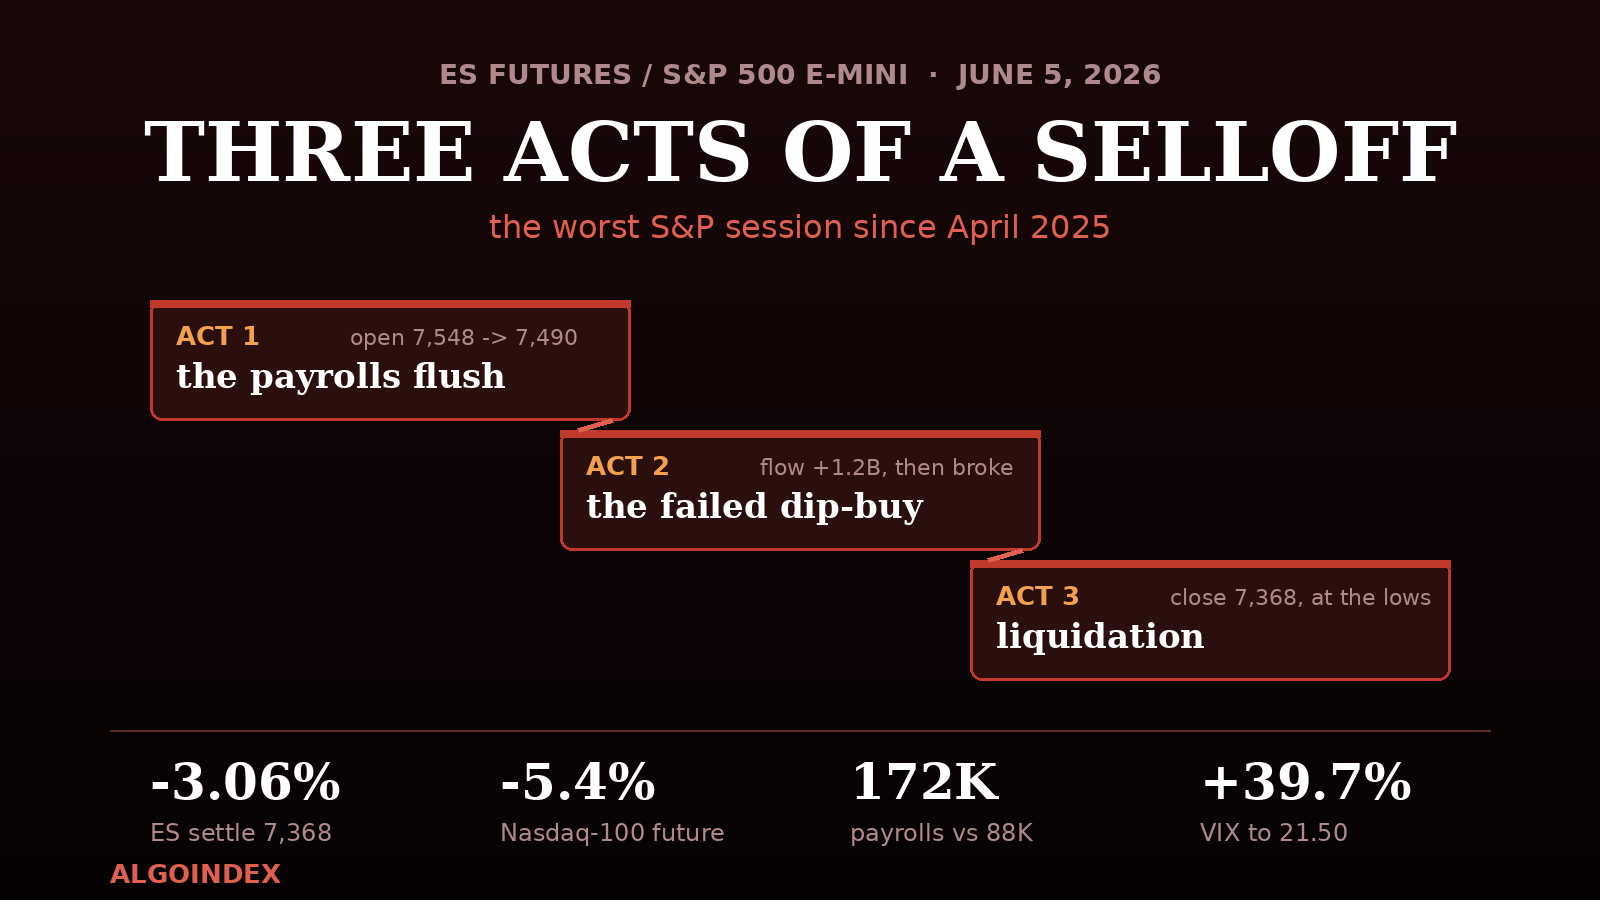
Act One, Two, Three: How the Session Came Apart
The session divided cleanly into three phases, and the cleanest way to read the day is through the cumulative real-time options flow, which swung from a small short bias at the open to a strong dip-buying impulse mid-morning and then collapsed into a record liquidation by the close. That round trip, from minus 180 million to positive 1.2 billion and finally to minus 2.1 billion, is a 3.3 billion dollar reversal that quantifies the capitulation better than any single price level.
Act one, from 9:30 to roughly 10:05, was the release flush. The payrolls number gapped futures about 50 points lower into the open at 7,547.75, and the contract waterfall-sold toward 7,490 with NYSE advance-decline pinned near minus 1,400 and not a single meaningful bounce. Act two, from 10:00 to 11:00, was the trap: institutions sold puts and bought calls into the SPX 7,495 support shelf, real-time flow swung positive by 1.2 billion dollars, and price stabilized for roughly forty minutes. Then the shelf gave way. Act three, from 11:00 into the close, was pure liquidation. Once SPX lost 7,490, dealer hedging amplified every leg lower, the afternoon ground through 7,477 and 7,440 without a single significant up-candle, the New York afternoon printed a low of 7,369.75, and the market closed at the bottom of its range with the heaviest thirty-minute volume of the day in the final hour. Expanding volume into the low reads as distribution, not exhaustion.
The Rate Shock That Lit the Fuse
The payrolls print did not just beat; it rewired the policy path. With 172,000 jobs against an 88,000 consensus, prior-month revisions up to 179,000, and unemployment holding at 4.3 percent, the soft-labor narrative died in one release. Fed funds futures moved December hike odds from 48 percent into the low 60s and pulled a full hike into January pricing, with one major desk economist summarizing the message as no argument for cuts with the labor market this strong. The two-year yield jumped to 4.115 percent, the ten-year to 4.534 percent, and the thirty-year above 5.02 percent. The dollar firmed 0.67 percent to 100.10. Most consequentially, the Federal Reserve entered its pre-meeting communications blackout after Friday, so there is no official walk-back available before the June 16 to 17 meeting, which now arrives with a live hike debate and fresh projections.
The Funding Question Under the Selloff
The rate shock did not land on neutral ground. It landed on a market that had spent the week reconsidering how the artificial-intelligence buildout gets paid for. A chain of single-name events converted a growth story into a dilution story, and it did so with hard dollar figures. Broadcom declined to raise its AI-chip outlook Wednesday night. Micron suffered a record single-day market-value loss of 94 billion dollars on Thursday. Alphabet had raised 85 billion dollars in equity the prior week. And on Friday came a report that Meta is exploring a capital raise of its own, sending the shares down 7 percent. Against 2026 capital-spending budgets that exceed 700 billion dollars, the market abruptly began pricing the cost of funding that spending at a 4.5 percent rate, with equity dilution as the mechanism.
Nothing Hedged Anything: The De-Grossing Signature
The single most important diagnostic of the day was not in equities at all. It was the cross-asset picture. Treasuries sold off, the source of the shock. Gold fell 3.68 percent to 4,339 despite live geopolitical risk, a casualty of rising real yields. Crude lost 2.93 percent to 90.31. Bitcoin made multi-month lows in the mid-60,000s (mapped in detail in Bitcoin's break to a fresh 52-week low). And the dollar rallied. When stocks, bonds, gold, and crypto all fall together while the dollar is the only thing bid, nothing is hedging anything, and that is the fingerprint of leveraged multi-asset de-grossing: funds selling what they own rather than what they fear. Such unwinds rarely complete in a single session.
Breadth confirmed the same story from the opening rotation. Advance-decline readings sat near minus 1,400 within the first half hour and stayed negative all session, with declining volume overwhelming advancing volume at the heaviest ratio since the April swoon. The Dow's comparatively mild 1.35 percent decline against the Nasdaq's 4.18 percent collapse left a roughly 285 basis point single-day spread between the two averages, among the widest growth-versus-value gaps in two years, as money rotated toward duration-insensitive value and away from the highest-multiple growth. Positioning made it worse: the latest futures-commitment data showed crowded equity-index length after nine consecutive advances through midweek, and the roughly 350 million dollars of deep-in-the-money call accumulation that printed Thursday was underwater within twenty-four hours.
The Air Pocket Below the Flip Level
Structurally, the close did real damage. The weekly candle is a large bearish engulfing bar posted directly off last week's all-time high at 7,632. Price knifed through the prior-week low, through all three measured-extension targets on the four-hour chart, and most importantly closed roughly 127 ES points below the dealer gamma flip level at ES 7,495 (SPX 7,483). That places the market deep in negative-gamma territory, where market makers sell weakness and buy strength, amplifying realized volatility in both directions. The largest put-support strike now sits overhead at ES 7,542 (SPX 7,530) rather than below price, an inversion that historically accompanies trending declines. Below the flip level, the level map thins dramatically: there is no major moving-average support until the fifty-day near SPX 7,158, roughly ES 7,170, leaving a low-positioning vacuum between current price and the deep support strike near ES 7,012.
Where the Averages Stand After the Break
SPX closed at 7,383.74 below both its five-day moving average at 7,547.53 (164 points below) and its twenty-day at 7,479.82 (96 points below) for the first time since the April advance began, while the fifty-day at 7,158.19 sits 226 points lower, the hundred-day at 6,991.75 sits 392 points lower, and the two-hundred-day at 6,859.23 sits 525 points lower. The short-term averages have flipped to overhead resistance while intermediate trend support sits far below. The four-hour sequence broke character entirely: the higher-high ladder that carried the contract from 7,300 to 7,632 resolved into a lower high at 7,600 on Thursday, and Friday's cascade took out the 1.272 extension at 7,474.50, the 1.618 at 7,437.35, and the 2.0 at 7,396 in one session, closing 28 points below the deepest target. Closing beyond a 2.0 extension in a single session is an extreme-velocity event that historically produces a reflex bounce within one to three sessions, even as it confirms the swing structure has flipped and rallies into 7,474 to 7,537 are now retests of broken support.
The oscillator picture is the tension into Monday. The nine-day raw stochastic collapsed to 7.19 percent and the fourteen-day to 19.57 percent, both deeply oversold, yet the nine-day relative-strength reading printed 39.74 and the fourteen-day 49.22, only mid-range, a reflection of how elevated the market was entering the week. The fourteen-day trend-strength index at 29.60 confirms a genuine trend, and the thirteen-indicator daily composite that read a full Buy as recently as Wednesday will roll hard on Monday's recalculation; treat the prior reading as stale. Thirty-day historic volatility at 12.24 percent against thirty-day implied at 16.08 percent shows options now pricing a materially faster market than the recent realized environment, with the volatility index implied one-day move for Monday at roughly 1.35 percent, about 100 ES points, framing a Monday envelope of roughly 7,270 to 7,470 around Friday's settle.
The Geopolitical and Macro Overhang
Beneath the rate story sits a persistent inflation overhang. The Strait of Hormuz remains effectively shut, keeping crude in the low 90s despite Friday's pullback, and the session carried headlines of Iranian warning-shot claims against US warships (denied by Central Command), a wobbling Lebanon ceasefire that Hezbollah has rejected, and quarterly international reports flagging unresolved access to Iran's nuclear program. Late Friday the administration described the Iran situation as going quite well, the kind of headline that can gap futures either way on a Sunday night. Separately, a new aluminum, steel, and copper tariff schedule takes effect June 8, a fresh goods-inflation impulse landing two days before the May inflation report. Suspected Japanese currency intervention added a layer of carry-trade instability under the surface. None of it offers an obvious off-ramp before the data.
The Map Into Monday, June 8
Futures reopen Sunday at 6:00 PM ET carrying weekend headline risk: Iran and Hormuz developments, the June 8 tariff effective date, and follow-through from an Asia session that closed Friday before the worst of the US afternoon. The expected Globex range is 7,320 to 7,420, with an early probe of 7,340 to 7,360 that holds reading as constructive and the tail risk skewed lower on any Hormuz escalation. Through the London session, 3:00 to 8:00 AM ET, European desks mark their books to Friday's US close and the dollar is the tell: a continued bid above 100.30 keeps risk heavy, while any softening in yields gives the contract room to base.
There is no first-order US data Monday, only the New York Fed consumer inflation expectations survey at 11:00 AM ET and a three-year note auction at 1:00 PM ET, the first duration test since the payrolls repricing, which historically favors a technical session after a Friday crash. The opening hour decides the week's tone: a flush into 7,330 to 7,360 that gets absorbed sets up a reflex bounce toward 7,400 to 7,440, while an open above 7,400 that holds its first pullback runs directly at the 7,470 to 7,495 supply test. Into the afternoon, with the Fed in blackout and the inflation report looming Wednesday, hedging flows around the refreshed put strikes and same-day positioning dominate, and in negative gamma the 2:00 to 3:30 PM window amplifies whatever direction the morning established.
The Setup: Sell the Reflex Into the Broken Shelf
The first bounce after a high-velocity break through the dealer gamma flip level is statistically a selling opportunity. The 7,470 to 7,495 band stacks the broken 1.272 extension, Friday's late-morning bounce shelf, and the flip level itself, and the Fed blackout removes the most likely upside catalyst before Wednesday's inflation print. That makes the reflex into that shelf the higher-probability structure into Monday.
Everything now funnels into the data: the May inflation report on Wednesday, June 10 at 8:30 AM ET, landing on a market more than 60 percent priced for a December hike, followed by producer prices and jobless claims Thursday and consumer sentiment with inflation expectations Friday, all feeding the June 16 to 17 Fed meeting and its updated projections. After a three-times-average-range day that closed below the second measured extension, the base case is a reflex attempt that the broken structure sells. The deeper question, whether Friday was a one-day repricing or the first session of a larger unwind, gets answered by how the bounce behaves at the shelf. Update: by Monday the reflex bounce had arrived, climbing right back into the 7,490 pivot, in The Bounce Meets the Wall It Broke.
This analysis is for educational purposes and reflects market conditions as of the close on Friday, June 5, 2026. It is not investment advice. Markets carry risk; conduct independent research before acting.
Foundational guides
New to S&P 500 futures? Start with What Are ES Futures, the ES, NQ, MES & MNQ point value and contract specs, gamma exposure (GEX) explained, and market internals: TICK, ADD, VOLD and VIX.