
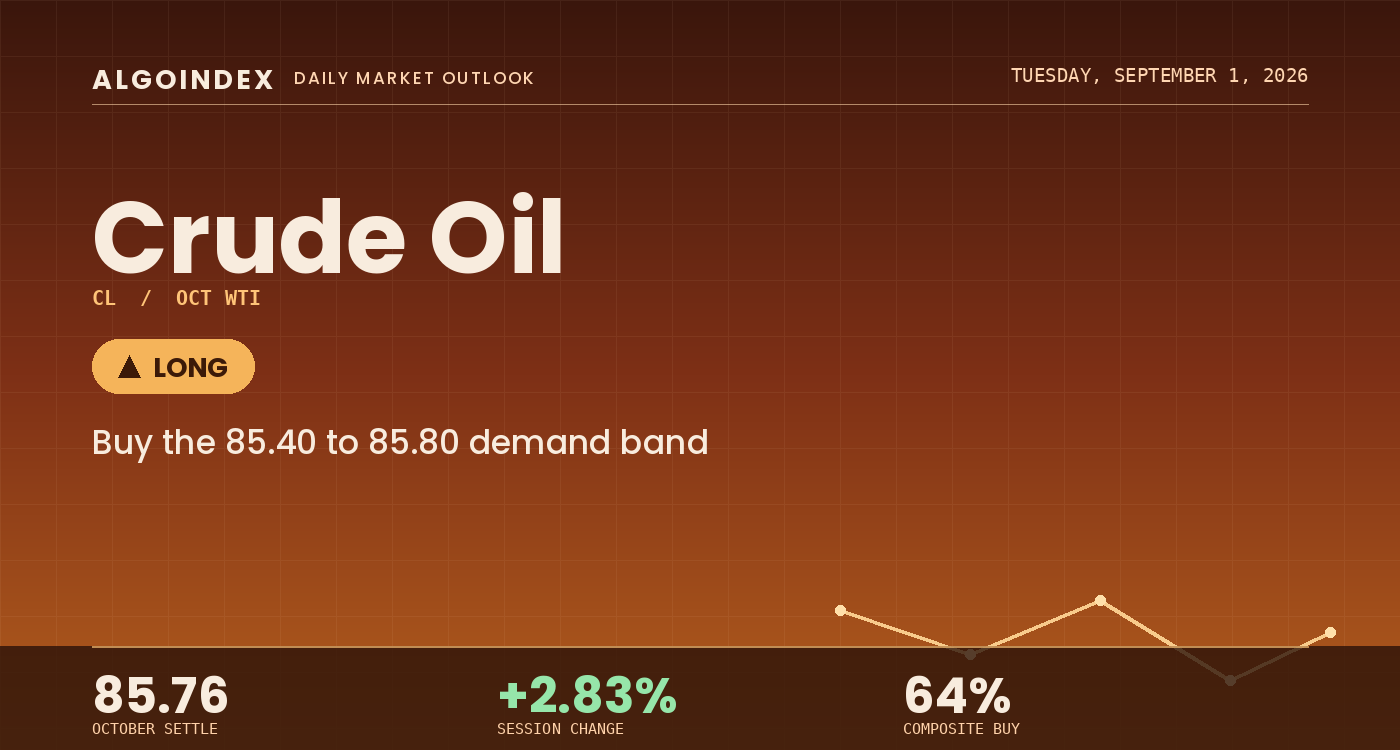
Crude repriced a Strait of Hormuz escalation and settled the October contract at 85.76 on Monday, higher by 2.36 or 2.83 percent, the strongest single session in more than a week and the highest settlement in seven. The contract reopened Sunday evening at 84.69 against Friday's 83.40 settlement, a 1.29 gap that priced the weekend escalation before any intraday trade, set the 84.11 low early and never revisited it, then advanced to an 86.79 high before fading 1.03 into the settlement to close at 61.6 percent of the day's range. The 2.68 range covered 1.02 times the 2.63 dollar fourteen-day average daily range and 0.89 times the 3.02 dollar average true range. Buyers led decisively but declined to hold the extreme into the close, the signature of a market unwilling to carry a directional bet into an unresolved conflict overnight.
The afternoon turned two-sided after the settlement was struck. Central Command was reported striking Iranian rocket launchers being readied to mine the Strait of Hormuz, met by Iranian missile and drone retaliation against US air bases in Jordan and the United Arab Emirates, the first military exchange between the two countries in a month. Then, between 3:45 PM and 3:57 PM ET, reported presidential remarks characterised any strikes as limited and described the waterway as functioning well, with roughly thirty vessels a night transiting under naval escort. Those comments landed after the 2:30 PM ET settlement, so they sit outside Monday's official price, yet the post-settlement electronic market kept bidding, trading 86.13 to 86.49 in the September 1 session and quoting near 86.40, some 0.64 above the close. The cross-asset read confirms the character of the move. The dollar index closed unchanged at 99.42 and gold added only 0.32 percent to 4,495.90 while crude rose 2.83 percent, so the market priced an energy-supply-specific event rather than a broad flight to safety.
A supply repricing above every average into a capped shelf
The constructive read starts with location. The 85.76 settlement, and the 86.40 electronic reference above it, sit above every major moving average, the five-day at 84.26, the twenty-day at 82.46, the fifty-day at 78.47, the one-hundred-day at 80.36 and the two-hundred-day at 72.21, with the year-to-date average at 75.05. Measured from the electronic reference the contract is extended 4.78 percent above the twenty-day average, a stretched position for a market whose average daily range is 3.05 percent of spot. The multi-indicator composite reads 64 percent buy, split 80 percent short-term, 50 percent medium-term and 33 percent long-term, and an active physical supply disruption underpins the bid. Products rose alongside crude rather than lagging, the global benchmark grade settling 90.49 for a 4.73 dollar light-sweet discount, which points to a physical constraint being priced rather than a purely speculative crude leg.
What argues the other way is the ceiling the advance has run into. Price has carried into a dense supply shelf between 87.00 and 88.23 that has capped four separate attempts since late July, and the trend measures say the move is young. The fourteen-day directional index reads 16.09, beneath the 20 line that separates trending from range conditions, with the positive component at 26.66 against the negative at 19.37; the nine-day index at 20.10 has only just crossed that threshold. Inside the average stack the fifty-day at 78.47 remains beneath the one-hundred-day at 80.36 by 1.89, a crossing that has not resolved upward and the reason the long-term composite component reads only 33 percent buy. The longer stochastic lookbacks are stretched, the twenty-day raw at 90.88 percent and the fifty-day at 91.84 percent, so the contract trades near the top of its recent distribution with limited room before it must consolidate or accelerate. Realised volatility has compressed to 28.97 percent on the fourteen-day window against 43.73 percent on the fifty-day, the configuration that precedes either a range settlement or an outsized single-session expansion when a headline arrives.
The 85.55 pivot band is the Tuesday decision
Two structures frame Tuesday. Beneath price, the 85.40 to 85.80 band pairs the 85.55 pivot point with Monday's 85.76 settlement, a 21-cent overlap that should act as a single decision zone, with the 85.30 short-term crossover stall marking its lower edge; beneath that, the 84.11 to 84.32 confluence stacks Monday's untested session low with first pivot support, the most important defensive band on the chart. Overhead, 86.79 is the paired equal high on the 30-minute chart and the most mechanically likely near-term probe, then the 87.00 to 87.04 convergence of first pivot resistance and the computed target, four cents apart, is the first genuine ceiling and where the session is decided. No petroleum inventory print falls on Tuesday, so the session is governed by geopolitical headlines first and the 10:00 AM ET US manufacturing block second, with positioning ahead of Wednesday's government report building through the afternoon. Crude has no liquid options proxy, so positioning is read from the physical and futures complex, where the commitments snapshot is dated August 25 and predates the entire escalation.
Buy the pullback band, respect 84.75, size for the gap
The plan buys the 85.40 to 85.80 band, where the 85.55 pivot point and Monday's 85.76 settlement overlap and the 85.30 crossover shelf marks the lower edge, favouring a pullback entry over a chase into the 87.00 ceiling. The stop is 84.75, roughly 0.85 dollars from the 85.60 entry midpoint, set beneath the 85.18 momentum reference and the 85.00 round number while holding above the 84.52 moving-average cross, a momentum stop rather than a structural one since it sits above Monday's 84.11 low. Targets step up to 86.79, Monday's session high and the equal-high magnet, then 87.69, the August high whose failure defined the prior week's decline, then 88.23, second pivot resistance paired with the two-standard-deviation band, only if momentum extends through the August high on volume, for reward-to-risk of roughly 1 to 1.4, 1 to 2.5 and 1 to 3.1. Two developments override the level map. A verified normalisation of Strait of Hormuz commercial traffic, a confirmed cessation of hostilities or a producer-group supply-addition announcement each invalidates the long in real time regardless of price and carries gap risk a stop cannot manage; in the opposite direction, a strike on production or export infrastructure would carry price through all three targets in a single move. Given both tails, the setup should be worked at one half to two thirds of an equivalent index position, and any position carried into the Wednesday inventory release reduced beforehand. A loss of 84.52 signals the fade into Monday's settlement was the start of a reversal rather than a pause. The desk's published performance methodology sets out how these calls are graded.
The physical complex is pricing the duration of a Strait of Hormuz disruption, not the intensity of a single exchange of fire, and the settlement barely gave back the advance while the dollar and gold sat still. That points to an energy-supply-specific bid rather than a flight to safety, so buying the 85.40 to 85.80 pullback band beneath the 87.00 ceiling, sized for the overnight gap, is the trade, and a verified reopening of the waterway is the one development that flips it.
A supply repricing that holds above every average but stalls into a shelf that has capped four attempts since late July is a market to buy on a pullback rather than a print to chase. The plan favours the 85.40 to 85.80 band, respects 84.75 and keeps size light, because the conflict can escalate or resolve on a single headline in either direction.
This is the read our members get every session, before the bell, with the levels drawn and the setup defined. See how the same dealer-positioning work turns into systematic signals.
View pricingThe complete data picture
Every number behind Tuesday’s plan, charted first; the full numeric reference follows underneath.
Full numeric reference, every remaining figure from the review
| Average | Value | Settle vs |
|---|---|---|
| 5-day | 84.26 | above by 1.50 |
| 20-day | 82.46 | above by 3.30 |
| 50-day | 78.47 | above by 7.29 |
| 100-day | 80.36 | above by 5.40 |
| 200-day | 72.21 | above by 13.55 |
| Year-to-date | 75.05 | above by 10.71 |
| Level | Reference |
|---|---|
| 89.68 to 91.27 | third pivot resistance and the fifty-two-week high, out of single-session reach |
| 88.07 to 88.23 | the thirteen-week high, the two-standard-deviation band and second pivot resistance, the upper boundary of a statistically normal session |
| 87.50 to 87.69 | the one-standard-deviation band and the August high, the shelf whose reclaim converts the converging structure to a breakout |
| 87.00 to 87.04 | first pivot resistance and the computed target within four cents, the first genuine ceiling and the session decision point |
| 86.79 | Monday session high, the paired equal-high magnet and target one |
| 86.49 | September 1 electronic session high, the first mechanical objective |
| 85.76 | October settle |
| 85.40 to 85.80 | the primary buy band where the pivot point and settlement overlap, the entry |
| 85.18 to 85.30 | the short-term crossover stall and the 70 percent stochastic reference, the lower edge of the immediate support base |
| 84.75 | protective stop, a momentum stop beneath the confluence |
| 84.11 to 84.52 | the nine-day cross, first pivot support and Monday untested low, the most important defensive band on the chart |
| 83.10 to 84.02 | the one and two standard-deviation bands and the eighteen-day cross, a full give-back of Monday |
| 82.75 to 82.87 | the three-standard-deviation band and second pivot support |
| 81.64 to 81.98 | third pivot support and the 50 percent relative-strength reference |
| 80.40 to 80.56 | the four-week 50 percent retracement and the forty-day cross, the deepest structural support relevant to the week |
| 73.10 | one-month low, set August 5, out of single-session reach |
| Metric | Reading |
|---|---|
| Options surface | no liquid crude options proxy; positioning is read from the physical and futures complex rather than an equity-fund surface, and no level in this review is derived from an options surface |
| Waterborne differential | the global benchmark grade settled 90.49, up 2.39 or 2.71 percent, leaving a 4.73 dollar light-sweet discount to the 85.76 domestic settlement |
| Product settles | September gasoline settled 3.4820 a gallon and October gasoline added 0.0268 or 0.88 percent, the complex closing higher across the board |
| Natural gas | the October contract settled 2.9350 per million British thermal units, up 0.047 or 1.63 percent, on forecasts of triple-digit temperatures in the coming week |
| Diesel | session commentary described diesel in the 5.45 to 5.65 a gallon range, an extraordinary level pointing to distillate tightness |
| Refinery utilisation and cracks | not captured this session and therefore not reported; products rose alongside crude rather than lagging, indicating a physical supply constraint rather than a purely speculative crude bid |
| Historic volatility | 28.97 percent over 14 days against 43.73 percent over 50 days, realised movement compressing relative to the summer |
| Biofuel waivers | small-refinery exemptions totalling 1.76 billion credits for the 2025 compliance year were granted at 2:59 PM ET, the highest since 2017, supportive of refining margins and a modest positive for refined-product supply |
| Forward curve | front-to-back spread not captured this session, so the contango or backwardation state is recorded as unverified |
| Overnight gap warning | the 0.39 dollar gap between the 3.02 average true range and the 2.63 average daily range is accounted for by overnight movement, a direct warning about carrying positions through the electronic session |
| Cohort | Weekly change |
|---|---|
| Managed money | net long 84,020, longs up 1,344 against shorts up 4,803, the fast money adding to the short side 3.6 times faster than the long side in the week before the escalation, those shorts now underwater |
| Commercial hedgers | net short 156,246, longs 892,144 down 2,677 against shorts 1,048,390 up 482, producers selling forward into strength |
| Non-commercial | net long 123,449, longs 323,243 up 3,084 against shorts 199,794 up 1,725 |
| Producers | 654,534 long up 586 against 349,280 short up 10,849, the largest single change in the report, a real supply of selling into rallies |
| Swap dealers | 111,284 long up 3,832 against 572,784 short down 3,272 |
| Coverage note | the snapshot is dated August 25, six days before Monday and predating the entire escalation, so a fast repricing has left it describing a market that no longer exists |
| Input | |
|---|---|
| Dollar index | 99.42, up 0.01 percent, effectively unchanged, so Monday was not a broad flight to safety |
| 10-year yield | 4.757 percent reference, with the session direction reading inconsistently across the captured panels so no directional claim is made |
| Gold | 4,495.90, up 0.32 percent, a muted move while crude rose 2.83 percent, the signature of an energy-supply-specific event rather than systemic fear |
| Equity index | the broad index down 0.33 percent to 7,686.14 and the large-cap tracking fund down 0.30 percent, a modest orderly markdown |
| Equity volatility | 14.93, up 3.54 percent, bid at the margin but at a low absolute level |
| Global benchmark grade | 90.49, up 2.39 or 2.71 percent, leaving the light-sweet discount at 4.73 |
| Inflation channel | commentary linked the oil move to inflationary pressure and the risk that the central bank raises rates in response, the chair having framed inflation as the problem and rate increases as the tool at the August symposium |
| When | Event |
|---|---|
| Tue Sep 1 | the global manufacturing survey round through Asia and Europe, euro-area flash inflation at 5:00 AM ET forecast 3.3 percent against 2.9 percent, and the 10:00 AM ET US manufacturing block, with no petroleum inventory scheduled so headlines lead and the manufacturing block is second |
| Wed Sep 2 | private payrolls at 8:15 AM ET, the Canadian rate decision at 9:45 AM ET and the weekly government crude inventory report at 10:30 AM ET against a prior build of 0.095 million barrels, the first-order petroleum event of the week |
| Thu Sep 3 | the trade balance and jobless claims at 8:30 AM ET alongside a central bank governor, the services survey and its prices-paid component at 10:00 AM ET, and a further policymaker at 3:00 PM ET |
| Fri Sep 4 | the monthly employment report, where commentary expects a gain of roughly 65,000 following a decline of 23,000 in July, the back-loaded end of a dense week |
| Positioning note | the commitments report remains dated August 25 and stale relative to the escalation; the customary industry-body inventory preview arrives after Tuesday pit close, its timing customary rather than confirmed |
The economic releases referenced above are published on the official government calendars below. Price levels are derived from standard technical and statistical methods, and the market read is AlgoIndex's own analysis. How we grade these calls is set out in our performance methodology.
- US Bureau of Economic Analysis, Personal Income and Outlays (PCE)
- US Bureau of Economic Analysis, Gross Domestic Product
- US Bureau of Economic Analysis, release schedule
- US Census Bureau, Advance Durable Goods (M3) release schedule
- US Energy Information Administration, Weekly Petroleum Status Report
- US Department of the Treasury, auction schedule and results
- AlgoIndex performance methodology



