
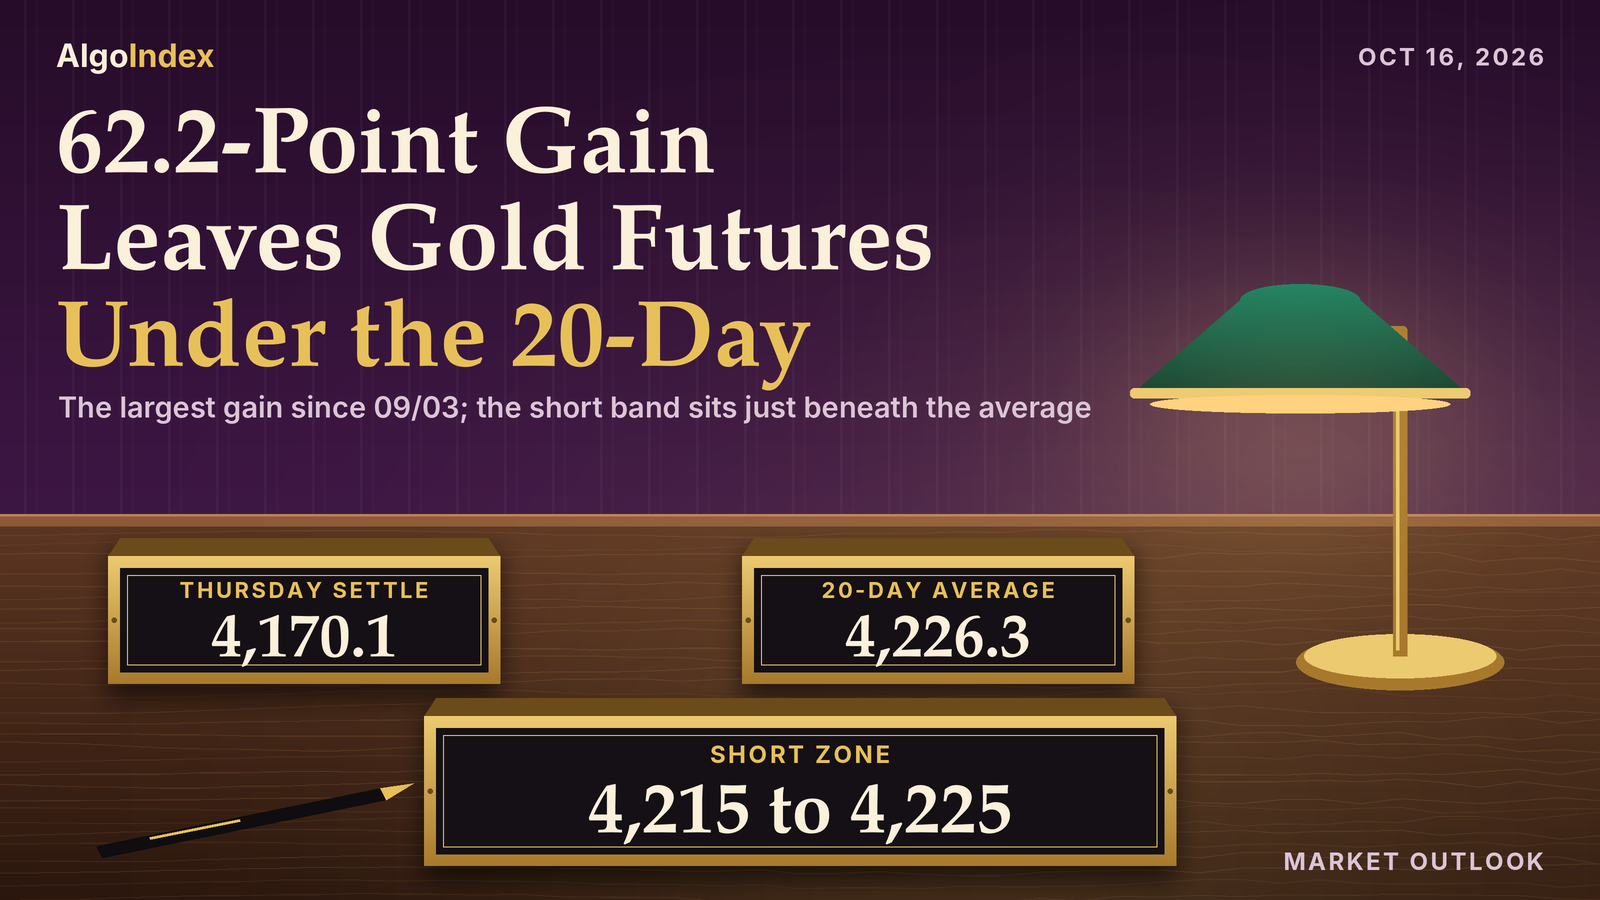
At 8:00 PM ET on Wednesday evening, two hours into the Thursday session, December gold ran from 4,133.2 to 4,164.6 in one 30-minute bar. That bar went straight through 4,145 to 4,155, the short band we set for the session, and closed at 4,159.6. No 30-minute bar closed beneath 4,155 again. The contract settled at 4,170.1, up 62.2 points or 1.51 percent from Wednesday's 4,107.9, and ended a run of three lower settles. It was the largest gain since the 125.3 point gain of 09/03.
Producer prices printed at 8:30 AM ET, as the calendar lists them, and the news feed showed 1.3 percent for September against a 0.6 percent forecast. Gold dipped, then recovered. The 8:30 AM ET bar traded down to 4,151.6 and closed at 4,173.2. The dollar index fell 0.55 to 102.00, and the ten-year yield index closed at 5.09 percent against 5.19 percent. Friday's primary setup is a short from 4,215 to 4,225, beneath the 20-day settlement average at 4,226.3, with the 38.2 percent retracement from the four-week low at 4,224.4 inside the band.
December gold settled at 4,170.1, 7.2 points above the 4,162.9 Pivot Point and 34.8 beneath Pivot R1 at 4,204.9. It sits 3.0 above the 9-day average and 2.3 beneath the 5-day, and 56.2 under the 20-day at 4,226.3. The longer averages sit higher. The primary setup is a short from 4,215 to 4,225, with the 38.2 percent retracement at 4,224.4 inside the band and the 20-day average 1.3 above its top, stop 4,242 above Pivot R2 at 4,239.7, targets 4,198, 4,176 and an extended 4,154. The band sits above the market. The settle is 44.9 points beneath its bottom, and the Friday session was quoted at 4,189.2 at 6:33 PM ET. Negative direction leads on both directional windows and the composite reads "64% SELL". Import prices print at 8:30 AM ET on Friday, as the calendar lists them, and gold settles at 1:30 PM ET.
Thursday's rally ran through the 4,145 to 4,155 short band and settled 0.8 points above its invalidation line
In Thursday’s outlook we set a short from 4,145 to 4,155, stop 4,172, with targets at 4,128, 4,106 and an extended 4,084. Its reopen status line put the contract at 4,126.5 at 6:24 PM ET, 18.5 points beneath the band. Thursday's bar, from the review and the dated 10/15 row of the provider's daily record, opened at 4,128.3 at the Wednesday 6:00 PM ET reopen, marked a high of 4,197.7 and a low of 4,120.9, and settled at 4,170.1. The band traded. The thesis did not survive the settle.
The 30-minute bars fix the order. The session low of 4,120.9 came first, in the 7:00 PM ET bar on Wednesday evening. The 8:00 PM ET bar then traded from 4,133.2 to 4,164.6, through the whole band, and closed at 4,159.6. The 8:30 PM ET bar closed at 4,160.6. The 9:00 PM ET bar reached 4,172.8. By the 10:30 PM ET bar the close was 4,181.0.
Every exit clause on the card came into play. Its acceptance test, two consecutive 30-minute closes above 4,155, was met by the 8:00 PM ET and 8:30 PM ET closes of 4,159.6 and 4,160.6. The 4,172 stop level printed in the very next bar, the 9:00 PM ET bar, and the session high later went 25.7 points through it. The card named a settle above Pivot R1 at 4,169.3 as its invalidation. The 4,170.1 settle cleared it by 0.8. No fill and no result is asserted.
The first target printed only before the band traded. The 4,128 level sat 0.3 beneath the 4,128.3 open, and the four bars from 6:00 PM ET to 7:30 PM ET traded beneath it, down to the 4,120.9 low. After the 8:00 PM ET bar no print came within 23.6 points of 4,128. The lowest was 4,151.6, in the 8:30 AM ET bar. The 4,106 second target and the extended 4,084 never traded; the low held 14.9 and 36.9 points above them.
The path call missed on the upside. Our Thursday outlook weighted a hold between two standard deviations support at 4,050.3 and two standard deviations resistance at 4,165.5, with producer prices and the dollar deciding the side. The low held 70.6 points above the bottom. The high broke 32.2 points through the top, and the settle finished 4.6 above it. The outlook also weighted a rally that fails beneath Pivot R1 at 4,169.3, after reaching the band, above a sustained recovery. The rally reached the band. It settled above R1.
Our range work broke at the top. The low-range case of 4,067 to 4,149 and the most likely case of 4,050 to 4,166 gave way at the high, by 48.7 and 31.7 points, and the settle finished 4.1 above the most likely top. The high-range case of 4,022 to 4,194 held through the 1:30 PM ET settlement. The best print before it was 4,189.9, in the 9:00 AM ET bar, 4.1 beneath the top. Then the post-settlement advance took the 4:00 PM ET bar to 4,197.7, 3.7 through the high-range case and 3.9 through the 4,022.0 to 4,193.8 average-true-range envelope. The deviation bands describe settlement dispersion. The settle cleared one and two deviations, at 4,148.7 and 4,165.5, by 21.4 and 4.6 points, and finished 8.4 beneath three deviations at 4,178.5.
The 30-minute bars score the session bands. All four missed at the top. Globex, 4,095 to 4,150, held the low: the 6:00 PM ET to 3:00 AM ET bars ran from 4,120.9 to 4,183.3, which put the high 33.3 points over. London's bars ran 4,157.0 to 4,182.0, wholly above its 4,085 to 4,155 band. The morning missed by 16.3. Its 9:30 AM ET to 12:00 PM ET bars traded 4,165.8 to 4,186.3 against a 4,050 to 4,170 band. The afternoon missed by 22.0. Its 12:00 PM ET to 4:00 PM ET bars traded 4,164.5 to 4,197.0 against 4,040 to 4,175.
The macro override named a soft producer-price print that reverses the dollar's gain, or a Saudi or Hormuz escalation that revives haven demand. The print was above forecast. The news feed showed producer prices up 1.3 percent for the month against a 0.6 percent forecast, and the dollar index still fell 0.55 to 102.00. Feed headlines at 9:19 AM ET described stronger haven demand, and at 10:04 AM ET the news feed carried a renewed Houthi warning on Saudi airspace, a statement carried by the news feed rather than an event confirmed for this review. We grade the card as written.
One row anchors the score. The dated 2026-10-15 row of the provider's daily record reads 4,128.3, 4,197.7, 4,120.9 and 4,170.1 on 155,223 contracts, with open interest not yet reported. The review states the same figures. Wednesday's 2026-10-14 row was revised. It now carries 191,279 contracts, against the preliminary 186,260 our Thursday outlook carried, and open interest of 321,688, up 1,169 from Tuesday's 320,519.
The 4,215 to 4,225 band, the 20-day average at 4,226.3 and Pivot R2 at 4,239.7
Resistance starts just overhead. The 5-day average at 4,172.4 sits 2.3 points above the settle. The 18-day crossing price at 4,196.5 and Thursday's 4,197.7 high form the first band, 26.4 and 27.6 points up, with Wednesday's 4,193.5 high just beneath them. The momentum projection level at 4,203.5, Pivot R1 at 4,204.9 and one standard deviation resistance at 4,210.3 follow.
Then the anchor band. Last Friday's 4,216.3 settle, from 10/09, sits inside the entry zone. The 38.2 percent retracement from the four-week low at 4,224.4 sits 0.6 beneath its top. The 20-day settlement average at 4,226.3 and two standard deviations resistance at 4,226.9 sit 1.3 and 1.9 above it. Three standard deviations resistance at 4,239.6 and Pivot R2 at 4,239.7 come next. The 4,242 stop clears them by 2.4 and 2.3. This week's 4,242.3 high, from 10/12, sits 0.3 above the stop. Beyond those sit the second momentum projection level at 4,248.4, the 50 percent retracement of the four-week range at 4,265.5 and Pivot R3 at 4,281.7. The rest is distant. The 38.2 percent retracement from the 13-week low at 4,300.2, the 38.2 percent retracement from the four-week high at 4,306.6, the 100-day at 4,314.9, the 40-day crossing at 4,357.5, the 50-day at 4,376.8, the 4,439.8 one-month high, the 200-day at 4,622.9 and the 4,755.0 13-week high sit farther out.
Support begins close. The 9-day crossing price at 4,168.4, the 9-day average at 4,167.1, the momentum stall level at 4,165.7 and the Pivot Point at 4,162.9 sit within 7.2 points of the settle. The published target price at 4,156.5 follows. Then a gap. One standard deviation support at 4,130.0, Thursday's 4,128.3 open, Pivot S1 at 4,128.1 and Thursday's 4,120.9 low sit 40.1 to 49.2 points down. Two standard deviations support at 4,113.3, Wednesday's 4,107.9 settle and three standard deviations support at 4,100.6 come next. Wednesday's 4,095.0 low, the week's low, the 4,091.2 one-month low and Pivot S2 at 4,086.1 are the extended references. Pivot S3 at 4,051.3 and the 13-week low of 4,019.0 close the list.
The averages split around the settle. It sits 3.0 points above the 9-day at 4,167.1 and 2.3 beneath the 5-day at 4,172.4. It is 56.2 beneath the 20-day at 4,226.3, 206.7 beneath the 50-day at 4,376.8, 144.8 beneath the 100-day at 4,314.9 and 452.8 beneath the 200-day at 4,622.9. The 5-day rose 2.6 from 4,169.8 as the 10/08 settle of 4,157.0 left the window and Thursday's 4,170.1 replaced it. The 20-day fell 11.5 from 4,237.8 as the 09/17 settle of 4,399.7 dropped out. The 50-day slipped 2.7 from 4,379.5. The older settlements explain the order. The 30 older ones in the 50-day window averaged 4,477.1, and the 50 older ones in the 100-day window 4,253.0. Friday's crossing prices are 4,168.4 for the 9-day, 4,196.5 for the 18-day and 4,357.5 for the 40-day.
Momentum sits in the lower half. Relative strength reads 43.58 on the 9-day, 42.19 on the 14-day and 42.90 on the 20-day. The 9-day raw stochastic reads 52.22 percent and the 14-day 35.13 percent. The 14-day %K at 24.87 percent sits beneath %D at 27.64 percent. Sellers still lead on direction. On the 9-day, negative direction at 22.66 leads positive at 12.16 with the ADX at 25.49; on the 14-day, 22.02 leads 13.07 with the ADX at 20.53. Historic volatility reads 16.29 percent on the 9-day and 20.15 percent on the 14-day. These readings come from the page dated for the Friday session, read after the 6:00 PM ET reopen, which can carry the live Globex price in place of the settle.
The composite snapshot reads "64% SELL", strength "Weak", direction "Average", composite indicator "SELL". The short-term group reads "Average: 80% SELL", the medium-term "Average: 75% SELL" and the long-term "Average: HOLD". History: "80% SELL" yesterday, "72% SELL" last week and "16% SELL" last month. The sell reading eased from the prior session. It remains a sell.
Thursday's range was ordinary. Its 76.8 points were 0.95 times the 14-day average daily range of 80.6. The bar printed a higher high and a higher low against Wednesday, by 4.2 and 25.9 points. The settle at 64.1 percent of the range left an upper shadow of 27.6 points above the settle and a lower shadow of 7.4 beneath the open.
The 14-day average true range stands at 86.1 points, 2.06 percent of the settle. The 9-day figures are 81.7 and 72.4 and the 20-day 90.2 and 78.2. One average true range either side of the settle spans 4,084.0 to 4,256.2. The deviation bands are tighter. Built from five settlements, they run 4,130.0 to 4,210.3, 4,113.3 to 4,226.9 and 4,100.6 to 4,239.6. Daily ranges over eight sessions ran 81.7, 106.6, 42.6, 77.6, 64.2, 55.1, 98.5 and 76.8 points. Last week, October 5 through October 9, spanned 4,091.2 to 4,233.7. This week through Thursday has spanned 4,095.0 to 4,242.3, and the settle sits 46.2 beneath last Friday's 4,216.3. Over five sessions the contract is up 13.1 points from the 4,157.0 settle of 10/08. The one-month high of 4,439.8 sits 269.7 above the settle and the one-month low 78.9 beneath it. No prior-quarter high or low was captured, so the 13-week extremes of 4,755.0 and 4,019.0 serve as the quarterly reference.
Hot producer prices, a softer dollar and lower long-end yields
Start with the data. Producer prices for September printed at 8:30 AM ET, as the calendar lists them. The news feed carried 1.3 percent for the month against a 0.6 percent forecast, and 6.3 percent for the year against 5.4 percent. The news feed carried core producer prices of 0.7 percent against 0.3 percent and annual core of 5.0 percent against 4.4 percent. Retail sales came next. Per the news feed, retail sales rose 0.8 percent against a 0.3 percent forecast and the core measure 0.9 percent against 0.5 percent. Initial jobless claims printed 199 thousand against 200 thousand, per the news feed.
The bars tell the rest. In the 30-minute bars the 8:30 AM ET bar opened at 4,176.0, traded down to 4,151.6 and closed at 4,173.2, so gold dipped on the release and recovered inside the same bar. The 9:00 AM ET bar reached 4,189.9 before closing at 4,177.5. The 1:00 PM ET bar, which spans the settlement window, traded between 4,166.1 and 4,173.3 and closed at 4,169.7.
Headlines followed, per the news feed. Feed headlines at 9:19 AM ET described hot inflation alongside a drop in yields and stronger haven demand. Feed headlines at 11:15 AM ET and 2:45 PM ET described gold gaining despite the hotter inflation data as Treasury yields slid. A feed headline at 12:00 PM ET said the hot producer-price data failed to revive rate-increase bets.
The dollar softened. The dollar index closed at 102.00 in the provider's daily record, down 0.55 from Wednesday's 102.55, after trading as low as 101.88. The ten-year yield index traded between 5.04 and 5.11 percent and closed at 5.09 percent against 5.19 percent on Wednesday, and the thirty-year closed at 5.42 percent against 5.52 percent. The 13-week bill index was unchanged at 4.08 percent, so the decline in yields was concentrated at longer maturities. No inflation-protected yield series was captured. Real yields are not measured here. In the review's interpretation, the combination of a softer dollar and lower nominal yields supported gold on a day when the producer-price data argued for tighter policy.
Policy talk came through the news feed. At 4:16 AM ET the feed carried investment-bank commentary expecting a third Federal Reserve increase in March 2027. A Federal Reserve bank president spoke at 4:30 PM ET, per the news-feed calendar and unconfirmed. At 4:46 PM ET and 4:48 PM ET the feed carried remarks from a regional Federal Reserve president about lower-income households struggling with inflation, and feed commentary at 5:15 PM ET said she urged more tightening. The next policy decision is listed for October 28, 2026, per the news-feed calendar and unconfirmed. The effective federal funds rate was carried at 3.88 percent for October 14.
Gulf and Red Sea headlines returned. At 10:04 AM ET the news feed carried a renewed Houthi warning that Saudi airspace and airports are unsafe. The news feed also carried witness reports of booms near the presidential palace in Aden. At 1:14 PM ET the news feed carried a US statement that a civilian vessel was hit by a projectile from Iran's revolutionary guard. That statement, per the news feed, also said a civilian container vessel sank while being towed to shore. At 4:43 PM ET and 4:44 PM ET the news feed carried Pentagon statements on a rebalancing of the NATO alliance. Per the news feed, they also covered a reduced troop presence in Europe and a shift of focus toward the Pacific. These are statements carried by the news feed rather than events confirmed for this review. No causal link to the gold price is asserted.
Silver outran gold. December silver settled at 57.156, up 1.279 or 2.29 percent, so the gold-to-silver ratio eased to 72.96 from 73.52. December copper settled at 6.5565, down 0.1040, a 1.56 percent decline computed from the stated settle and change. Energy rose. November WTI crude settled at 97.97, up 3.03 percent, after a larger-than-expected official crude draw, and Brent's December contract settled at 105.92. Stocks were mixed. The S&P 500 cash index closed at 7,744.06, up 0.33 percent, the Nasdaq-100 cash index at 29,935.59, down 0.05 percent, and the volatility index at 16.46.
Positioning data are thin tonight. No weekly positioning report was captured for this review, so no managed-money or commercial figure is asserted. Thursday's volume was 155,223 contracts against Wednesday's revised 191,279. Open interest reads 321,688 for Wednesday, up from 320,519 on Tuesday; Thursday's had not been reported. No central-bank purchase figure, Chinese reserve data or fund-holdings series was captured either. The news feed carried at 9:26 AM ET that a Chinese state trader bought further US soybean cargoes, a trade item that the review does not treat as a gold-demand measurement.
The fund console comes next. The gold fund's options console was read at about 9:06 PM ET, with a Date Updated stamp of 2026-10-15. It shows a previous-close field of 375.99, matching the fund's Wednesday close in the provider's record, and a current-price field of 380.90, a change of plus 1.31 percent. The console row shows call gamma of minus 204.39 million against put gamma of 130.52 million. Volume ran call-heavy. Call volume was 432.85 thousand against put volume of 87.65 thousand, about 4.9 calls for each put, and the put-to-call open-interest ratio reads 0.54. One-month implied volatility of 20.85 percent sits beneath one-month realised volatility of 21.35 percent, with an implied-volatility rank of 11.46 percent and a skew rank of 38.74 percent. The console's options implied move is 4.95, about 1.30 percent of the 380.90 price field.
The console reports volume and modeled gamma without trade side or customer positioning, so the call-heavy volume on a rising day is recorded as an observation only; no directional read and no level is drawn from it. The fund is a proxy used qualitatively. Its high and low volatility point fields are excluded as low-confidence, and no fund level is translated into a futures price.
The desk note, the 5:28 PM ET Thursday edition, does not discuss gold. In the review's judgment the primary edge for gold is the dollar, yield and policy complex.
The trade map for Friday
The primary setup is a short. Its band runs 4,215 to 4,225. The settle sits beneath the 20-day, 50-day, 100-day and 200-day settlement averages, and negative direction leads on both directional windows. The composite reads "64% SELL" with the composite indicator at "SELL". The 38.2 percent retracement from the four-week low at 4,224.4 sits inside the band, 0.6 beneath its top, and the 20-day average at 4,226.3 sits 1.3 above it. Risk sits above R2. The stop at 4,242 clears Pivot R2 at 4,239.7 and three standard deviations resistance at 4,239.6. Targets step down to 4,198, 0.3 above Thursday's 4,197.7 high, then 4,176, 5.9 above Thursday's settle, and an extended 4,154, 2.5 beneath the published target price at 4,156.5. The review flags the evidence against it. Thursday printed a higher high and a higher low with a 62.2 point gain, and the dollar and yields fell. So the review calls this an analyst judgment that the rebound stalls beneath the 20-day average, with no measured edge behind it.
Now the arithmetic. From the 4,220 midpoint the risk to the stop is 22 points, 25.6 percent of the 14-day average true range of 86.1. The targets sit 22, 44 and 66 points beneath the midpoint. Exact multiples. Thursday's settle sits 44.9 to 54.9 points beneath the band, and the 6:33 PM ET quote of 4,189.2 sits 25.8 beneath its bottom. For scale, Thursday's own high stopped 17.3 points beneath the new band and 44.3 beneath the stop. Its low sat 33.1 beneath the extended target.
The scenario ranges are analyst judgment. The low-range case runs 4,150 to 4,215, the most likely 4,130 to 4,227 and the high-range case 4,084 to 4,256. Session bands come next. Through Globex the review expects roughly 4,160 to 4,215 with a neutral bias, absent a headline shock. London follows at roughly 4,150 to 4,225, neutral to lower beneath the 20-day settlement average, with Pivot R1 at 4,204.9 the first meaningful resistance and the Pivot Point at 4,162.9 the first meaningful support. The morning band runs 4,130 to 4,227, with the 4,215 to 4,225 band the first test above and one standard deviation support at 4,130.0 the first test beneath. The afternoon band runs 4,113 to 4,240. The early prints fit. The 6:33 PM ET quote of 4,189.2 and the new session's displayed 4,189.0 to 4,193.9 range sit inside the Globex band.
The calendar runs overnight first. The Bank of England governor is listed at 10:00 PM ET and a European Central Bank board member at 10:30 PM ET, both per the news-feed calendar and unconfirmed. The Federal Reserve Chair's discussion with the International Monetary Fund's managing director is scheduled for 11:30 PM ET, as the calendar lists it. Friday starts early. On Friday the Bank of Canada governor is listed at 12:15 AM ET and final euro-area consumer prices at 5:00 AM ET, both per the news-feed calendar and unconfirmed. Then the main events. Import prices for September print at 8:30 AM ET and industrial production at 9:15 AM ET, both as the calendar lists them, before the cash equity open at 9:30 AM ET. Gold settles at 1:30 PM ET. A Friday settle carries two days of headline exposure into the Sunday reopen. Globex reopens at 6:00 PM ET on Sunday, October 18, 2026, with Pivot R1 at 4,204.9 above and Pivot S1 at 4,128.1 beneath as the weekend gap references. The next policy statement is listed for 2:00 PM ET on October 28, 2026, per the news-feed calendar and unconfirmed.
One path is weighted. In the review's analyst judgment the most probable path holds the contract between one standard deviation support at 4,130.0 and two standard deviations resistance at 4,226.9, with the dollar and long-end yields deciding the side. In the review's judgment the first-order scheduled input for gold on Friday is import prices at 8:30 AM ET, as the calendar lists them, read through the dollar and yields, alongside the Federal Reserve Chair's overnight discussion at 11:30 PM ET. A rally that stalls beneath the 20-day settlement average at 4,226.3 is weighted above a sustained break higher. No measured frequency backs it. The alternative is a further slide in the dollar or in long-end yields that carries the contract through Pivot R2 at 4,239.7, which would put the 50 percent retracement at 4,265.5 in play. Thursday's higher high, higher low and 62.2 point gain are the evidence against the short reading.
Thursday's rally ran through one short band and stopped 17.3 points beneath the next.
The complete data picture
Every number behind Friday’s plan, charted first, then the full level lists, then the complete numeric reference underneath.
Full numeric reference, every remaining figure from the session review
1. Executive Summary
The December gold contract settled at 4,170.1 on Thursday, up 62.2 or 1.51 percent from Wednesday's settle of 4,107.9, after trading between 4,197.7 and 4,120.9, a 76.8 point daily range. The settle finished at 64.1 percent of the range, and the 76.8 point range was 0.95 times the published 14-day average daily range of 80.6 points. Thursday printed a higher high and a higher low against Wednesday and ended a run of three consecutive lower settles. The 62.2 point gain was the largest since the 125.3 point gain of 09/03.
Producer prices for September printed at 8:30 AM ET, as the calendar lists them, with the news feed showing 1.3 percent for the month against a 0.6 percent forecast and 6.3 percent for the year against 5.4 percent, while retail sales rose 0.8 percent against 0.3 percent. In the 30-minute bars kept for the session the 8:30 AM ET bar opened at 4,176.0, traded down to 4,151.6 and closed at 4,173.2, so gold dipped on the release and recovered inside the same bar. Feed headlines at 11:15 AM ET and 2:45 PM ET described gold gaining despite the hotter inflation data as Treasury yields slid.
The dollar index closed at 102.00, down 0.55, and the ten-year yield index closed at 5.09 percent against 5.19 percent on Wednesday. Silver's December contract settled at 57.156, up 1.279 or 2.29 percent, so the gold to silver ratio eased to 72.96 from 73.52. The session high of 4,197.7 printed in the 4:00 PM ET bar, after the 1:30 PM ET settlement, so the high belongs to the post-settlement part of the Globex session.
The Friday session carries import prices at 8:30 AM ET and industrial production at 9:15 AM ET, both as the calendar lists them. The published 14-day average true range of 86.1 points is 2.06 percent of the settle. The gold fund's options console is used qualitatively only (section 5). The Primary Setup below is a short from the 4,215 to 4,225 band beneath the 20-day settlement average at 4,226.3, stopped at 4,242 above Pivot R2 at 4,239.7, with objectives at 4,198, 4,176 and an extended 4,154.
2. Price Action & Technical Structure
2.1 Intraday and Session Review
The Thursday session opened at 4,128.3 at the Wednesday 6:00 PM ET reopen, 20.4 above Wednesday's settle, marked a daily high of 4,197.7 and a daily low of 4,120.9, and settled at 4,170.1 at 1:30 PM ET. The 30-minute bars kept for the session place the session low of 4,120.9 in the 7:00 PM ET bar on Wednesday evening and the session high of 4,197.7 in the 4:00 PM ET bar on Thursday.
The 8:00 PM ET bar on Wednesday traded from 4,133.2 to a high of 4,164.6 and closed at 4,159.6, and the 10:30 PM ET bar closed at 4,181.0. The 8:30 AM ET bar, which contains the producer price and retail sales releases, traded between 4,151.6 and 4,180.8 and closed at 4,173.2, and the 9:00 AM ET bar reached 4,189.9 before closing at 4,177.5. The 1:00 PM ET bar, which spans the settlement window, traded between 4,166.1 and 4,173.3 and closed at 4,169.7.
After the settle, the 3:30 PM ET bar traded from 4,179.9 to 4,197.0 and closed at 4,195.9, and the 4:30 PM ET bar closed at 4,192.5; those post-settlement quotes are not used as the settlement anywhere in this review. Globex reopened at 6:00 PM ET, so the provider's displayed day open, high and low of 4,192.1, 4,193.9 and 4,189.0 belong to the new session dated Friday, not to Thursday, and are not used as Thursday's range.
The session extremes used here are the completed-session inputs behind the published pivot ladder rather than an independently read bar, back-solved from the outer pivot pairs and verified against every rung. Pivot R3 at 4,281.7 minus Pivot S3 at 4,051.3, divided by three, returns 76.8, and Pivot R2 at 4,239.7 minus Pivot S2 at 4,086.1, divided by two, returns the same 76.8. Three times the Pivot Point of 4,162.9 less the 4,170.1 settle gives a high plus low sum of 8,318.6, which the pair of 4,197.7 and 4,120.9 reproduces, and that pair reproduces all seven published rungs.
Independent corroboration: the provider's settlement row, the chart's completed Thursday daily bar and the extremes of the 30-minute bars kept for the session carry the same 4,197.7 high and 4,120.9 low. The settlement-row extremes are full Globex session extremes, from the 6:00 PM ET reopen to the 5:00 PM ET pause, so the high includes the post-settlement advance.
2.2 Daily Structure
Thursday printed a higher high and a higher low against Wednesday: the 4,197.7 high sits 4.2 above Wednesday's 4,193.5, and the 4,120.9 low sits 25.9 above Wednesday's 4,095.0. The settle at 64.1 percent of the range leaves an upper shadow of 27.6 above the settle and a lower shadow of 7.4 beneath the 4,128.3 open on the daily bar.
The sequence of session highs over the last six sessions reads 4,170.7, 4,233.7, 4,242.3, 4,224.8, 4,193.5 and 4,197.7, and the sequence of session lows reads 4,128.1, 4,156.1, 4,178.1, 4,169.7, 4,095.0 and 4,120.9. Settlements over the same six sessions ran 4,157.0, 4,216.3, 4,190.6, 4,177.3, 4,107.9 and 4,170.1.
Last week, October 5 through October 9, spanned 4,233.7 to 4,091.2, and this week through Thursday has spanned 4,242.3 to 4,095.0, with the contract 46.2 beneath last Friday's 4,216.3 settle. The one-month low of 4,091.2 sits 78.9 beneath the settle and the one-month high of 4,439.8 sits 269.7 above it. Over five sessions the contract rose 13.1 from the 4,157.0 settle of 10/08, matching the provider's five-day change of plus 13.1.
No prior-quarter high or low was captured for this review, so the 13-week extremes serve as the available quarterly reference: 4,755.0 above and 4,019.0 beneath.
2.3 4-Hour and Swing Structure
Daily ranges for the last eight sessions ran 81.7, 106.6, 42.6, 77.6, 64.2, 55.1, 98.5 and 76.8. The settlement changes over the same eight sessions read plus 30.3, minus 46.4, plus 16.3, plus 59.3, minus 25.7, minus 13.3, minus 69.4 and plus 62.2.
The retracement grid published for Friday places the 38.2 percent retracement from the four-week low at 4,224.4, 54.3 above the settle, and the 50 percent retracement of the four-week range at 4,265.5. Further above, the 38.2 percent retracement from the 13-week low sits at 4,300.2 and the 38.2 percent retracement from the four-week high at 4,306.6. No four-hour series was captured for this review, so swing structure here rests on daily bars and the 30-minute bars kept for the session.
2.4 Moving Averages
The averages cited in this subsection were computed for this review from the provider's daily settlement series for the December contract, which holds 259 completed sessions through Thursday. The 5-day average stands at 4,172.4, the 9-day at 4,167.1, the 20-day at 4,226.3, the 50-day at 4,376.8, the 100-day at 4,314.9 and the 200-day at 4,622.9.
The 4,170.1 settle sits 2.3 beneath the 5-day average and 3.0 above the 9-day, and sits 56.2 beneath the 20-day, 206.7 beneath the 50-day, 144.8 beneath the 100-day and 452.8 beneath the 200-day. The 5-day average rose 2.6 from Wednesday's 4,169.8, because the 10/08 settle of 4,157.0 left the window and was replaced by 4,170.1. The 20-day fell 11.5 from 4,237.8, because the 09/17 settle of 4,399.7 left that window, and the 50-day fell 2.7 from 4,379.5.
The 20-day average sits beneath the 50-day because the last 20 settlements averaged 4,226.3 against 4,376.8 for the full 50, which means the 30 older settlements in the 50-day window averaged higher, at 4,477.1. The 50-day sits above the 100-day because the 50 older settlements in the 100-day window averaged lower, at 4,253.0. The projection grid gives the prices at which each average would be crossed on Friday: 4,168.4 for the 9-day, 4,196.5 for the 18-day and 4,357.5 for the 40-day.
2.5 Oscillator and Trend Readings
The oscillator figures below are as published on the provider's technical page dated for the Friday session and read after the 6:00 PM ET reopen; the page can substitute the live Globex price for the settle, so these readings carry that caveat. The 9-day relative strength reads 43.58, the 14-day relative strength 42.19 and the 20-day relative strength 42.90.
The 9-day raw stochastic reads 52.22 percent and the 14-day raw stochastic 35.13 percent, while the 14-day stochastic %K reads 24.87 percent and the 14-day stochastic %D 27.64 percent, so %K sits beneath %D in the lower half of the range.
The 9-day directional index ADX reads 25.49 with the 9-day +DI at 12.16 and the 9-day -DI at 22.66; the 14-day directional index ADX reads 20.53 with the 14-day +DI at 13.07 and the 14-day -DI at 22.02, so negative direction leads on both. The 9-day historic volatility reads 16.29 percent and the 14-day historic volatility 20.15 percent.
The composite multi-indicator snapshot published for the Friday session, quoted verbatim, reads Overall Average "64% SELL", Current Strength "Weak" and Current Direction "Average", with the Composite Indicator at "SELL". The short-term group reads "Average: 80% SELL", the medium-term group "Average: 75% SELL" and the long-term group "Average: HOLD". The snapshot comparisons read Yesterday "80% SELL", Last Week "72% SELL" and Last Month "16% SELL", so the sell reading eased from the prior session while remaining a sell.
2.6 Volatility and Expected Range
The published 14-day average true range stands at 86.1 points and the 14-day average daily range at 80.6 points; the 9-day average true range is 81.7 with a 9-day average daily range of 72.4, and the 20-day average true range is 90.2 with a 20-day average daily range of 78.2. Thursday's 76.8 point range was 0.95 times the 14-day average daily range.
Adding and subtracting the 14-day average true range of 86.1 points from the 4,170.1 settle frames Friday between 4,084.0 and 4,256.2. The published standard-deviation bands are narrower because they are built from five settlements: one deviation spans 4,130.0 to 4,210.3, two spans 4,113.3 to 4,226.9 and three spans 4,100.6 to 4,239.6. These bands describe settlement dispersion, not intraday reach.
3. Key Levels
3.1 Resistance
Above the 4,170.1 settle, the 18-day average crossing price at 4,196.5 and Thursday's 4,197.7 high form the first band, followed by a momentum projection level at 4,203.5, Pivot R1 at 4,204.9 and one standard deviation resistance at 4,210.3. The 38.2 percent retracement from the four-week low at 4,224.4, the 20-day settlement average at 4,226.3 and two standard deviations resistance at 4,226.9 form the band that anchors the setup, with three standard deviations resistance at 4,239.6 and Pivot R2 at 4,239.7 above it. A second momentum projection level at 4,248.4 and the 50 percent retracement at 4,265.5 come next, with Pivot R3 at 4,281.7 beyond.
3.2 Support
Beneath the settle sits the 9-day average crossing price at 4,168.4, with a momentum stall level at 4,165.7 and the Pivot Point at 4,162.9 next. The published target price at 4,156.5 and one standard deviation support at 4,130.0 follow, then Pivot S1 at 4,128.1 and Thursday's 4,120.9 low. Two standard deviations support at 4,113.3, Wednesday's 4,107.9 settle and three standard deviations support at 4,100.6 come next, with the one-month low at 4,091.2 and Pivot S2 at 4,086.1 the extended references and Pivot S3 at 4,051.3 beyond.
4. Macro Drivers
4.1 Dollar and Real Yields
The dollar index closed at 102.00 in the provider's daily record, down 0.55 from Wednesday's 102.55, after trading as low as 101.88. The ten-year yield index traded between 5.04 and 5.11 percent and closed at 5.09 percent against 5.19 percent on Wednesday, and the thirty-year yield index closed at 5.42 percent against 5.52 percent. The thirteen-week bill index was unchanged at 4.08 percent, so the decline in yields was concentrated at longer maturities.
No inflation-protected yield series was captured for this review, so real yields are not measured here. Feed headlines at 9:19 AM ET described hot inflation alongside a drop in yields and stronger haven demand. In this review's interpretation the combination of a softer dollar and lower nominal yields supported gold on a day when the producer-price data argued for tighter policy.
4.2 Fed and Monetary Policy
The news feed carried at 8:30 AM ET producer prices of 1.3 percent for the month against a 0.6 percent forecast, core producer prices of 0.7 percent against 0.3 percent, annual producer prices of 6.3 percent against 5.4 percent and annual core of 5.0 percent against 4.4 percent. Per the news feed, retail sales rose 0.8 percent against a 0.3 percent forecast and the core measure 0.9 percent against 0.5 percent, while initial jobless claims printed 199 thousand against 200 thousand.
At 4:16 AM ET the feed carried investment-bank commentary expecting a third Federal Reserve increase in March 2027, and after the close, at 4:46 PM ET and 4:48 PM ET, it carried remarks from a regional Federal Reserve president about lower-income households struggling with inflation; feed commentary at 5:15 PM ET said she urged more tightening. A feed headline at 12:00 PM ET said the hot producer-price data failed to revive rate-increase bets. The next policy decision is listed for October 28, 2026, per the news-feed calendar and unconfirmed. The effective federal funds rate was carried at 3.88 percent for October 14.
4.3 Geopolitical Backdrop
The news feed carried at 10:04 AM ET a renewed Houthi warning that Saudi airspace and airports are unsafe and witness reports of booms near the presidential palace in Aden, and at 1:14 PM ET a US statement that a civilian vessel was hit by a projectile from Iran's revolutionary guard and that a civilian container vessel sank while being towed to shore. At 4:43 PM ET and 4:44 PM ET the feed carried Pentagon statements on a rebalancing of the NATO alliance, a reduced troop presence in Europe and a shift of focus toward the Pacific. These are statements carried by the news feed rather than events confirmed for this review, and no causal link to the gold price is asserted.
4.4 China and Structural Demand (Central Bank Buying, PBOC, ETF Flows)
No central-bank purchase figure, Chinese reserve data or fund-holdings series was captured for this review, so none is asserted. The feed carried at 9:26 AM ET that a Chinese state trader bought further US soybean cargoes, a trade item rather than a gold-demand measurement.
4.5 Energy and Cross-Asset
November WTI crude settled at 97.97, up 3.03 percent, after a larger-than-expected official crude draw, and Brent's December contract settled at 105.92. Silver's December contract settled at 57.156, up 2.29 percent, and copper's December contract at 6.5565, down 0.1040. The S&P 500 cash index closed at 7,744.06, up 0.33 percent, the Nasdaq-100 cash index at 29,935.59, down 0.05 percent, and the volatility index at 16.46. The gold to silver ratio eased to 72.96 from 73.52 because silver gained more than gold in percentage terms.
4.6 Institutional Positioning (COT, ETF Holdings, Speculator Length)
No weekly positioning report was captured for this review, so no managed-money or commercial figure is asserted. Open interest on the December contract is shown at 321,688 for Wednesday, up from 320,519 on Tuesday; Thursday's open interest had not been reported when the review was prepared. Thursday's volume was 155,223 contracts against Wednesday's revised 191,279.
5. Gold Fund Options Context (Proxy)
The gold fund's options console was read at about 9:06 PM ET, with a Date Updated stamp of 2026-10-15. It shows a previous-close field of 375.99, matching the fund's Wednesday close in the provider's record, and a current-price field of 380.90, a change of plus 1.31 percent. The console row shows call gamma of minus 204.39 million against put gamma of 130.52 million, call volume of 432.85 thousand against put volume of 87.65 thousand, about 4.9 calls for each put, and a put-to-call open-interest ratio of 0.54.
One-month implied volatility of 20.85 percent sits beneath one-month realised volatility of 21.35 percent, with an implied-volatility rank of 11.46 percent and a skew rank of 38.74 percent; the console's options implied move is 4.95, about 1.30 percent of the 380.90 price field. The console reports volume and modeled gamma without trade side or customer positioning, so the call-heavy volume on a rising day is recorded as an observation only; no directional read and no level is drawn from it.
The desk note read for this review, the 5:28 PM ET Thursday edition, does not discuss gold. The console's high and low volatility point fields are treated as low-confidence and excluded, and no fund level is translated into a futures price.
The proxy caveat stands in any case: the gold fund is a proxy for the futures contract, used qualitatively only, and its levels are never translated into futures prices. Primary edge for gold is the dollar, yield and policy complex in section 4.
6. Forecast
6.1 Night Session (6:00 PM ET Thursday to 3:00 AM ET Friday, Globex/Asia)
Globex reopened at 6:00 PM ET with the December contract quoted at 4,189.2 at 6:33 PM ET, 19.1 above the settle. The Bank of England governor is listed at 10:00 PM ET and a European Central Bank board member at 10:30 PM ET, both per the news-feed calendar and unconfirmed. The Federal Reserve Chair's discussion with the International Monetary Fund's managing director is scheduled for 11:30 PM ET, as the calendar lists it. Bias neutral, expected Globex band roughly 4,160 to 4,215 absent a headline shock.
6.2 London Session (3:00 AM to 8:00 AM ET Friday)
Final euro-area consumer prices are listed at 5:00 AM ET, per the news-feed calendar and unconfirmed. Bias neutral to lower beneath the 20-day settlement average, expected band roughly 4,150 to 4,225, with Pivot R1 at 4,204.9 the first meaningful resistance and the Pivot Point at 4,162.9 the first meaningful support.
6.3 Morning Session (9:30 AM to 12:00 PM ET Friday, US Open)
Import prices for September print at 8:30 AM ET and industrial production at 9:15 AM ET, both as the calendar lists them, before the cash equity open at 9:30 AM ET. Expected band roughly 4,130 to 4,227, with the 4,215 to 4,225 band the first test above and one standard deviation support at 4,130.0 the first test beneath.
6.4 Afternoon Session (12:00 PM to 4:00 PM ET Friday)
Gold settles at 1:30 PM ET, and a Friday settle carries two days of headline exposure into the Sunday reopen. Expected band roughly 4,113 to 4,240.
6.5 Night Session Forward (6:00 PM ET Sunday)
Globex reopens at 6:00 PM ET on Sunday, October 18, 2026, after two days of Gulf, Red Sea and policy headline exposure. The weekend gap references are Pivot R1 at 4,204.9 above and Pivot S1 at 4,128.1 beneath.
6.6 Expected Range (Friday Full Session)
Low-range scenario: 4,150 to 4,215
Mid-range scenario (most likely): 4,130 to 4,227
High-range scenario: 4,084 to 4,256
6.7 Most Likely Path
In this review's analyst judgment the most probable path holds the contract between one standard deviation support at 4,130.0 and two standard deviations resistance at 4,226.9, with the dollar and long-end yields deciding the side. A rally that stalls beneath the 20-day settlement average at 4,226.3 is weighted above a sustained break higher, because the settle sits beneath the 20-day, 50-day, 100-day and 200-day averages, negative direction leads on the 9-day and 14-day directional systems and the composite reads "64% SELL" with the Composite Indicator at "SELL". The 14-day stochastic %K at 24.87 percent also sits beneath %D at 27.64 percent.
The alternative that would invalidate this reading is a further slide in the dollar or in long-end yields that carries the contract through Pivot R2 at 4,239.7, which would put the 50 percent retracement at 4,265.5 in play. Thursday's higher high and higher low and the 62.2 point gain are the evidence against the short reading.
7. Friday Economic Calendar
Globex reopened at 6:00 PM ET on Thursday. A Federal Reserve bank president spoke at 4:30 PM ET, per the news-feed calendar and unconfirmed. The Bank of England governor is listed at 10:00 PM ET and a European Central Bank board member at 10:30 PM ET, both per the news-feed calendar and unconfirmed. The Federal Reserve Chair's discussion with the International Monetary Fund's managing director is scheduled at 11:30 PM ET, as the calendar lists it.
On Friday, the Bank of Canada governor is listed at 12:15 AM ET and final euro-area consumer prices at 5:00 AM ET, both per the news-feed calendar and unconfirmed. Import prices for September print at 8:30 AM ET on Friday, October 16, 2026, and industrial production at 9:15 AM ET on Friday, October 16, 2026, both as the calendar lists them. Gold settles at 1:30 PM ET.
Later in the window, the next policy statement is listed for 2:00 PM ET on October 28, 2026, per the news-feed calendar and unconfirmed. In this review's judgment the first-order scheduled input for gold on Friday is import prices at 8:30 AM ET, as the calendar lists it, read through the dollar and yields, alongside the Federal Reserve Chair's overnight discussion at 11:30 PM ET, as the calendar lists it.
8. Primary Trade Setup
Direction: Short
Rationale: The settle sits beneath the 20-day, 50-day, 100-day and 200-day settlement averages, negative direction leads on the 9-day and 14-day directional systems, and the composite snapshot reads "64% SELL" with the Composite Indicator at "SELL"; a rally toward the 20-day settlement average at 4,226.3 and the 38.2 percent retracement from the four-week low at 4,224.4 offers a short with a defined risk point above Pivot R2 at 4,239.7. Thursday printed a higher high and a higher low with a 62.2 point gain, and the dollar and yields fell, so the setup is an analyst judgment that the rebound stalls beneath the 20-day average rather than a measured edge.
Entry Zone: 4,215 to 4,225
Stop Loss: 4,242 (above Pivot R2 at 4,239.7 and three standard deviations resistance at 4,239.6)
Target 1 (T1): 4,198 (0.3 above Thursday's 4,197.7 high)
Target 2 (T2): 4,176 (5.9 above Thursday's 4,170.1 settle)
Target 3 (T3, extended): 4,154 (2.5 beneath the published target price at 4,156.5)
Risk-to-Reward: Approximately 1:1 to T1, 1:2 to T2, 1:3 to T3
Invalidation: A settle above Pivot R2 at 4,239.7 negates the thesis. Short of that, the edge is removed by acceptance above the entry band rather than by a touch, defined as two consecutive 30-minute closes above 4,225.
Macro override: A soft import-price print that extends the dollar's decline, or a Gulf escalation that revives haven demand, would invalidate the short in real time. In that scenario a move through the 4,242 stop removes the setup, and the 50 percent retracement at 4,265.5 and Pivot R3 at 4,281.7 become the references within one 14-day average true range of 86.1 points.
Sources and methodology
This outlook is built from our session review of the December gold contract, the December ’26 contract, prepared after Thursday's close on October 15, 2026 for the Friday, October 16, 2026 session. Thursday's completed extremes are the inputs behind the published pivot ladder: Pivot R3 at 4,281.7 less Pivot S3 at 4,051.3, divided by three, and Pivot R2 at 4,239.7 less Pivot S2 at 4,086.1, divided by two, both return 76.8, and three times the 4,162.9 Pivot Point less the settle gives 8,318.6, the sum of the 4,197.7 high and the 4,120.9 low. The provider's settlement row, the chart's completed Thursday bar and the 30-minute bars kept for the session carry the same extremes, and only those figures, the dated 2026-10-15 row of the provider's daily record and the review's statements are used to grade Thursday's card. Every timed statement about the session rests on those 30-minute bars, timed by each bar's opening in ET. The settlement-row extremes run from the 6:00 PM ET reopen to the 5:00 PM ET pause, so the 4,197.7 high, printed in the 4:00 PM ET bar after the 1:30 PM ET settlement, belongs to Thursday's session.
Wednesday's 2026-10-14 row has been revised since our Thursday outlook: volume now reads 191,279 contracts against the preliminary 186,260, and open interest is now reported at 321,688; Wednesday's prices are unchanged. Thursday's open interest had not been reported. The moving averages were computed from the provider's 259-session daily settlement series; the oscillators are cited as published for the Friday session, read after the 6:00 PM ET reopen, and the composite strings are quoted verbatim. The provider's displayed day open, high and low of 4,192.1, 4,193.9 and 4,189.0 belong to the new session dated Friday and are not used as Thursday's range. The gold fund is a proxy used qualitatively; its console carries no trade side, its high and low volatility point fields are excluded, and no fund level is translated into a futures price. The percent changes for the dollar index and copper are computed from the stated closes and changes. Scenario ranges are analyst judgment, and items marked unconfirmed come from the news-feed calendar or the news feed.
Thursday’s outlook for this contract is here, and the crude oil contract’s Thursday outlook covers November WTI, which settled at 97.97 on Thursday, up 3.03 percent. Outlooks for ES, NQ, GC and CL are collected on the market outlook page, and our forward trading record is on the performance statement.



