
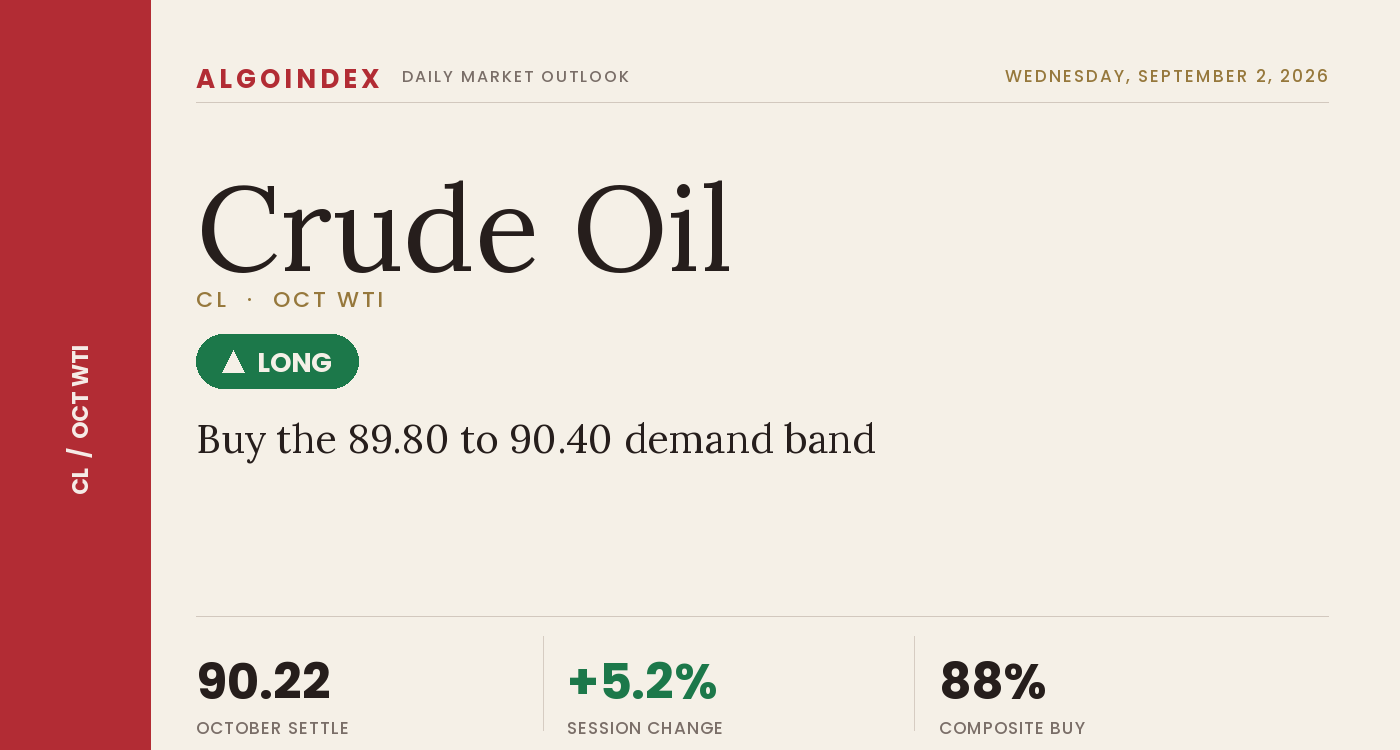
Crude was the origin of Tuesday's cross-asset move rather than a passenger in it. The October contract settled at 90.22 on September 1 and pushed to 92.29 in the overnight session, the highest price the October contract has traded in its own 52-week history and 2.07 points above the settle. Crude gained 5.2 percent from the prior 85.76 settle to close at 90.22, its highest settlement of the year, with the front contract holding above 90 dollars. The precisely verified figure for the day is the waterborne benchmark, which settled at 94.65 dollars per barrel at 2:48 PM ET, higher by 4.16 dollars or 4.6 percent, leaving a 4.43 dollar premium over the domestic grade that is consistent with a maritime chokepoint risk premium. The five-day window shows a gain of 8.63 points, or 10.49 percent, since August 26, with four separate new highs inside those five sessions, and the year-to-date change of positive 33.91 points, or 59.54 percent, is by a wide margin the strongest of the four instruments reviewed.
The driver is unambiguous and it is a supply-route story rather than an ordinary supply-demand one. An escalating military exchange between the United States and Iran ran through the New York afternoon, culminating in a statement from Iranian forces at 3:19 PM ET that United States attacks would tighten the closure of the Strait of Hormuz, which carries roughly a fifth of seaborne crude. A mid-August statement had already indicated the strait would not reopen until conditions were met, so Tuesday tightened an existing constraint rather than introducing a new one. Inventories reinforced the move after the close: a private estimate published at 4:43 PM ET showed a crude draw of 2.6 million barrels against a prior build of 4.2 million, with a distillate draw of 0.3 million and a modest gasoline build of 0.3 million. The cross-asset read confirms the character. The dollar index firmed 0.09 percent to 99.747 and the volatility index rose 9.38 percent to 16.33 while the broad equity proxy fell 0.69 percent and gold fell 2.79 percent, leaving crude the only major asset class with a decisively positive session.
A supply-route repricing above every average into a dense ceiling
The constructive read starts with location. The 90.22 settlement, and the 90.85 late overnight reference above it, sit above every major moving average, the five-day at 86.75, the twenty-day at 83.50, the fifty-day at 78.93, the one-hundred-day at 80.53 and the two-hundred-day at 72.39, with the year-to-date average at 75.17. This is the only instrument in the package where price holds above every level in the stack. The multi-indicator composite reads 88 percent buy, the strongest of the four instruments, with both the short-term and medium-term components positive, and the nine-day directional spread of 24.06, the positive component at 38.93 against 14.87, is the widest in the package by nearly a factor of two. Energy equities confirmed the underlying, the sector proxy gaining 1.27 percent against a broad market that fell 0.69 percent, and products rose alongside crude, which points to a physical constraint being priced rather than a purely speculative leg.
What argues the other way is the extension. The distance from the settle to the five-day average is 3.47 points, slightly more than one nine-day average daily range of 3.07, so price is stretched from its own short-term average by roughly one full session's typical movement. Momentum is elevated: the nine-day relative strength reads 73.83 in conventional overbought territory, and raw stochastics sit between 88.71 and 94.32 percent across every window, placing the contract near the top of its multi-month range rather than merely its recent one. Historic volatility runs 37.18 percent on the nine-day, the highest of the four instruments. Inside the average stack the fifty-day at 78.93 remains beneath the one-hundred-day at 80.53 by 1.60, an unresolved crossing that marks the intermediate trend as recovering rather than mature. A powerful trend in an overbought condition historically resolves through sideways consolidation rather than immediate reversal, though a fast unwind on a de-escalation headline is a real and unhedged risk.
The buy band above 89.11 and the ceiling at 92.08 frame Wednesday
Two structures frame the session. Beneath price, the 89.80 to 90.40 buy band spans the September 1 settle at 90.22 and holds above the 89.11 computed pivot, the first genuine decision level, with the 90.22 to 90.57 shelf pairing the settle and the overnight low as the nearest defence; beneath the pivot, the 88.64 raw-stochastic reset often lets an overbought condition unwind without breaking the trend, and the 86.63 to 86.83 confluence of the one standard deviation support, the nine-day average stall and the five-day average, three references inside 0.20 points, is the most important structural support on the board. Overhead, the 92.08 to 92.63 ceiling stacks the first computed resistance, the contract 52-week high at 92.29, the computed target at 92.32 and the 14-day relative strength at 70, four references inside 0.55 points, and clearing it decisively is the condition for continuation. The official weekly inventory report at 10:30 AM ET is the session's decisive event. Crude has no liquid options proxy, so positioning is read from the futures technical structure, the pivot set and the inventory path.
Buy the pullback band, respect 88.55, size for the catalysts
The plan buys the 89.80 to 90.40 band, spanning the September 1 settle at 90.22 and holding above the 89.11 computed pivot, favouring a pullback over a chase into the overnight extension given the overbought momentum readings. The stop is 88.55, roughly 1.55 points from the 90.10 entry midpoint, set beneath the 88.64 raw-stochastic reset and the computed pivot, so a loss of that band would indicate the overbought condition is resolving downward through the trend rather than sideways. Targets step up to 92.29, the contract 52-week high and overnight high inside the dense ceiling, then 93.81, the one standard deviation resistance paired with the second computed resistance at 93.95, then 95.29, the two standard deviation resistance, only if momentum extends through the second objective on expanding volume after a confirming inventory reading, for reward-to-risk of roughly 1 to 1.4, 1 to 2.4 and 1 to 3.3. The defining risk is that this advance is a supply-route premium rather than a demand repricing: a credible de-escalation or ceasefire headline out of the Gulf would unwind that premium far faster than it accumulated, and a build in the 10:30 AM ET official reading against the 2.6 million barrel private estimate would produce a similar though smaller effect. Given those catalysts, and a fourteen-day average true range of 3.58 percent that is roughly four times the broad equity index equivalent, the setup should be worked at half size. A failure at the 92.08 to 92.63 ceiling on a second approach with contracting volume argues for taking the first objective and standing aside. Our published performance methodology sets out how these calls are graded.
The physical complex is pricing the duration of a Strait of Hormuz disruption, not the intensity of a single exchange of fire, and crude was the only major asset class to gain while the dollar firmed and gold fell. That points to an energy-supply-specific bid, so buying the 89.80 to 90.40 pullback band above the 89.11 pivot and beneath the 92.08 to 92.63 ceiling, sized for the two-sided Gulf catalyst, is the trade, and a verified reopening of the waterway is the one development that flips it.
A supply-route repricing that holds above every average but stalls into a dense ceiling that stacks four references inside 0.55 points is a market to buy on a pullback rather than a print to chase. The plan favours the 89.80 to 90.40 band, respects 88.55 and keeps size light, because the constraint can escalate or resolve on a single headline in either direction.
This is the read our members get every session, before the bell, with the levels drawn and the setup defined. See how the same dealer-positioning work turns into systematic signals.
View pricingThe complete data picture
Every number behind Wednesday’s plan, charted first; the full numeric reference follows underneath.
Full numeric reference, every remaining figure from the review
| Average | Value | Settle vs |
|---|---|---|
| 5-day | 86.75 | above by 3.47 |
| 20-day | 83.50 | above by 6.72 |
| 50-day | 78.93 | above by 11.29 |
| 100-day | 80.53 | above by 9.69 |
| 200-day | 72.39 | above by 17.83 |
| Year-to-date | 75.17 | above by 15.05 |
| Level | Reference |
|---|---|
| 96.44 to 96.92 | the three standard deviation resistance and third computed resistance, the far extension objectives |
| 95.29 | the two standard deviation resistance, extended target three, only on momentum through target two |
| 93.81 to 93.95 | the one standard deviation resistance paired with the second computed resistance within 0.14 points, the first objective on a clean breakout and target two |
| 92.08 to 92.63 | the dense ceiling band, first computed resistance, contract 52-week high, computed target and 14-day relative strength at 70 inside 0.55 points, the decisive zone with target one at 92.29 |
| 90.22 to 90.57 | the September 1 settle and the overnight low, the nearest defensive shelf |
| 89.80 to 90.40 | the primary buy band spanning the settle, the entry |
| 89.11 | the computed pivot, the first genuine decision level |
| 88.64 | the fourteen-by-three day raw stochastic at 80, the overbought reset level |
| 88.55 | the protective stop beneath the pivot and the reset level |
| 87.24 to 87.47 | the first computed support paired with the raw stochastic at 70 |
| 86.63 to 86.83 | the one standard deviation support, the nine-day moving average stall and the five-day average, three references inside 0.20 points, the most important structural support |
| 84.00 to 85.15 | the two and three standard deviation supports, the raw stochastic at 50 and the second computed support |
| 83.50 to 83.87 | the twenty-day moving average and the eighteen-day crossing |
| 78.93 to 80.53 | the fifty-day moving average beneath the one-hundred-day, an unresolved crossing |
| 72.39 | the two-hundred-day average, far beneath the market |
| Metric | Reading |
|---|---|
| Options surface | no liquid crude options proxy; positioning is read from the physical and futures complex, and no level in this review is derived from an options surface |
| Waterborne differential | the waterborne benchmark settled 94.65, up 4.16 or 4.6 percent at 2:48 PM ET, a 4.43 dollar premium over the 90.22 domestic settle |
| Product settles | October natural gas settled 2.9040 per million British thermal units, up 1.76 percent, and October diesel 4.6773 a gallon, both captured at 2:32 PM ET |
| European gas | European gas futures reached their highest level since 2023 at 2:59 PM ET, confirming the energy complex moved as a whole rather than crude alone |
| Historic volatility | 37.18 percent over nine days and 32.19 percent over fourteen days, the highest of the four instruments and roughly six times the equity index equivalent |
| Producer complex | a federal judge allowed antitrust claims against several large domestic shale producers to proceed at 4:46 PM ET, a medium-term producer-behaviour consideration rather than a Wednesday price driver |
| Counterweights | the Treasury Secretary stated at 4:01 PM ET that Gulf producers could bypass the strait within two years, and an 8:16 PM ET report indicated Saudi Arabia plans to free roughly 1 million barrels per day for export, both medium-term rather than immediate |
| Overnight gap warning | the gap between the 3.22 nine-day average true range and the 3.07 nine-day average daily range is 0.15 points, so gap risk is modest relative to intraday movement, the market absorbing news during trading hours |
| Cohort | Weekly change |
|---|---|
| Technical positioning | the multi-indicator composite reads 88 percent buy, the strongest of the four instruments, with the short-term and medium-term components positive and price above all six surveyed moving averages |
| Directional spread | the nine-day directional index at 24.94, positive component 38.93 against negative 14.87, a 24.06 spread that is the widest in the package by nearly a factor of two |
| Inventory path | the private estimate at 4:43 PM ET showed crude lower by 2.6 million barrels against a prior build of 4.2 million, a 6.8 million barrel swing between consecutive readings |
| Inventory detail | Cushing rose 0.2 million against a prior 1.0 million build, gasoline rose 0.3 million against a prior 3.2 million draw, and distillate fell 0.3 million against a prior 0.5 million draw |
| Reserve qualification | a 5:01 PM ET commentary attributed the crude decline partly to continued strategic reserve draws, which are less indicative of underlying demand than commercial draws |
| Coverage note | the dedicated options-positioning dataset used for the equity index products covers exchange-traded equity instruments and is not part of this contract source set, so positioning is built from the futures technical structure, the pivot set and the inventory path |
| Input | |
|---|---|
| Dollar index | 99.747, up 0.09 percent, and crude still rallied 4.6 percent on the waterborne benchmark against it, the supply-side driver dominating the currency channel |
| 10-year yield | 4.802 percent, higher, with an investment-bank note observing a December rate increase now fully priced after the Jackson Hole symposium |
| Gold | the proxy down 2.79 percent and silver down 1.34 percent, precious metals falling while crude rose, an energy-supply-specific move rather than systemic fear |
| Equity index | the broad proxy down 0.69 percent and technology down 1.26 percent, capital leaving long-duration technology for energy and healthcare |
| Equity volatility | the volatility index up 9.38 percent to 16.33, bid but at a low absolute level |
| Global benchmark grade | the waterborne benchmark settled 94.65 at 2:48 PM ET, up 4.16 or 4.6 percent, a 4.43 dollar premium over the 90.22 domestic settle consistent with a maritime chokepoint premium |
| Inflation channel | higher crude feeds directly into headline inflation and supports the hawkish repricing, the mechanism by which this contract has been driving the other three instruments in the package |
| When | Event |
|---|---|
| Tue Sep 1 | an escalating military exchange between the United States and Iran through the New York afternoon, a 3:19 PM ET statement that the Strait of Hormuz closure would tighten, and a 4:43 PM ET private inventory estimate showing a 2.6 million barrel crude draw against a prior 4.2 million build |
| Wed Sep 2 | the employment change survey at 8:15 AM ET forecast 45 thousand, the Bank of Canada decision at 9:45 AM ET forecast to hold at 2.25 percent, factory orders at 10:00 AM ET and the official weekly crude inventory report at 10:30 AM ET, the single first-order crude event |
| Fri Sep 4 | the monthly employment report, affecting crude through the dollar and growth channel |
| Sep 9 to Sep 11 | the short-term energy outlook on September 9, the producer-group monthly report on September 10 and the agency monthly report on September 11, the month scheduled supply-side set-pieces |
| Positioning note | the equity-index options-positioning dataset is not part of this contract source set, so positioning is built affirmatively from the futures technical structure, the pivot set and the inventory path |
The economic releases referenced above are published on the official government calendars below. Price levels are derived from standard technical and statistical methods, and the market read is AlgoIndex's own analysis. How we grade these calls is set out in our performance methodology.
- US Bureau of Economic Analysis, Personal Income and Outlays (PCE)
- US Bureau of Economic Analysis, Gross Domestic Product
- US Bureau of Economic Analysis, release schedule
- US Census Bureau, Advance Durable Goods (M3) release schedule
- US Energy Information Administration, Weekly Petroleum Status Report
- US Department of the Treasury, auction schedule and results
- AlgoIndex performance methodology



