
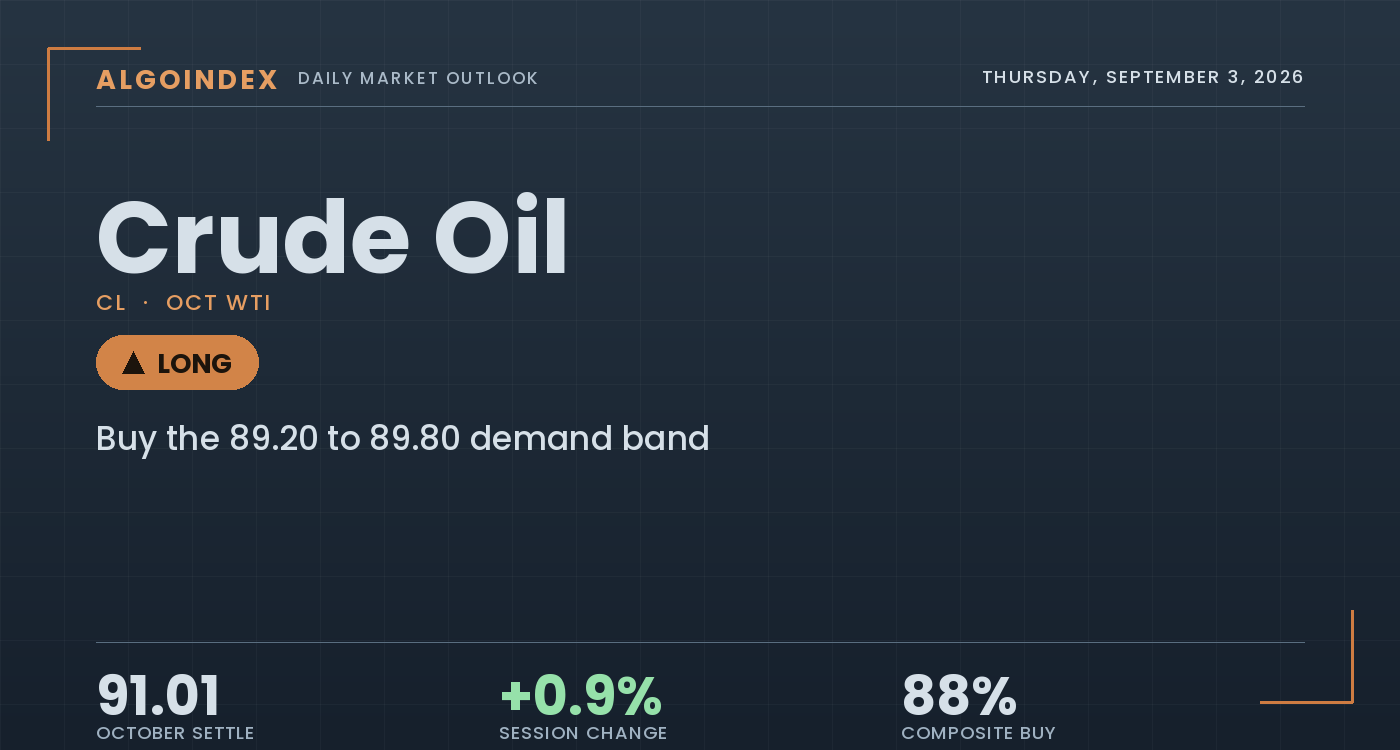
Crude oil settled Wednesday at 91.01, up 79 cents or 0.88 percent from Tuesday's 90.22 settlement, and the headline change understates how much moved inside the session. The high that defined the day did not print during US pit hours at all. It came in the 8:00 PM ET hour of Tuesday evening, roughly two hours after the 6:00 PM ET Globex reopen, when a second round of US strikes against radar and mine-laying capability along Iran's southern coast carried the October contract from 90.77 to 92.05 in a single hour, with follow-through to 92.29 in the 9:00 PM ET hour, the highest front-month trade since late July. That was the end of the advance. Every subsequent hour was a retracement, and the settlement landed 1.28 below the high. The five-day change is 7.28, or 8.72 percent, measured from the 83.53 close of August 27, and the week has already taken out an entire prior weekly range and added to it.
The fact that matters most for Thursday is where the buying stopped. The July swing high sits at 92.74 with a secondary high at 92.07 the following session. The overnight surge ran to 92.07 and then 92.29 before it failed, a test of a six-week supply shelf that could not hold, which leaves 92.07 to 92.74 as the defining band above the market. Against that rejection sits a physical picture that is genuinely tight. The weekly government inventory report at 10:30 AM ET showed crude stocks falling 4.45 million barrels against an expected build of 60,000, and the session low of 88.97 printed in that same hour before the reversal. Distillate inventories sit 14.0 percent below the five-year seasonal average and gasoline 6.1 percent below, the forward curve is in steep backwardation with October holding a 2.73 premium to November, and diesel settled at 4.6822 a gallon within 1.76 percent of its yearly high. The contradiction into Thursday is that the physical market argues higher while the price action argues that 92.29 was enough for now, and two internals side with the second read: gasoline settled down 1.00 percent on a day crude rose 0.88 percent, and the electronic quote as of 5:00 PM ET at 90.63 finished 38 cents below the settlement, a flip from Tuesday.
A rejection at the six-week shelf above every moving average
The constructive read starts with location. The 91.01 settlement sits above every major moving average, the five-day at 88.24, the twenty-day at 84.24, the fifty-day at 79.36, the one-hundred-day at 80.64 and the two-hundred-day at 72.54, with the year-to-date average at 75.26. Spot near 90.70 is 25.0 percent above the long average. The multi-indicator composite reads 88 percent buy with strength at maximum and direction strengthening, twelve of thirteen component signals positive. The nine-day directional index reads 27.14 with the positive directional indicator at 36.04 against 13.77 negative, a decisive short-term uptrend, and stochastics sit in the nineties across the twenty-day and fifty-day windows, closing near the top of the recent range on every lookback. The forward curve reinforces the physical read, October at 91.01 holding 2.73 above November and 5.76 above December, steep backwardation that is the market paying up for prompt barrels.
What argues the other way is the extension and the rejection. Spot near 90.70 is 6.46 above the twenty-day at a moment when the 14-day average true range is 3.17, so roughly two sessions of normal range separate spot from its own mean, and mean reversion does not need a bearish catalyst to happen from here. Inside the average stack the fifty-day at 79.36 remains beneath the one-hundred-day at 80.64, an unresolved intermediate crossover that is the reason the long-term component of the composite reads only 33 percent buy while the short and medium components read 100 percent. The nine-day relative strength at 73.00 is the only reading above 70, while the 14-day at 67.32 and the twenty-day at 63.40 are not, the signature of a fast recent advance inside a trend that is not yet historically stretched. The rejection at 92.29 completed 97.7 percent of the round trip from the July 23 high at 92.74 down to the August 5 low at 73.48, a natural place for a first attempt to stall.
The 89.20 to 89.80 buy band and the 92.07 ceiling frame Thursday
Two structures frame the session. Beneath price, the 89.20 to 89.80 buy band is built around the 89.22 first computed support pivot, with the 89.76 raw-stochastic marker at its top and the 90.51 to 90.63 shelf pairing the session low and the Wednesday electronic quote as of 5:00 PM ET above it; the 88.97 to 89.08 base, where the 7:00 AM and 9:00 AM ET hours found their bids, is the structural support and the invalidation. Overhead, the 92.07 to 92.29 immediate ceiling stacks the July secondary high and the contract yearly high, with the 92.51 to 92.74 confirmation band, the 14-day relative strength at 70 and the July swing high immediately above; a sustained hour above 92.74 removes the six-week shelf entirely. The decisive difference from Wednesday is that Thursday carries no inventory report, no producer-group meeting and no scheduled supply data, which removes the mechanism that produced Wednesday's reversal. The 10:00 AM ET services activity report, consensus 54.1, is the only scheduled print capable of moving the demand side, so unscheduled geopolitical headline flow is the first-order driver. Crude has no liquid options proxy, so positioning is read from the physical stack, the forward curve and the futures technical structure.
Buy the pullback band, respect 88.60, size for the catalysts
The plan buys the 89.20 to 89.80 band, built around the 89.22 first computed support pivot, favouring a controlled pullback over a purchase into the failed 92.29 shelf given the overbought momentum and the rejection. The stop is 88.60, roughly 0.90 points from the 89.50 entry midpoint, set beneath the 88.97 session low and the 89.06 to 89.08 shelf with the 90-cent buffer crude's 3.17 average true range requires. Targets step to 91.00, the Wednesday settlement reference the market has orbited all evening, then 92.29, the session high and the October contract yearly high at the lower edge of the six-week shelf, then 93.55, the computed target price paired with the 93.58 crossover stall, only on a clean break of the 92.07 to 92.74 band on volume, for reward-to-risk of roughly 1 to 1.7, 1 to 3.1 and 1 to 4.5 from a 89.50 fill. The defining risk is two-sided. An interruption to Strait transit, a strike on export infrastructure or a further escalation in Russian supply losses gaps the market through 92.74 toward 94.08 to 95.86 and invalidates any patient entry; a ceasefire, confirmation that transit volumes are running near normal for a sustained period, or a coordinated policy push for lower retail fuel prices removes the risk premium quickly, and the 90.63 electronic quote as of 5:00 PM ET finishing 38 cents below the settlement is an early sign some participants are already positioning for that. With a 14-day average true range near 3.5 percent of spot and Friday payrolls ahead, the setup is worked at half size, and a second failed test of the 92.07 to 92.74 shelf that then loses 90.76 is the signal to stand aside. Our published performance methodology sets out how these calls are graded.
The physical market is tight in exactly the places that matter, crude stocks down 4.45 million barrels, distillate 14.0 percent below its seasonal average and a forward curve in steep backwardation, yet the first return to the 92.07 to 92.74 July shelf failed at 92.29. That argues for buying a controlled pullback into the 89.20 to 89.80 band above the 89.22 pivot rather than chasing the overnight print, sized for a two-sided geopolitical catalyst, and a verified reopening of the Strait is the one development that flips the read.
A supply-tight market that holds above every moving average but rejects the six-week July shelf at 92.29 on its first attempt is a market to buy on a pullback rather than a print to chase. The plan favours the 89.20 to 89.80 band, respects 88.60 and keeps size light, because the constraint can escalate or resolve on a single headline in either direction, with Friday payrolls close behind.
This is the read our members get every session, before the bell, with the levels drawn and the setup defined. See how the same dealer-positioning work turns into systematic signals.
View pricingThe complete data picture
Every number behind Thursday’s plan, charted first; the full numeric reference follows underneath.
Full numeric reference, every remaining figure from the review
| Average | Value | Settle vs |
|---|---|---|
| 5-day | 88.24 | above by 2.77 |
| 20-day | 84.24 | above by 6.77 |
| 50-day | 79.36 | above by 11.65 |
| 100-day | 80.64 | above by 10.37 |
| 200-day | 72.54 | above by 18.47 |
| Year-to-date | 75.26 | above by 15.75 |
| Level | Reference |
|---|---|
| 95.86 to 97.00 | the third computed resistance, the two and three standard deviation bands, the disorderly-supply extension |
| 94.08 to 94.47 | the second computed resistance paired with the one standard deviation band, a session that requires a supply headline |
| 93.55 to 93.58 | the computed target price and the three-by-ten day crossover stall, target three once the July shelf clears |
| 92.51 to 92.74 | the confirmation band, the 14-day relative strength at 70 and the July swing high, a sustained break removing the six-week shelf |
| 92.07 to 92.29 | the immediate ceiling, the July secondary high and the contract yearly high, target two, the level that rejected the overnight advance |
| 90.76 | the standard pivot point, the line between the constructive and neutral reads |
| 90.51 to 90.63 | the session low paired with the Wednesday electronic quote as of 5:00 PM ET, the immediate shelf |
| 89.20 to 89.80 | the primary buy band and the entry, with the 89.76 raw-stochastic marker at its top |
| 89.22 | the first computed support pivot, the level the long is built around |
| 88.97 to 89.08 | the structural support base and the primary invalidation, where the morning hours found their bids |
| 88.60 | the protective stop beneath the base with the 90-cent average-true-range buffer |
| 87.44 to 87.55 | the second computed support paired with the one standard deviation band, the first genuine downside objective |
| 85.90 to 86.12 | the third computed support and the two standard deviation band, aligned with the Monday 85.76 settle |
| 79.36 to 80.64 | the fifty-day moving average beneath the one-hundred-day, an unresolved crossing |
| Metric | Reading |
|---|---|
| Options surface | no liquid crude options proxy, so positioning is read from the physical and futures complex, and no level in this review is derived from an options surface |
| Listed options volatility | the listed October options, fifteen days from their September 17 expiry, price implied volatility at 43.58 percent against 14-day realized of 32.53 percent and 9-day of 37.42 percent, the market paying for headline risk over observed movement |
| Forward curve | October at 91.01 sits 2.73 above November at 88.28 and 5.76 above December at 85.25, steep backwardation and the market paying up for prompt barrels |
| Refining margins | the gasoline crack computes to 39.35 dollars per barrel and the distillate crack to 105.64, a 3-2-1 blended margin of 61.45, distillate scarcity paying refiners almost any price to produce |
| Inventory report | crude stocks fell 4.45 million barrels against an expected build of 60,000, with distillate 14.0 percent and gasoline 6.1 percent below their five-year seasonal averages |
| Historic volatility | 37.42 percent over nine days and 32.53 percent over fourteen days, elevated and consistent with a supply-shock advance |
| Tanker and rig data | crude held on vessels stationary at least seven days rose 7.1 percent to 107.58 million barrels in the week ended August 28, and the weekly oil rig count fell five to 447 |
| Producer positioning | the producer category added 10,849 shorts against 586 longs to August 25, physical producers selling forward aggressively into the strength |
| Cohort | Weekly change |
|---|---|
| Technical positioning | the multi-indicator composite reads 88 percent buy with twelve of thirteen component signals positive and price above all six surveyed moving averages, the lone sell the fifty-day against one-hundred-day crossover |
| Directional spread | the nine-day directional index at 27.14 above the 25 strong-trend threshold, the positive component 36.04 against 13.77, a 22.27 spread and a decisive short-term uptrend |
| Managed money | a net long of 84,020 as of August 25, 196,882 long against 112,862 short, with shorts growing 4,803 on the week against a long increase of only 1,344 |
| Producer hedging | the producer category added 10,849 shorts against 586 longs, physical producers selling forward aggressively into the strength, consistent with the steep backwardation |
| Positioning staleness | the weekly report is current only to August 25, eight days stale, and those eight days contain the entire 8.72 percent advance, so it reads as a starting condition rather than a current picture |
| Coverage note | crude carries no liquid options-positioning proxy, so positioning is built from the physical stack, the forward curve in steep backwardation, the refining margins and the futures technical structure |
| Input | |
|---|---|
| Dollar index | 99.384, easing 0.19 percent, a mild tailwind for dollar-denominated crude, though the currency channel is overwhelmed by supply risk |
| 10-year yield | 4.776 percent, not the driver here as the supply premium dominates the normal cross-asset correlation |
| Gold and silver | gold up 1.55 percent and silver up 1.99 percent, dollar-and-yield trades rather than fear trades, confirming a commodity-supply event over a broad risk shift |
| Equity index | the broad proxy up 0.46 percent at 7,666.60 with equity volatility down 6.98 percent at 15.19, equities calm while crude made a six-week high |
| Energy sector fund | up 0.51 percent, a muted response relative to the crude move, equity investors treating the rally as a price event rather than an earnings event |
| Global benchmark grade | the waterborne benchmark settled 95.63, up 98 cents or 1.04 percent, marginally outperforming the domestic grade and leaving a 4.62 spread |
| Product complex | gasoline settled down 1.00 percent at 3.1038 while crude rose 0.88 percent, and diesel settled 4.6822 within 1.76 percent of its yearly high, the product complex not confirming the crude bid |
| When | Event |
|---|---|
| Wed Sep 2 | a second round of US strikes against Iranian radar and mine-laying capability drove the overnight to 92.29, the weekly crude inventory report showed a 4.45 million barrel draw against an expected build, and the settle landed 91.01 |
| Thu Sep 3 | no inventory report, no producer-group meeting and no scheduled supply data, with the 10:00 AM ET services activity report the only scheduled print capable of moving the demand side and geopolitical headline flow the first-order driver |
| Fri Sep 4 | the monthly payrolls report at 8:30 AM ET, consensus 55,000 against a prior reading of negative 23,000, a reason not to commit full size ahead of it |
| Sep 9 to Sep 11 | the short-term energy outlook tentatively September 9, the producer-group monthly report September 10 and the demand-side agency report September 11, the near supply-side set-pieces |
| Sep 10 and Sep 16 | the holiday-shifted weekly inventory report Thursday September 10 at 12:00 PM ET and the Federal Reserve decision September 16 |
The economic releases referenced above are published on the official government calendars below. Price levels are derived from standard technical and statistical methods, and the market read is AlgoIndex's own analysis. How we grade these calls is set out in our performance methodology.
- US Bureau of Economic Analysis, Personal Income and Outlays (PCE)
- US Bureau of Economic Analysis, Gross Domestic Product
- US Bureau of Economic Analysis, release schedule
- US Census Bureau, Advance Durable Goods (M3) release schedule
- US Energy Information Administration, Weekly Petroleum Status Report
- US Department of the Treasury, auction schedule and results
- AlgoIndex performance methodology



