Friday's outlook planned to sell January crude into 83.50 to 83.80, and the market took until the afternoon to get there. The 2:00 PM ET bar printed 83.59, inside the band by nine cents, and the 2:30 PM ET bar traded down to 82.83, through the 83.15 objective. The 82.65 and 82.15 objectives did not trade after the band did. Neither did the 84.15 stop, although the 3:30 PM ET bar came within 0.08 of it at 84.07.
The day before the band was a different story. January fell through the London hours to 80.78 at 4:30 AM ET, the lowest print since 09/04/26, then recovered 2.63 to settle at 83.41, up 0.97 or 1.18 percent. Friday printed a higher high and a lower low against Thursday, an outside session, across a 3.29 point range, the widest since 11/18/26. Crude rose while the S&P 500 cash index fell 3.70 percent and gold fell 4.62 percent.
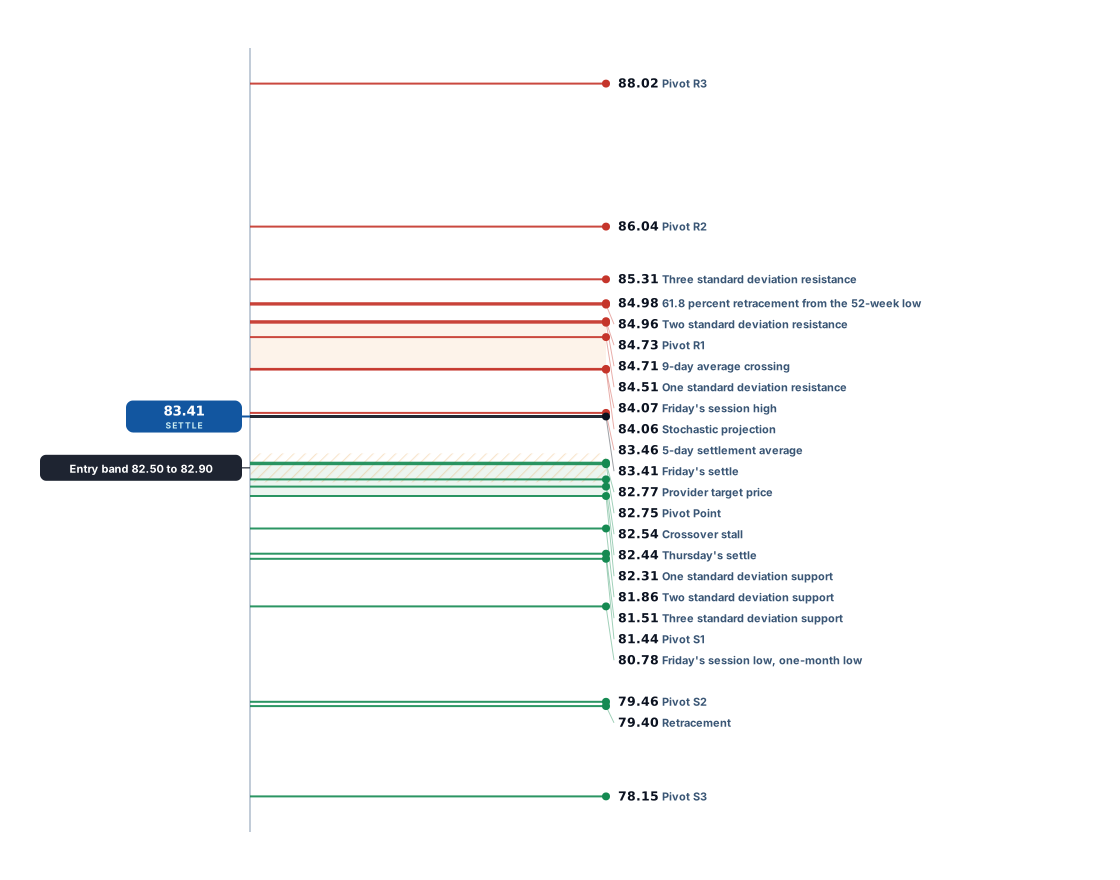
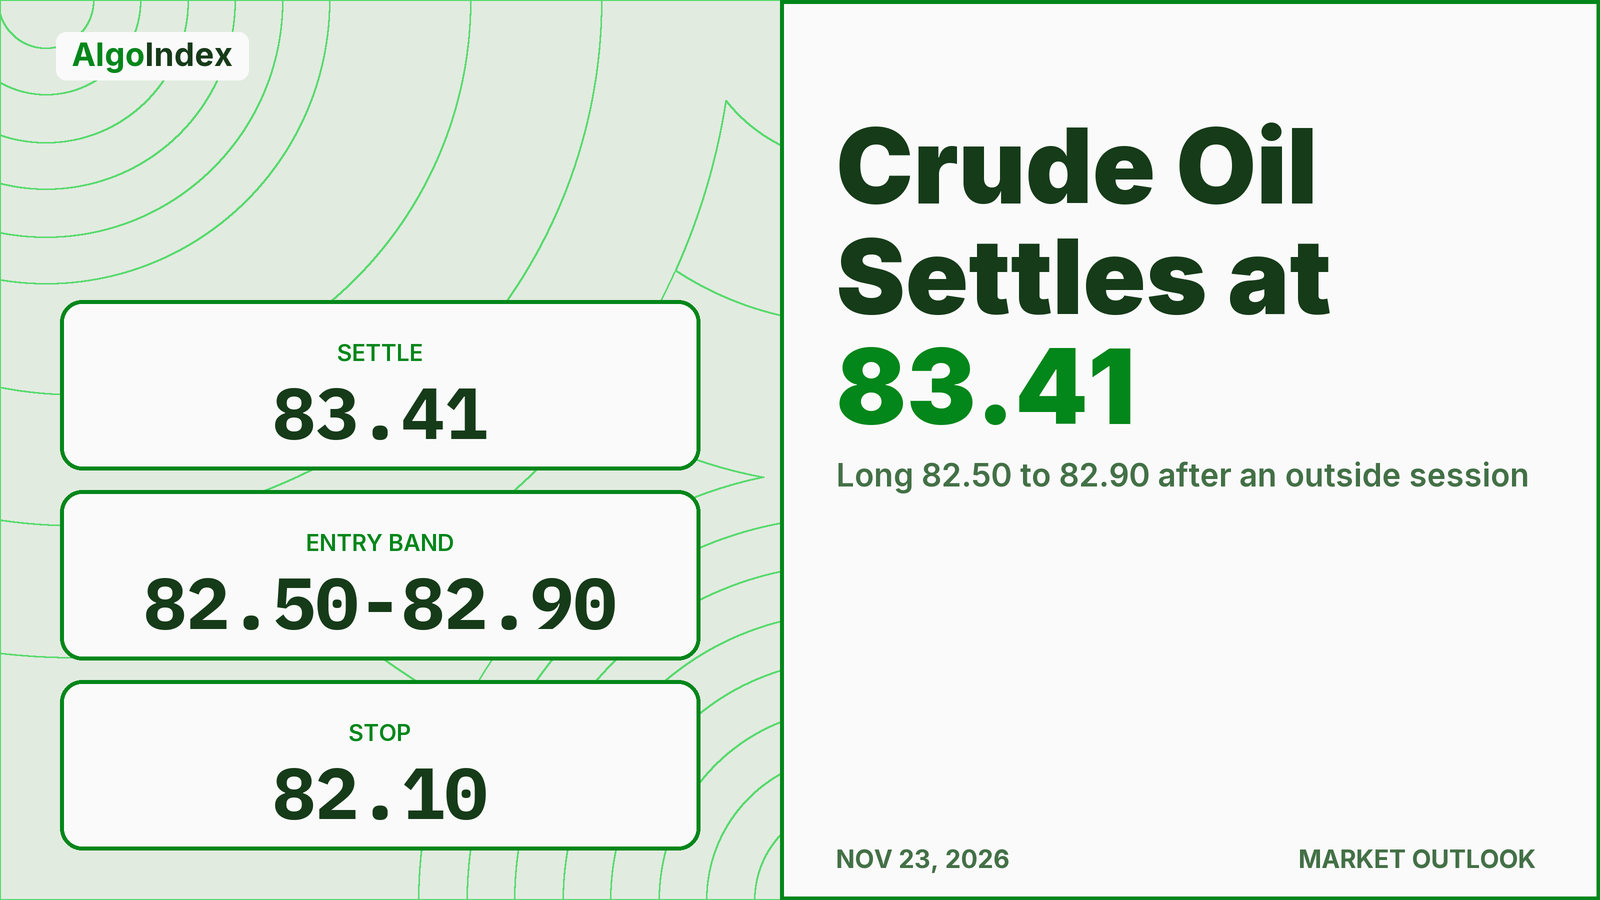
Monday's plan turns around. It buys a pullback into 82.50 to 82.90, around the Pivot Point at 82.75 and the 82.77 target price, with the stop at 82.10 beneath one standard deviation support at 82.31. Two days of weekend headlines on the US and Iran sit between Friday's settle and the 6:00 PM ET Sunday reopen.
AT A GLANCE
- January settle 83.41, up 0.97 or 1.18 percent; range 80.78 to 84.07, an outside session; second consecutive higher settle.
- Friday's card: the 83.50 to 83.80 band traded at 2:00 PM ET and the 83.15 objective at 2:30 PM ET; 82.65, 82.15 and the 84.15 stop did not trade.
- Monday's setup: long 82.50 to 82.90, stop 82.10, objectives 83.30, 83.90 and an extended 84.50.
- Thesis negated on a settle beneath Pivot S1 at 81.44; two consecutive 30-minute closes beneath 82.50, with the stop untouched, remove the edge.
- Settle sits beneath the 5-day 83.46, 9-day 84.73, 20-day 90.23, 50-day 90.34 and 100-day 83.67 averages, above the 200-day 78.41.
- Calendar: US flash purchasing manager surveys 9:45 AM ET Monday, news-feed calendar, unconfirmed; weekly petroleum status report 10:30 AM ET Wednesday, November 25.
How Friday traded: a London low at 80.78 and an afternoon recovery
The January contract reopened at 83.10 on Thursday evening, 0.66 above Thursday's 82.44 settle, and held between 82.37 and 83.25 through the 2:30 AM ET bar. Then the selling started. The 3:00 AM ET bar fell 0.75, from 82.71 to 81.96, the largest decline of any bar in the session, and the 4:30 AM ET bar printed the 80.78 low before closing at 80.97.
Buyers came back before New York. The 6:00 AM ET bar gained 0.67 and the contract reached 82.49. The 9:30 AM ET bar, which spans the cash equity open, fell 0.53 from 82.20 to 81.67, and from the 10:00 AM ET bar through the 11:30 AM ET bar the contract held between 81.27 and 82.18.
The afternoon belonged to the buyers. The 1:00 PM ET bar closed at 83.00, the 2:00 PM ET bar reached 83.59, and the 2:30 PM ET settlement came at 83.41. After the settle the 3:00 PM ET bar gained 0.65, from 83.01 to 83.66, and coincided with a news-feed report at 3:07 PM ET of a tanker struck in the Strait of Hormuz and a 3:22 PM ET report that new Iran strikes are under consideration, both unconfirmed. The 3:30 PM ET bar printed the 84.07 session high and closed at 83.97. The timing is coincident; the reports are not established as the cause, and the high came after the settlement.
Settlements over the last eight sessions read 85.43, 87.69, 87.29, 84.47, 84.65, 82.31, 82.44 and 83.41. Highs over the last six sessions read 88.49 on 11/13/26, 88.21 on 11/16/26, 85.97 on 11/17/26, 84.77 on 11/18/26, 83.91 on 11/19/26 and 84.07 on Friday, so Friday broke a run of lower highs by 0.16. Lows over the same sessions read 86.80, 83.77, 83.41, 81.20, 81.66 and 80.78. Over five sessions the contract is down 3.88 from the 87.29 settle of 11/13/26, a decline of 4.44 percent, and it settled 4.28 beneath the 87.69 settle of 11/12/26.
An outside session that recovered 2.63 from its low and settled in the upper fifth of the range reads as buyers absorbing the London decline. The settle beneath the 84.07 high and beneath the 9-day average still leaves the shorter trend lower.
Gulf reports, Brent and a market that sold almost everything else
The news feed carried a run of Gulf headlines after the settle. At 3:07 PM ET a maritime security report said a tanker on an outbound transit of the Strait of Hormuz was struck by an unknown projectile. At 3:22 PM ET a press report said the US president is considering new Iran strikes, and at 3:47 PM ET the president said the US is being patient. All three news-feed items are unconfirmed. At 4:09 PM ET the feed carried a US statement on targeting oil trustees the Iranian government relies on, and between 4:35 PM ET and 4:48 PM ET remarks by Iran's foreign minister that Tehran still has hope in diplomacy and that a two-day Hormuz plan remains on the table.
The provider's commentary attributed Friday's gain to supply risk in the Middle East and said Iran had struck US military facilities in Bahrain and Kuwait several times over the past week and stepped up attacks on commercial vessels. That is attributed commentary and was not recomputed. Brent settled at 92.57 dollars, up 0.59, at 2:50 PM ET, per the news feed and unconfirmed.
Everything else moved the other way. The S&P 500 cash index fell 3.70 percent, the volatility index rose 7.45 points to 35.89 and December gold fell 4.62 percent. The dollar index closed at 103.84, down 0.05, and the ten-year yield index closed at 4.91, down 0.14. In this outlook's interpretation, crude's gain on that kind of session is consistent with a supply premium tied to the Gulf reports outweighing the demand concern a weaker equity market implies; the closes and headlines were simultaneous and do not prove that mechanism.
In refined products the news feed reported December gasoline settling at 2.5027 dollars a gallon and December diesel at 3.9216 dollars a gallon at 2:31 PM ET, and December natural gas at 3.4110 dollars at 2:32 PM ET, all unconfirmed. Refinery utilization and crack spreads were not captured. On supply policy, the 42nd OPEC and non-OPEC Ministerial Meeting, the 69th Joint Ministerial Monitoring Committee and the eight-country group's meeting on the January 2027 production level are scheduled for Sunday, November 29, 2026, per the verified forward calendar, which prints no time. No producer-group statement was captured for Friday.
What the positioning data show
No options positioning data set for crude was read for this outlook, so it carries no gamma map, no options concentration levels and no flow attribution, and none is borrowed from another instrument. The positioning inputs are the expiring front spread, the volume record and the weekly positioning report.
The December contract expired with Friday's settle at 83.98, up 0.77, which left the front spread at 0.57 in favor of the expiring month. January volume was 275,335 contracts on Friday against 286,961 on Thursday, and the provider lists 12/21/26 as the January contract's expiration date.
The weekly positioning report for the week to Tuesday, November 17, 2026, shows managed money at 153,611 long, up 5,519, against 137,797 short, up 15,419, and producers at 649,994 long against 264,767 short, as listed. Speculative shorts grew almost three times as fast as speculative longs that week.
The trade map for Monday
The setup is a long from 82.50 to 82.90, around the Pivot Point at 82.75 and the 82.77 target price, with the 82.54 crossover stall inside the band. The stop is 82.10, beneath one standard deviation support at 82.31. Objectives are 83.30, beneath Friday's 83.41 settle, then 83.90 beneath Friday's 84.07 high, and an extended 84.50 beneath one standard deviation resistance at 84.51.
Measured from the 82.70 midpoint of the band, the risk to the stop is 0.60 and the three objectives sit 0.60, 1.20 and 1.80 away, or 1.00R, 2.00R and 3.00R. The 14-day average true range is 3.64 points against that 0.60 point stop distance.
A settle beneath Pivot S1 at 81.44 negates the thesis. Short of that, and only while the 82.10 stop has not traded, two consecutive 30-minute closes beneath 82.50 remove the edge. A bar that trades through 82.10 before it closes stops the trade first, so the two closes cannot be counted on to arrive before the stop.
The composite still reads 56 percent sell and the settle sits beneath the 9-day, 20-day and 50-day averages. That is why the plan waits for a pullback into the band rather than buying the settle. A weekend de-escalation between the US and Iran or a softer turn in the Hormuz reports could remove the supply premium; a move through 82.10 would then end the long before the objectives, and two standard deviation support at 81.86, 0.24 beyond the stop, would be the reference. The setup is an analyst judgment that the supply premium holds, not a measured edge.
How Monday could unfold
Night Session (6:00 PM ET Sunday to 3:00 AM ET Monday)
Globex reopens at 6:00 PM ET on Sunday, November 22, 2026. Australian flash purchasing manager surveys are listed for 5:00 PM ET Sunday by the news-feed calendar, unconfirmed. A reopen above Friday's 84.07 high would put Pivot R1 at 84.73 and the 84.98 retracement in view; a reopen beneath the Pivot Point at 82.75 would put Pivot S1 at 81.44 in view. If the weekend passes without a new escalation, the overnight session is likely to hold between 82.40 and 84.30.
London Session (3:00 AM to 8:00 AM ET Monday)
French flash surveys are listed for 3:15 AM ET, German for 3:30 AM ET, euro area for 4:00 AM ET and UK for 4:30 AM ET, by the news-feed calendar, unconfirmed. Bias two-way around the Pivot Point at 82.75, roughly 82.00 to 84.20.
Morning Session (9:00 AM to 12:00 PM ET Monday)
The cash equity open at 9:30 AM ET is the first directional test, and the US flash surveys are listed for 9:45 AM ET by the news-feed calendar with a manufacturing forecast of 54.5 against a prior 54.9, unconfirmed. A pullback into the 82.50 to 82.90 band above one standard deviation support at 82.31 is the test the setup needs, roughly 81.90 to 84.30.
Afternoon Session (12:00 PM to 2:30 PM ET Monday)
The two-year note auction is listed for 1:00 PM ET by the news-feed calendar, unconfirmed. Roughly 82.30 to 84.60, with the Pivot Point at 82.75 the reference into the 2:30 PM ET settlement.
Night Session Forward (6:00 PM ET Monday)
New York Fed President Williams is listed to speak at 4:00 PM ET Monday by the news-feed calendar, unconfirmed. The weekly petroleum status report is scheduled for 10:30 AM ET on Wednesday, November 25, 2026, and the Thanksgiving holiday closes US markets on Thursday, November 26, 2026, both per the verified forward calendar. The news-feed calendar lists a prior crude inventory change of 3.380 million barrels, unconfirmed.
The most likely path reopens near the 83.41 settle, dips toward the 82.50 to 82.90 band and holds above 82.31, then retests Friday's 84.07 high. A test of Pivot R1 at 84.73 is more likely than a run to Pivot R2 at 86.04. The alternative is a settle beneath Pivot S1 at 81.44, which could bring Friday's 80.78 low and Pivot S2 at 79.46 back into play; a weekend de-escalation, a softer turn in the Hormuz reports or further equity weakness that lifts demand concern could drive it. A weekend escalation could instead gap the contract above 84.07 toward 84.73 and the 84.98 retracement before the setup triggers.
The complete data picture
Every level, average, oscillator and range figure from the review is carried below: charts first, then the full numeric reference.
Full numeric reference
Price and range
| Item | Value |
|---|---|
| Friday session (open, high, low, settle) | 83.10, 84.07, 80.78, 83.41 |
| Change from Thursday's 82.44 settle | +0.97, +1.18 percent |
| Settle versus low and high | 2.63 above the low, 0.66 beneath the high |
| Versus Thursday | high 0.16 above 83.91, low 0.88 beneath 81.66 |
| Daily ranges since 11/09/26 | 6.17, 2.98, 2.75, 4.06, 1.69, 4.44, 2.56, 3.57, 2.25, 3.29 |
| Previous widest recent range | 3.57 on 11/18/26 |
| 80.78 low | lowest since the 80.71 low of 09/04/26 |
| 52-week, 13-week and one-month high | 103.01 on 10/30/26 |
| 13-week low, 52-week low | 75.92, 55.80 |
| Settle versus the 84.98 retracement | 1.57 beneath |
| Overnight hold before 3:00 AM ET | 82.37 to 83.25 through the 2:30 AM ET bar |
| Pivot check | (88.02 minus 78.15) / 3 and (86.04 minus 79.46) / 2 both return 3.29; high plus low 164.85 |
Moving averages
| Average | Value | Settle versus average | Run |
|---|---|---|---|
| 5-day | 83.46 (84.23 Thursday) | 0.05 beneath | fifth settle beneath; last above 11/13/26 |
| 9-day | 84.73 (84.98 Thursday) | 1.32 beneath | fifteenth beneath; last above 10/30/26 |
| 20-day | 90.23 | 6.82 beneath | fifteenth beneath; last above 10/30/26 |
| 50-day | 90.34 | 6.93 beneath | thirteenth beneath; last above 11/03/26 |
| 100-day | 83.67 | 0.26 beneath | third beneath; last above 11/17/26 |
| 200-day | 78.41 | 5.00 above | above on all 61 sessions since 08/27/26 |
Older settlements in each window explain the stack order: the four older settlements in the 9-day window averaged 86.32, the 11 older in the 20-day window 94.73, the 30 older in the 50-day window 90.41, the 50 older in the 100-day window 77.00 and the 100 older in the 200-day window 73.15. The series holds 260 completed sessions from 11/10/25 through Friday.
Oscillators, trend and volatility
| Reading | 9-day | 14-day | 20-day |
|---|---|---|---|
| Relative strength | 34.67 | 38.07 | 41.52 |
| Raw stochastic | 34.11 percent | 16.05 percent | n/a |
| Stochastic %K / %D | n/a | 9.13 / 7.78 percent | n/a |
| ADX (+DI / -DI) | 45.08 (9.05 / 31.07) | 34.84 (11.65 / 28.47) | n/a |
| Historic volatility | 27.74 percent | 44.87 percent | n/a |
| Average true range | 3.59 | 3.64 | 3.58 |
| Average daily range | 3.07 | 3.96 | 3.87 |
| Composite multi-indicator read | Value |
|---|---|
| Overall (Friday) | 56 percent sell, strength minimum, direction weakening |
| Short / medium / long horizon | 80 percent sell / 50 percent sell / hold |
| Thursday / a week ago / a month ago | 48 percent sell / 16 percent sell / 100 percent buy |
| Range frame | Low | High |
|---|---|---|
| Settle plus and minus the 14-day ATR of 3.64 | 79.77 | 87.05 |
| One standard deviation | 82.31 | 84.51 |
| Two standard deviations | 81.86 | 84.96 |
| Three standard deviations | 81.51 | 85.31 |
| Low-range scenario | 82.40 | 84.30 |
| Mid-range scenario, most likely | 81.40 | 85.30 |
| High-range scenario | 79.80 | 87.00 |
Cross-asset, products and positioning
| Item | Value |
|---|---|
| December contract final settle | 83.98, up 0.77; front spread 0.57 |
| January volume | 275,335 Friday, 286,961 Thursday |
| Managed money (week to 11/17/26) | 153,611 long (+5,519), 137,797 short (+15,419) |
| Producers | 649,994 long, 264,767 short |
| Brent (news feed, unconfirmed) | 92.57, up 0.59 |
| December gasoline / diesel / natural gas (news feed, unconfirmed) | 2.5027 / 3.9216 / 3.4110 |
| Dollar index / ten-year yield index | 103.84 (down 0.05) / 4.91 (down 0.14) |
| S&P 500 cash / volatility index / December gold | down 3.70 percent / up 7.45 to 35.89 / down 4.62 percent |
| University of Michigan final survey (Friday, news feed) | 51.5 against a 51.6 forecast |
Sources and methodology
Prices, settlements and volume come from the exchange settlement record and the daily series for the January contract (CLF27). Session timing comes from Friday's 30-minute bars, from the Thursday 6:00 PM ET reopen through the 4:30 PM ET bar. Moving averages were computed from 260 completed daily settlements; oscillators, the composite read, the standard-deviation bands and the pivot ladder are quoted as published. No options positioning data set for crude was read. Provider pages were read at 5:55 PM ET, before the 6:00 PM ET reopen, and the pivot ladder effective Monday, November 23, reproduces all 7 published rungs from Friday's 84.07 high, 80.78 low and 83.41 settle.
The prior card, in Friday's outlook, sold January crude into 83.50 to 83.80 with an 84.15 stop and objectives at 83.15, 82.65 and 82.15. It is graded only on its own levels across Friday's full 30-minute path; no fill is assumed beyond the band edge first traded, and an objective counts only when it traded after the band first traded. The band first traded at 83.50 in the 2:00 PM ET bar, whose high of 83.59 stopped short of the 83.65 midpoint. The 83.15 objective traded in the 2:30 PM ET bar, 0.35 below the 83.50 edge. 82.65 and 82.15 did not trade after the band, and the 84.15 stop never traded; the 84.07 high in the 3:30 PM ET bar came within 0.08 of it. The 80.78 low printed at 4:30 AM ET, before the band traded, so it does not count toward the card.
Every outlook is graded in public against its own levels; the running record sits on our performance statement.
Two higher settles in a row. Monday may show whether a pullback can hold above 82.31.