Friday's outlook planned to sell the December Nasdaq-100 contract on a rebound into 26,950 to 27,000. The rebound never came. The session high of 26,603.50 printed in the first bar after Thursday's 6:00 PM ET reopen, 346.50 points beneath the bottom of the band, so the card never triggered: no entry, no stop at 27,125 and no objective counted.
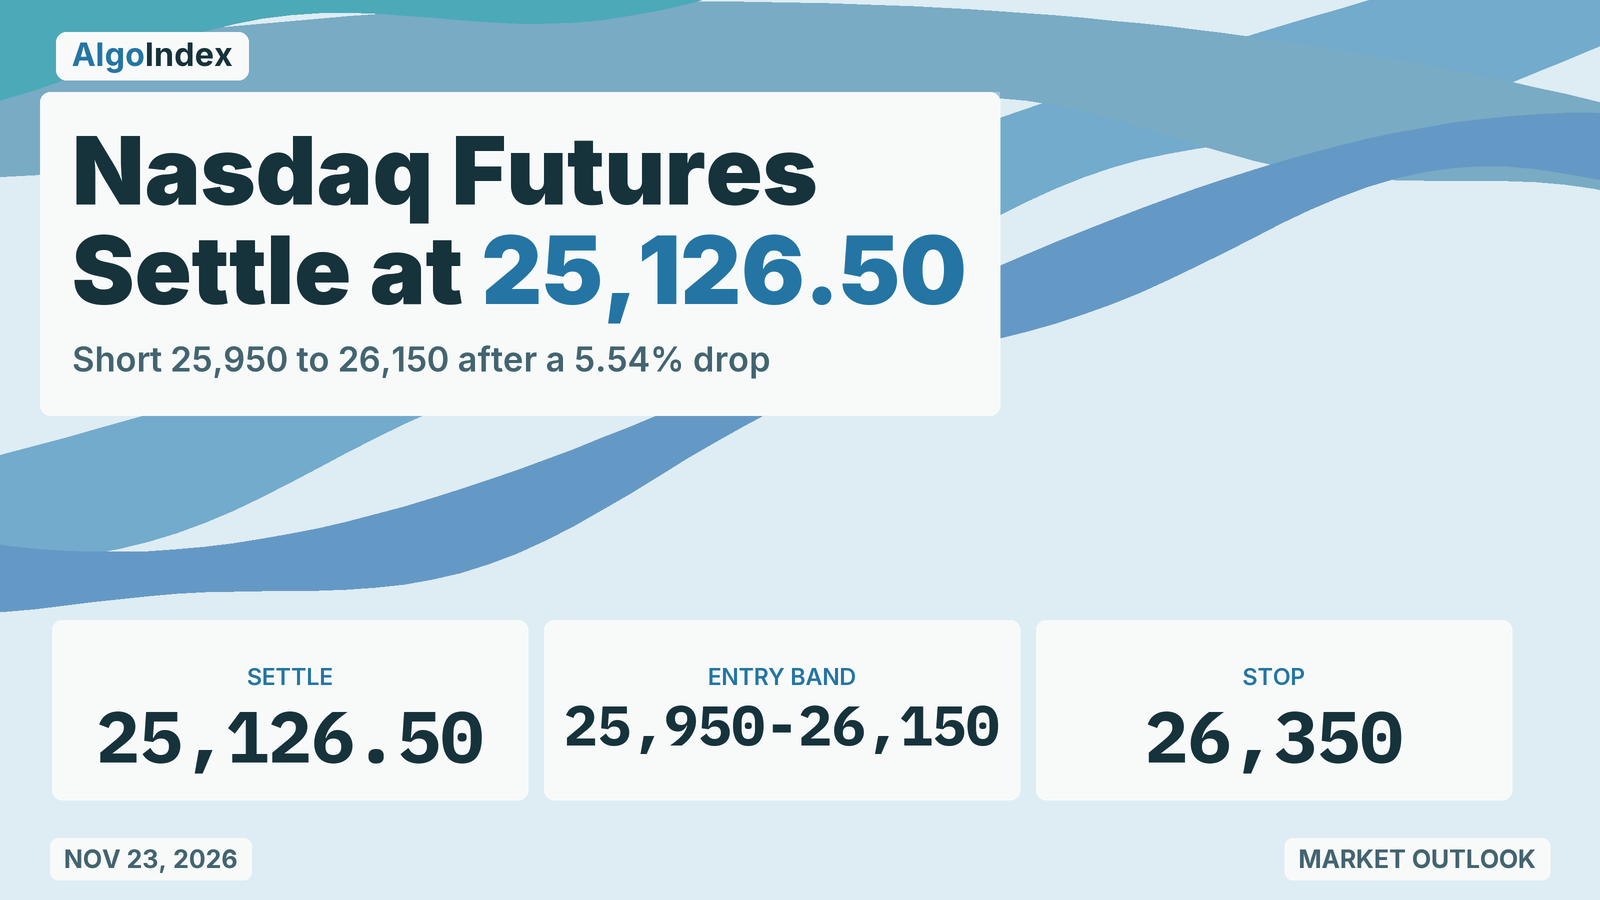
What came instead was the widest session since 11/05/26. The contract traded down to 24,976.50 and settled at 25,126.50, down 1,473.75 or 5.54 percent, in the lower tenth of a 1,627.00 point range. It was the lowest settle since 04/07/26, and the contract is down 10.37 percent over five sessions.
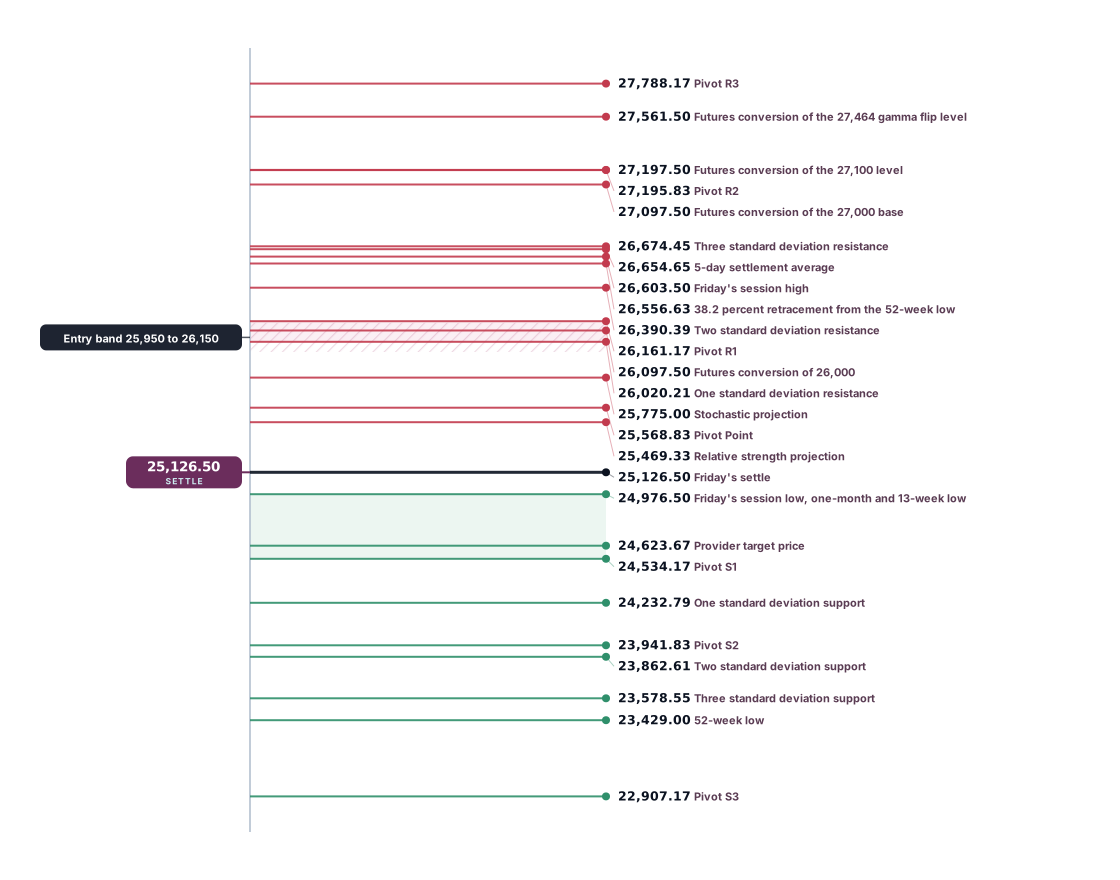
Monday's plan is again a short on a rebound, this time from 25,950 to 26,150, around one standard deviation resistance at 26,020.21 and the 26,097.50 futures conversion of the 26,000 key level, with the stop at 26,350 above Pivot R1 at 26,161.17. Two days of weekend headlines on a leading AI chipmaker and on the US and Iran sit between Friday's settle and the 6:00 PM ET Sunday reopen.
AT A GLANCE
- December settle 25,126.50, down 1,473.75 or 5.54 percent; range 26,603.50 to 24,976.50, a lower high and a lower low against Thursday.
- Friday's card: the 26,950 to 27,000 short never traded; the 26,603.50 high stopped 346.50 points short of the band.
- Monday's setup: short 25,950 to 26,150, stop 26,350, objectives 25,750, 25,450 and an extended 25,150.
- Thesis negated on a settle above Friday's 26,603.50 high; two consecutive 30-minute closes above 26,150, with the stop untouched, remove the edge.
- Settle sits beneath every settlement average, from the 5-day at 26,654.65 to the 200-day at 28,548.39.
- Calendar: US flash purchasing manager surveys 9:45 AM ET Monday, news-feed calendar, unconfirmed; a technology results call 4:30 PM ET Tuesday; Thanksgiving closes US markets Thursday.
How Friday traded: a high at the reopen and a low into the final half hour
The December contract reopened at 26,600.00 on Thursday evening, 0.25 beneath Thursday's 26,600.25 settle, and the first bar printed the session high at 26,603.50. From there it eased through the overnight and London hours. The 4:30 AM ET bar closed at 26,161.25, the 8:30 AM ET bar printed 26,000.00 before closing at 26,188.50, and the 9:00 AM ET bar closed at 26,322.75.
The cash open brought a brief recovery. The 9:30 AM ET bar traded between 26,116.75 and 26,451.25 and closed at 26,432.00, and the 10:00 AM ET bar reached 26,504.25. That same bar then fell 388.00, from 26,437.50 to 26,049.50, the largest decline of any bar in the session, and the contract set lower lows in each bar through the 1:00 PM ET bar, which reached 25,493.25.
The 1:30 PM ET bar rebounded to 25,762.50 and closed at 25,621.50. The 2:00 PM ET bar then fell 296.25, from 25,621.00 to 25,324.75, and coincided with a news-feed report at 2:09 PM ET, citing sources, that the securities regulator's probe into a leading AI chipmaker is exploring potential accounting issues. The report is unconfirmed, and the timing is coincident; it is not established as the cause.
The 3:30 PM ET bar printed the 24,976.50 low and closed at 25,133.75, and the settlement came at 25,126.50 at 4:00 PM ET. After the settle the 4:00 PM ET bar closed at 25,274.75 and the 4:30 PM ET bar at 25,291.00, 164.50 above the settle.
Settlements over the last eight sessions read 28,473.25, 28,384.50, 28,034.75, 27,284.25, 27,075.50, 27,186.75, 26,600.25 and 25,126.50, with Wednesday's 27,186.75 the only higher settle in that run. Highs over the last six sessions read 28,607.75 on 11/13/26, 28,279.25 on 11/16/26, 27,498.00 on 11/17/26, 27,609.75 on 11/18/26, 27,838.00 on 11/19/26 and 26,603.50 on Friday, and lows read 27,695.25, 27,234.75, 26,658.50, 26,921.75, 26,435.75 and 24,976.50.
Friday's high sat 1,234.50 beneath Thursday's 27,838.00 and its low 1,459.25 beneath Thursday's 26,435.75. The 24,976.50 low is the lowest since the 24,423.25 low of 04/07/26, and the 25,126.50 settle the lowest since the 24,809.25 settle of that day. A session that set its high at the reopen and settled in the lower tenth of its range extends the decline rather than marking a low, in this outlook's reading.
A chipmaker report, a weaker technology group and lower yields that did not help
The selling concentrated in the AI and semiconductor complex. Besides the 2:09 PM ET report, the news feed carried a press report at 3:34 PM ET that the chipmaker's server suppliers halted deliveries in Southeast Asia, also unconfirmed. Provider commentary said the chipmaker fell more than 14 percent and a newly listed AI developer closed down more than 8 percent, which is attributed commentary and was not recomputed. One market note put the semiconductor group down 11 percent and the Nasdaq-100 tracking fund down 6 percent, again the source's figures.
The Nasdaq-100 cash index closed at 25,028.98, down 1,488.07 or 5.61 percent, against the S&P 500 cash index's 3.70 percent decline, and provider commentary put the Dow's decline at 1.93 percent. The cash close is the lowest of the 30 sessions in the provider's preserved cash record since 10/12/26; that record does not reach far enough back for a longer comparison.
Earlier, between 1:15 PM ET and 1:21 PM ET, the feed carried the US president saying the US is working on a deal with China on chip exports, and at 4:21 PM ET a database software company saying a large AI customer contract is fully funded. Fed Governor Cook said at 1:03 PM ET that the Fed is cautious about how the AI build-out is being financed.
Rates moved the other way. The ten-year yield index closed at 4.91, down 0.14 and its lowest close since 11/09/26, and the dollar index closed at 103.84, down 0.05. Lower yields usually help duration-sensitive technology shares; on Friday they did not, which, in this outlook's interpretation, is consistent with the AI-specific reports rather than rates as the driver. The volatility index rose 7.45 points to 35.89, its highest close of the 30 sessions in the preserved record since 10/12/26, and December gold fell 4.62 percent while January crude rose 0.97 to 83.41, consistent with deleveraging that reached beyond technology.
Before the 4:00 PM ET settle the feed carried a 3:07 PM ET maritime security report of a tanker struck on an outbound transit of the Strait of Hormuz, a 3:22 PM ET press report that the US president is considering new Iran strikes and a 3:47 PM ET remark that the US is being patient, all unconfirmed. After the settle, between 4:35 PM ET and 4:48 PM ET, Iran's foreign minister said Tehran still has hope in diplomacy and that a two-day Hormuz plan remains on the table.
What the positioning data show
The dealer-positioning dataset's Nasdaq-100 column, from the edition dated Friday at 5:10 PM ET, uses 26,517, Thursday's 26,517.05 cash close, as its reference. It places the largest gamma concentration and the primary put side support base together at 27,000, the primary call side ceiling at 27,700, the volatility inflection level at 27,100 and the dealer gamma flip level at 27,464, with key strikes at 27,000, 28,000, 27,500 and 26,000, a gamma tilt of 0.612 and a 25-delta risk reversal of minus 0.093.
Friday's 25,028.98 cash close sits 1,971.02 beneath the 27,000 base, 2,071.02 beneath the 27,100 level and 2,435.02 beneath the flip level. With the basis at 97.52, the December settle less the cash close, the 26,000 key level converts to about 26,097.50 in futures, the 27,000 base to about 27,097.50, the 27,100 level to about 27,197.50 and the flip level to about 27,561.50. Those conversions are this outlook's; the modeled levels are model outputs, not option strikes, and they move as positioning changes.
The Nasdaq-100 tracking fund's positioning, read at 5:57 PM ET in fund terms, places the largest gamma concentration and the primary put side support base together at 650, the primary call side ceiling at 720 and a secondary level at 670, with a negative hedge estimate, an implied volatility rank of 97.01 percent and a skew rank of 32.80 percent. Thursday's close was 645.1; the page's current price field read 613.72, a quote that is not used as a close, and one market note puts Friday's close at 609. A cash close nearly 2,000 points beneath the 27,000 base, with a negative hedge estimate on the fund, describes conditions where hedging may add to moves in either direction until price recovers the 26,000 key level.
The weekly positioning report for the week to Tuesday, November 17, 2026, shows leveraged funds at 53,394 long, down 5,327, against 64,322 short, up 19,568, and asset managers at 112,461 long against 29,561 short, as listed. December volume was 1,360,015 contracts on Friday against 1,002,226 on Thursday.
The trade map for Monday
The setup is a short from 25,950 to 26,150, around one standard deviation resistance at 26,020.21 and the 26,097.50 conversion of the 26,000 key level, beneath Pivot R1 at 26,161.17. The stop is 26,350, above Pivot R1 and beneath two standard deviation resistance at 26,390.39. Objectives are 25,750, beneath the 25,775.00 stochastic projection, then 25,450 beneath the 25,469.33 relative strength projection, and an extended 25,150 above Friday's 25,126.50 settle.
Measured from the 26,050 midpoint of the band, the risk to the stop is 300.00 points and the three objectives sit 300.00, 600.00 and 900.00 points away, or 1.00R, 2.00R and 3.00R. The 14-day average true range is 916.21 points against that 300 point stop distance.
A settle above Friday's 26,603.50 high negates the thesis. Short of that, and only while the 26,350 stop has not traded, two consecutive 30-minute closes above 26,150 remove the edge. A bar that trades through 26,350 before it closes stops the trade first, so the two closes cannot be counted on to arrive before the stop.
A 9-day relative strength of 22.37 and a 9-day raw stochastic of 8.89 percent say the decline is stretched, and weekend headlines can open the contract well away from Friday's settle. That is why the plan waits for a rebound into the band rather than selling the low. A weekend de-escalation between the US and Iran, a resolution of the chipmaker reports or a recovery in semiconductor shares could lift the contract through 26,350; two standard deviation resistance at 26,390.39, 40.39 beyond the stop, would then be the reference. The setup is an analyst judgment that rebounds are sold, not a measured edge.
How Monday could unfold
Night Session (6:00 PM ET Sunday to 3:00 AM ET Monday)
Globex reopens at 6:00 PM ET on Sunday, November 22, 2026, after two days of headline exposure. Australian flash purchasing manager surveys are listed for 5:00 PM ET Sunday by the news-feed calendar, unconfirmed. A reopen above the Pivot Point at 25,568.83 would put one standard deviation resistance at 26,020.21 in view; a reopen beneath Friday's 24,976.50 low would put the 24,623.67 target price and Pivot S1 at 24,534.17 in view. If the weekend passes without a new escalation, the overnight session is likely to hold between 24,850 and 25,600.
London Session (3:00 AM to 8:00 AM ET Monday)
French flash surveys are listed for 3:15 AM ET, German for 3:30 AM ET, euro area for 4:00 AM ET and UK for 4:30 AM ET, by the news-feed calendar, unconfirmed. Bias lower beneath the Pivot Point at 25,568.83, roughly 24,800 to 25,650.
Morning Session (9:30 AM to 12:00 PM ET Monday)
The cash open at 9:30 AM ET is the first directional test, and the US flash surveys are listed by the news-feed calendar for 9:45 AM ET with a services forecast of 55.7 against a prior 56.1 and a manufacturing forecast of 54.5 against a prior 54.9, unconfirmed. A rebound into the 25,950 to 26,150 band beneath Pivot R1 at 26,161.17 is the test the setup needs, roughly 24,700 to 26,150.
Afternoon Session (12:00 PM to 4:00 PM ET Monday)
The two-year note auction is listed by the news-feed calendar for 1:00 PM ET, unconfirmed. Roughly 24,600 to 25,800, with the Pivot Point at 25,568.83 the reference into the 4:00 PM ET settlement.
Night Session Forward (6:00 PM ET Monday)
New York Fed President Williams is listed by the news-feed calendar to speak at 4:00 PM ET Monday, unconfirmed. Dell Technologies' results call is scheduled for 4:30 PM ET on Tuesday, November 24, 2026, per the verified forward calendar. The personal income and outlays report is scheduled for 8:30 AM ET on Wednesday, November 25, 2026, per the verified forward calendar. The Thanksgiving holiday closes US markets on Thursday, November 26, 2026, per the verified forward calendar. Equity futures settle at 1:00 PM ET on Friday, November 27, 2026. The FOMC statement is scheduled for 2:00 PM ET on Wednesday, December 9, 2026.
The most likely path reopens near the 25,126.50 settle, attempts a rebound toward 25,950 to 26,150 after the 9:45 AM ET surveys and fails beneath Pivot R1 at 26,161.17, then trades back toward Friday's 24,976.50 low. A test of the 24,623.67 target price is more likely than a run to Pivot S2 at 23,941.83. The alternative is a settle above Friday's 26,603.50 high, which could bring the 26,654.65 5-day average and the 27,097.50 conversion of the 27,000 base back into play. A weekend escalation could instead gap the contract beneath 24,976.50 toward Pivot S1 at 24,534.17 and one standard deviation support at 24,232.79 before the setup triggers, with a deeper correction toward the 23,429.00 52-week low as the worst-case scenario.
The complete data picture
Every level, average, oscillator and range figure from the review is carried below: charts first, then the full numeric reference.
Full numeric reference
Price and range
| Item | Value |
|---|---|
| Friday session (open, high, low, settle) | 26,600.00, 26,603.50, 24,976.50, 25,126.50 |
| Change from Thursday's 26,600.25 settle | -1,473.75, -5.54 percent |
| Settle versus low and high | 150.00 above the low, 1,477.00 beneath the high |
| Versus Thursday | high 1,234.50 beneath 27,838.00, low 1,459.25 beneath 26,435.75 |
| Daily ranges since 11/09/26 | 1,378.00, 593.00, 849.25, 638.50, 912.50, 1,044.50, 839.50, 688.00, 1,402.25, 1,627.00 |
| Previous wider range | 2,098.50 on 11/05/26 |
| Five-session change | -2,908.25 from the 28,034.75 settle of 11/13/26, -10.37 percent |
| Versus the 28,473.25 settle of 11/11/26 | 3,346.75 beneath |
| 52-week and 13-week high, one-month high | 31,616.50, 30,178.00 |
| 52-week low | 23,429.00 |
| Settle versus the 26,556.63 retracement | 1,430.13 beneath |
| Pivot check | (27,788.17 minus 22,907.17) / 3 and (27,195.83 minus 23,941.83) / 2 both return 1,627.00; high plus low 51,580.00; Pivot Point 25,568.8333 at full precision |
| Basis (December settle less cash close) | 97.52 |
Moving averages
| Average | Value | Settle versus average | Run |
|---|---|---|---|
| 5-day | 26,654.65 (27,236.30 Thursday) | 1,528.15 beneath | sixth settle beneath; last above 11/12/26 |
| 9-day | 27,333.44 (27,654.33 Thursday) | 2,206.94 beneath | fifth beneath; last above 11/13/26 |
| 20-day | 28,008.88 | 2,882.38 beneath | twenty-eighth beneath; last above 10/13/26 |
| 50-day | 29,421.58 | 4,295.08 beneath | twenty-eighth beneath; last above 10/13/26 |
| 100-day | 29,517.87 | 4,391.37 beneath | seventeenth beneath; last above 10/28/26 |
| 200-day | 28,548.39 | 3,421.89 beneath | twelfth beneath; last above 11/04/26 |
Older settlements in each window explain the stack order: the four older settlements in the 9-day window averaged 28,181.94, the 11 older in the 20-day window 28,561.50, the 30 older in the 50-day window 30,363.38, the 50 older in the 100-day window 29,614.16 and the 100 older in the 200-day window 27,578.92. The series holds 260 completed sessions from 11/11/25 through Friday.
Oscillators, trend and volatility
| Reading | 9-day | 14-day | 20-day |
|---|---|---|---|
| Relative strength | 22.37 | 27.01 | 30.35 |
| Raw stochastic | 8.89 percent | 8.28 percent | n/a |
| Stochastic %K / %D | n/a | 15.47 / 19.91 percent | n/a |
| ADX (+DI / -DI) | 32.48 (9.50 / 39.02) | 28.53 (11.29 / 35.44) | n/a |
| Historic volatility | 29.08 percent | 40.84 percent | n/a |
| Average true range | 1,007.57 | 916.21 | 838.09 |
| Average daily range | 954.19 | 1,063.38 | 947.61 |
| Composite multi-indicator read | Value |
|---|---|
| Overall (Friday) | 100 percent sell, strength maximum (top 1 percent), direction strongest (top 1 percent); trend composite sell |
| Thursday / a week ago / a month ago | 100 percent sell / 64 percent sell / 40 percent sell |
| Range frame | Low | High |
|---|---|---|
| Settle plus and minus the 14-day ATR of 916.21 | 24,210.29 | 26,042.71 |
| One standard deviation | 24,232.79 | 26,020.21 |
| Two standard deviations | 23,862.61 | 26,390.39 |
| Three standard deviations | 23,578.55 | 26,674.45 |
| Low-range scenario | 24,850 | 25,600 |
| Mid-range scenario, most likely | 24,210 | 26,040 |
| High-range scenario | 23,860 | 26,390 |
Cross-asset and positioning
| Item | Value |
|---|---|
| Nasdaq-100 cash close | 25,028.98, down 1,488.07 or 5.61 percent; Thursday 26,517.05 |
| S&P 500 cash / Dow (attributed) | down 3.70 percent / down 1.93 percent |
| Volatility index | up 7.45 to 35.89 |
| Ten-year yield index / dollar index | 4.91 (down 0.14) / 103.84 (down 0.05) |
| December gold / January crude | down 4.62 percent / up 0.97 to 83.41 |
| Dataset levels (index terms) | 27,000 base and largest concentration, 27,700 ceiling, 27,100 inflection, 27,464 flip; tilt 0.612; risk reversal -0.093 |
| Cash close versus dataset levels | 1,971.02 beneath 27,000; 2,071.02 beneath 27,100; 2,435.02 beneath 27,464 |
| Tracking fund (fund terms) | 650 base and largest concentration, 720 ceiling, 670 secondary; IV rank 97.01 percent; skew rank 32.80 percent; Thursday close 645.1 |
| Leveraged funds (week to 11/17/26) | 53,394 long (-5,327), 64,322 short (+19,568) |
| Asset managers | 112,461 long, 29,561 short |
| December volume | 1,360,015 Friday, 1,002,226 Thursday |
| University of Michigan final survey (Friday, news feed) | 51.5 against a 51.6 forecast |
Sources and methodology
Prices, settlements and volume come from the exchange settlement record and the daily series for the December contract (NQZ26). Session timing comes from Friday's 30-minute bars, from the Thursday 6:00 PM ET reopen through the 4:30 PM ET bar. Moving averages were computed from 260 completed daily settlements; oscillators, the composite read, the standard-deviation bands and the pivot ladder are quoted as published. Provider pages were read at 5:54 PM ET on Friday, ahead of the Sunday 6:00 PM ET reopen, and the pivot ladder effective Monday, November 23, reproduces all 7 published rungs from Friday's 26,603.50 high, 24,976.50 low and 25,126.50 settle. Positioning levels come from the dealer-positioning dataset's Nasdaq-100 column and the tracking fund's positioning page; futures conversions use the measured 97.52 basis.
The prior card, in Friday's outlook, sold the December contract into 26,950 to 27,000 with a 27,125 stop and objectives at 26,825, 26,675 and 26,525. It is graded only on its own levels across Friday's full 30-minute path; no fill is assumed beyond the band edge first traded, and an objective counts only when it traded after the band first traded. The band never traded: the session high of 26,603.50, in the 6:00 PM ET reopen bar, sat 346.50 points beneath the 26,950 edge, and no later bar came closer. With no entry, the stop and the three objectives do not count, and the card closes as not triggered, with no gain and no loss.
Every outlook is graded in public against its own levels; the running record sits on our performance statement.
Ten percent off in five sessions. Monday may show whether a rebound stalls beneath 26,161.17.