
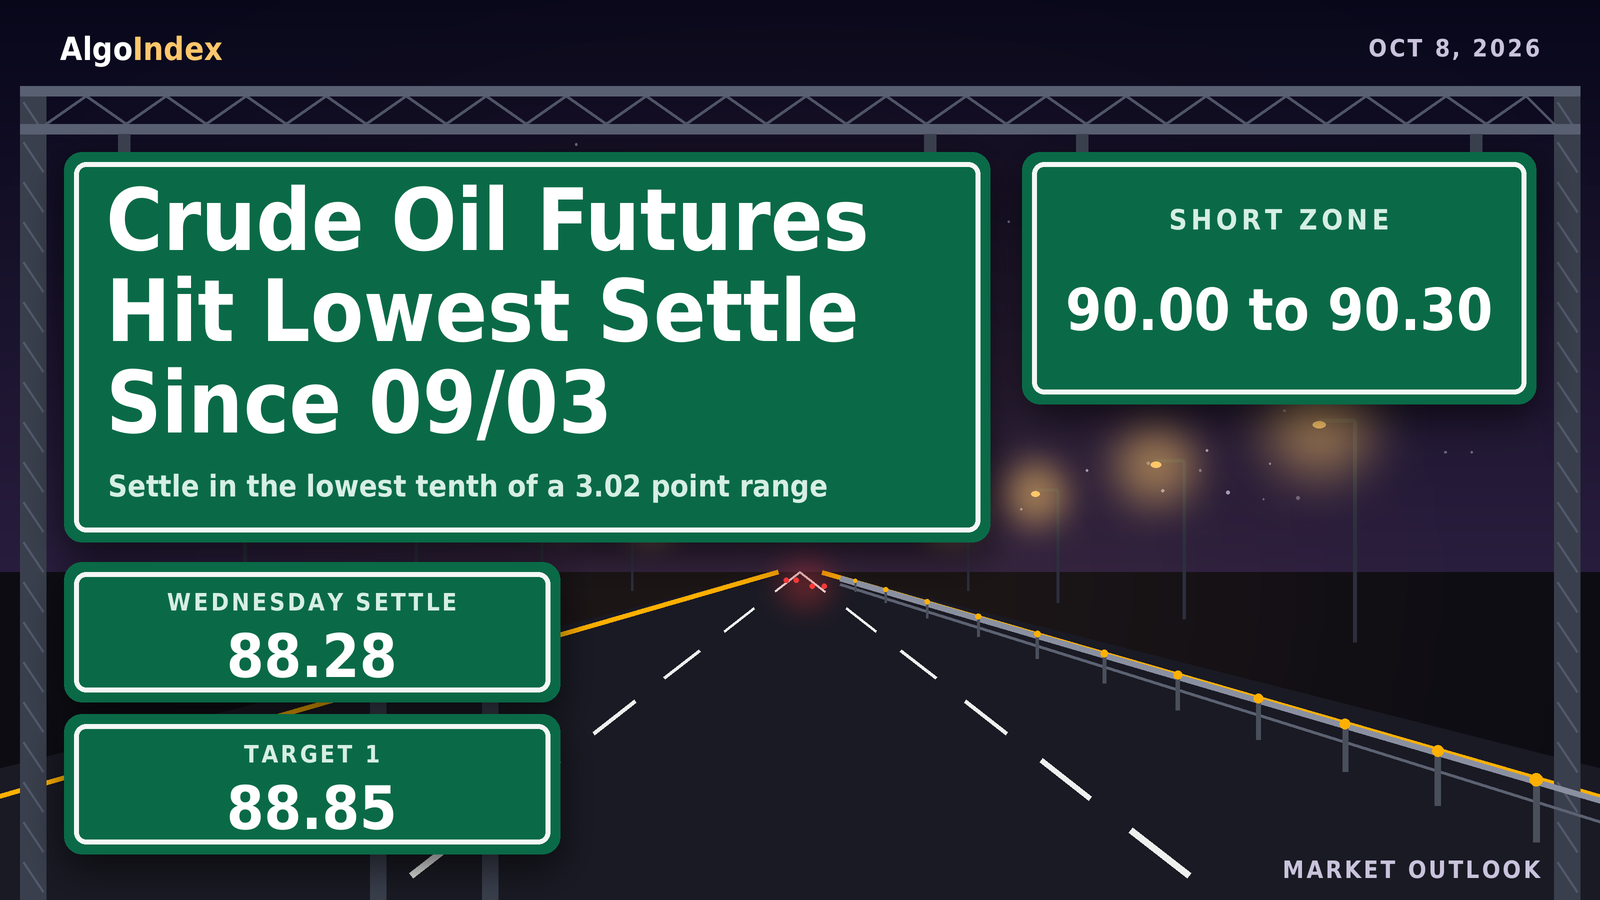
November crude printed 90.98 in the 9:30 AM ET half hour on Wednesday. Four hours later it printed 87.96. The contract settled at 88.28 at 2:30 PM ET, down 1.16 points or 1.30 percent from Tuesday’s 89.44. Volume printed 260,374 contracts on the provider’s dated daily record for Wednesday, against 265,937 on Tuesday’s revised row.
The settle finished at 10.6 percent of a 3.02 point range. That range was the narrowest since the 2.78 point range of 09/09, and 0.68 times the published 14-day average daily range of 4.43 points. Against Tuesday’s 90.05 to 86.86, Wednesday printed a higher high and a higher low. The settle was still the lowest since the 88.03 settle of 09/03. A long upper shadow. Only selected 30-minute bars were preserved, so nothing here describes the path between them.
Provider commentary said crude and gasoline erased an early rally and settled lower after the Energy Information Administration cut its 2026 global crude demand forecast. It called the weekly inventory report mixed, with domestic crude production at a record high and gasoline supplies unexpectedly higher. The same commentary tied the early strength to Iran stepping up attacks on tankers in the Strait of Hormuz. It also cited a two-week high in the crude crack spread. No price move here is tied to a specific headline. The dollar index rose 0.40 percent to 102.24, and the ten-year yield index closed one basis point higher at 5.27 percent. December Brent fell 0.38 to 100.20. Crude remains the most volatile of the four instruments covered here. Its published 14-day average true range of 4.05 points is 4.59 percent of the settle.
November WTI settled down 1.16 at 88.28, at 10.6 percent of a 90.98 to 87.96 range. Overhead sit the 89.07 Pivot Point, the 89.09 40-day crossing and stochastic threshold, the 89.66 13-week retracement and the 89.79 stall price, then one deviation resistance at 90.07, Pivot R1 at 90.19 and the 90.23 5-day average. Support starts at Wednesday’s 87.96 low, the 87.69 target price and Pivot S1 at 87.17, then Tuesday’s 86.86 one-month low. The primary setup is a short from 90.00 to 90.30, stop 91.45, targets 88.85, 87.55 and 86.25. The captured calendars carry no crude-specific release for Thursday; in our judgment tanker and Gulf storm news matter more than any scheduled item.
Wednesday’s short, graded against the bar
Wednesday’s card was a short. That outlook set it from a rally into 90.60 to 90.90, around Pivot R1 at 90.71 and one standard deviation resistance at 90.87. The stop sat at 92.10. Targets sat at 89.40, 88.05 and 86.70, with an outright invalidation on a settle above Pivot R2 at 91.97. Wednesday opened at 89.96 at the Tuesday 6:00 PM ET reopen, marked a 90.98 high and an 87.96 low, and settled at 88.28. The dated 10/07 row of the provider’s daily record carries the same four prices.
We put the entry band at 90.60 to 90.90. It traded. The 9:30 AM ET bar traded between 90.24 and 90.98, a range that spans the whole band, and its 90.98 high, the day’s high, sat eight cents above the band’s top. The 92.10 stop sat 1.12 points above that high and never traded. Whether the band also traded earlier, in the overnight hours, cannot be shown. No bars from that window were preserved.
Later bars reached two of the targets. The 10:30 AM ET bar’s low sat at 89.40, the first target, to the cent. The 87.96 low came in the 1:30 PM ET bar, nine cents through the 88.05 second target. The 86.70 third target stayed 1.26 points beneath the low. The settle came 1.12 points beneath the first target. Those are price facts from the recorded bars. The path between the bars was not preserved, and this outlook asserts no result for the card.
Neither exit clause came into play. The card defined acceptance above two deviation resistance as two consecutive 30-minute closes above 91.46. No 30-minute close could sit above 91.46 on a day whose high was 90.98, 48 cents beneath it. The outright invalidation stayed far off. The settle sat 3.69 points beneath 91.97.
The macro override named a confirmed escalation in the Strait of Hormuz that halts tanker traffic, or a weekly petroleum report with a draw far larger than the private survey’s 2.1 million barrels. Its test was a gap above the 92.10 stop. No such gap came. The Tuesday 6:00 PM ET reopen printed 89.96, 2.14 points beneath the stop. The official report showed a draw of 3.186 million barrels, 1.086 million more than the survey, per the news-feed calendar. At 6:43 AM ET the news feed carried Iran’s reiteration that the Strait stays closed until its demands are met.
The range work was mixed. The low-range case, 88.60 to 90.60, missed on both sides. The high ran 38 cents above its top, and the low 64 cents beneath its bottom. The most likely band, 87.50 to 91.00, held the whole session, with the high two cents inside its top and the low 46 cents above its bottom. The high-range case, 85.30 to 93.60, held as well.
The path call is harder to score. That outlook expected the contract to hold between the 88.78 Pivot Point and the 90.71 to 90.87 band into the 10:30 AM ET petroleum report. The 9:30 AM ET bar, before the report, reached 90.98, 11 cents above the band. A rally into the band that failed beneath Pivot R2 at 91.97 was weighted above a sustained break higher. The high stopped 99 cents short of 91.97. The settle came 50 cents beneath the old Pivot Point. The alternative, a lift through 91.97, never came.
The session bands score only in part. The morning band, 87.80 to 91.00, held the entire daily range. The afternoon band, 87.80 to 90.80, held the 87.96 low with 16 cents to spare, and both preserved afternoon bars sat inside it. Globex at 88.60 to 90.60 and London at 88.40 to 90.80 cannot be scored beyond the 89.96 reopen print. No bars from those windows survive.
A higher high, the lowest settle since 09/03
Wednesday opened at 89.96 at the Tuesday 6:00 PM ET reopen, 52 cents above Tuesday’s settle. It marked a daily high of 90.98 and a daily low of 87.96, and settled at 88.28 at 2:30 PM ET. The chart’s 30-minute bars, recorded when the data were read, place the high inside the 9:30 AM ET bar, which traded from 90.24 to 90.98. They place the low inside the 1:30 PM ET bar, which traded from 87.96 to 88.40. Only selected bars survive. No claim is made about the path between them.
Five regular-hours bars were kept. Beyond the two that hold the extremes, the 10:00 AM ET bar traded 89.76 to 90.27, the 10:30 AM ET bar 89.40 to 89.91 and the 2:00 PM ET bar 88.13 to 88.58. After the settle, the 3:30 PM ET bar traded between 88.71 and 89.11 and the 4:30 PM ET bar between 88.87 and 89.26. Those quotes are not used as the settlement anywhere here. Thursday’s session reopened at 6:00 PM ET Wednesday. The provider’s day open, high and low of 89.00, 89.06 and 88.80, shown when the data were read, belong to that new session.
The extremes are the completed-session inputs behind the published pivot ladder, back-solved from its outer pairs. Pivot R3 at 93.21 minus Pivot S3 at 84.15, divided by three, returns 3.02. So does 92.09 less 86.05, halved. Three times the 89.07 Pivot Point less the 88.28 settle gives a 178.93 high-plus-low sum. That is one cent from the 178.94 of the solved pair, because the published pivot is rounded. The pair of 90.98 and 87.96 reproduces all seven rungs. The settlement row and the chart’s completed Wednesday bar carry the same high and low.
Both extremes sit above Tuesday’s. The 90.98 high sits 93 cents above Tuesday’s 90.05, and the 87.96 low 1.10 points above Tuesday’s 86.86. Session highs over the last six sessions read 91.96, 93.68, 93.51, 91.88, 90.05 and 90.98. The lows read 88.58, 88.79, 87.89, 88.74, 86.86 and 87.96. Settlements ran 90.42, 92.87, 91.11, 89.43, 89.44 and 88.28. A settle in the lowest tenth of the range leaves a long upper shadow on the daily bar.
The prior week, September 28 through October 2, spanned 96.54 to 87.89. Wednesday’s range sits inside it. The 52-week, 13-week and one-month high of 101.69, dated 09/15/26, sits 13.41 points above the settle. The one-month low of 86.86, dated 10/06/26, sits 1.42 points beneath it. No prior-quarter high or low was captured, so the 13-week extremes stand in: 101.69 above and 70.19, dated 07/10/26, beneath.
Ranges keep shrinking. Daily ranges for the last eight sessions ran 5.29, 5.96, 3.38, 4.89, 5.62, 3.14, 3.19 and 3.02. The three most recent are the three narrowest of the group. Settles fell in three of the last four sessions, from 92.87 on 10/01 to 88.28 on Wednesday.
The retracement grid published for Thursday places the 38.2 percent retracement from the 13-week high at 89.66. That is 1.38 points above the settle. The 50 percent retracement of the 13-week range sits at 85.94. Above the settle, the 38.2 percent retracement from the four-week low sits at 92.53, the 50 percent retracement of the four-week range at 94.28 and the 38.2 percent retracement from the four-week high at 96.02. No four-hour series was captured. Swing structure here rests on daily bars only.
Averages come from the provider’s daily settlement series for the November contract, 259 completed sessions through Wednesday. The 5-day stands at 90.23, the 9-day at 90.66, the 20-day at 93.43, the 50-day at 86.49, the 100-day at 81.94 and the 200-day at 75.49. The settle sits 1.95 points beneath the 5-day, 2.38 beneath the 9-day and 5.15 beneath the 20-day. It sits 1.80 points above the unrounded 50-day.
Every short average fell. The 5-day dropped 43 cents from Tuesday’s 90.65 as the 09/30 settle of 90.42 left its window and 88.28 replaced it. The 9-day fell 70 cents from 91.36 as the 09/24 settle of 94.61 left. The 20-day fell 23 cents from 93.66 as the 09/09 settle of 92.87 left. The 50-day rose 26 cents from 86.23 as the 07/28 settle of 75.33 left its window. The 20-day still sits above the 50-day. The last 20 settlements averaged 93.43 against 86.49 for the full 50, so the 30 older settlements in the window averaged 81.85. The projection grid puts Thursday’s 9-day crossing at 90.44, the 18-day at 92.77 and the 40-day at 89.09.
Momentum leans soft. The oscillator figures are as published on the provider’s technical page dated for the Thursday session, read after the 6:00 PM ET reopen. That page may carry the live Globex price, so the readings are quoted as published. Relative strength reads 39.53 on the 9-day, 45.52 on the 14-day and 49.13 on the 20-day. The stochastics sit low in their ranges. The 9-day raw stochastic reads 14.67 percent and the 14-day 12.74 percent, with the 14-day %K at 15.99 percent and %D at 19.41 percent.
The directional lines sit almost level. On the 9-day the directional index reads 18.29, with positive direction at 16.34 over negative at 16.00. The 14-day reads 22.88, positive at 18.87 over negative at 15.74. Historic volatility runs 28.34 percent on the 9-day and 32.54 percent on the 14-day. The composite multi-indicator read for the Thursday session fell to 8 percent buy from 16 percent in the prior session’s snapshot. Signal strength is described as weak and direction as weakening. It read 16 percent a week ago and 88 percent a month ago. The short-horizon group averages 40 percent sell, the medium-horizon group 25 percent buy and the long-horizon group 67 percent buy. The composite trend indicator reads hold.
Volatility sets the scale. The published 14-day average true range stands at 4.05 points and the 14-day average daily range at 4.43. The 9-day figures are 4.13 and 4.19, the 20-day figures 3.90 and 4.54. Adding and subtracting the 14-day average true range from 88.28 frames Thursday between 84.23 and 92.33. The published deviation bands are narrower because they are built from five settlements. One deviation spans 86.49 to 90.07, two spans 85.75 to 90.81 and three spans 85.18 to 91.38. The bands describe settlement dispersion, not intraday reach.
A larger draw, a demand cut and a storm in the Gulf
The official numbers pulled two ways. The calendar listed the weekly petroleum status report at 10:30 AM ET on Wednesday, October 7, 2026. The news-feed calendar records a crude draw of 3.186 million barrels against a forecast build of 1.915 million and a prior build of 0.922 million. Tuesday’s private survey had shown a 2.1 million barrel draw, so the official draw was larger.
That commentary called the report mixed. It cited record domestic production and an unexpected increase in gasoline supplies. No gasoline, distillate or Cushing figure was captured on the feeds read for this session, so none is quoted. At 10:47 AM ET the news feed carried that domestic crude production rose to a record high for a second week, per the agency’s weekly data.
Demand estimates came down. Provider commentary said the agency cut its 2026 global crude demand forecast to 102.4 million barrels a day from a January forecast of 104.8 million. The same commentary said crude and gasoline erased an early rally and settled lower after that cut. Only selected bars were preserved, so no price move here is tied to a specific headline.
Stock releases kept coming. At 10:31 AM ET the news feed carried that member governments of the International Energy Agency support accelerating the oil stock releases announced in March, with about 100 million barrels still to reach the market if all pledged stocks are released. At 12:46 PM ET it carried that France will release 10 million barrels of diesel from reserves. No new statement from the producer alliance was captured. None of these figures was measured here.
Hormuz headlines ran all day. At 6:43 AM ET the news feed carried Iran’s reiteration that the Strait of Hormuz stays closed until its demands are met. At 12:06 PM ET it carried a press report of a stalemate in mediation between the United States and Iran. More came after the settle. At 3:41 PM ET a maritime security notice said a tanker was struck by multiple projectiles 51 nautical miles north of Madinat Ash Shamal in Qatar, with casualties reported. Between 4:35 PM ET and 4:37 PM ET Iran’s foreign ministry spokesperson said Iran and Oman agreed on geographical coordinates for safe transit routes through the Strait. The spokesperson said Iran’s response to United States proposals will go through intermediaries. At 4:53 PM ET the Saudi-led coalition said it retaliated against the Houthis. These are statements carried by the news feed. None was confirmed here.
A storm is shutting wells in. At 3:43 PM ET the news feed carried that 511,619 barrels a day, or 25.08 percent, of Gulf of Mexico oil production is shut in ahead of Tropical Storm Isaias. An item at 2:01 PM ET said the storm was forecast to strengthen into a Category 2 hurricane toward the northern Gulf coast. The November gasoline contract settled at 3.2342 dollars a gallon, down 0.0390 or 1.19 percent, per provider commentary. November heating oil settled at 4.6227, per the news feed at 2:31 PM ET. On the settlement arithmetic the gasoline margin, 42 gallons times the gasoline settle less the WTI settle, stands at 47.56 dollars a barrel, from 48.03 on Tuesday. The heating oil margin stands at 105.87. No refinery utilisation figure and no seasonal demand series were captured.
Rates and the dollar rose together. The dollar index closed at 102.24, up 0.41 points or 0.40 percent, after a session range of 101.90 to 102.50, per the provider’s quote. Yields climbed too. The ten-year yield index closed at 5.27 percent, up one basis point, after a session high of 5.36 percent, which provider commentary described as a 24-year high. A ten-year note auction stopped at a high yield of 5.300 percent with a bid-to-cover of 2.770, per the news-feed calendar and unconfirmed. The news feed described it as the highest auction yield since November 2000. The calendar listed the minutes of the September policy meeting at 2:00 PM ET. Provider commentary said most policymakers judged another rate increase by year-end appropriate.
Brent fell less. Its December contract settled at 100.20, down 0.38 or 0.38 percent, so its premium over November WTI widened to 11.92 from 11.14. The S&P 500 cash index closed at 7,801.77, down 0.22 percent. Gold’s December contract settled at 4,140.7, down 46.4 points or 1.11 percent.
Positioning data have not moved. The latest report on the provider’s overview is still the one as of September 29, 2026: managed money long 209,028 contracts against short 129,436, a net long of 79,592, with commercials 873,637 long against 1,016,255 short. No change in positioning is asserted for Wednesday. The overview shows open interest on the November contract at 236,274. That is Tuesday’s figure, on the dated 10/06 row, down from 248,138 on Monday’s 10/05 row. Wednesday’s open interest had not been reported. The provider lists the contract’s expiration as 10/20/26, with first notice on 10/22/26, so roll activity into December grows over the coming sessions.
One gap is deliberate. No dealer-positioning dataset was read for crude: no gamma map, no options concentration levels and no flow attribution, and none is borrowed from another instrument. The positioning inputs for crude are the weekly positioning report, the official inventory report, the Brent spread and the product margins.
The trade map for Thursday
Resistance starts within a point. The settle at 88.28 sits 79 cents beneath the Pivot Point at 89.07, the first resistance. The 40-day average crossing price sits two cents above it, at 89.09. So does the 14-3 day raw stochastic 20 percent threshold. The 38.2 percent retracement from the 13-week high at 89.66 and the 14-day stochastic %K stall price at 89.79 follow. One deviation resistance at 90.07, Pivot R1 at 90.19 and the 5-day settlement average at 90.23 form the band that anchors the setup. The 14-day relative-strength 50 percent line at 90.27 sits just above. Then come four more. The 9-day average crossing at 90.44, the 9-day settlement average at 90.66, two deviation resistance at 90.81 and Wednesday’s 90.98 high come next. Three deviation resistance at 91.38 and Pivot R2 at 92.09 follow. The 38.2 percent retracement from the four-week low at 92.53, the 18-day average crossing at 92.77, Pivot R3 at 93.21 and the 20-day settlement average at 93.43 are the extended references.
Support begins at Wednesday’s 87.96 low. The published target price of 87.69 and Pivot S1 at 87.17 come next. Tuesday’s 86.86 low, the one-month low, follows. One deviation support and the 50-day settlement average share 86.49, with the 3-10 day average crossover stall price at 86.43 beside them. Pivot S2 at 86.05, the 50 percent retracement of the 13-week range at 85.94, two deviation support at 85.75 and three deviation support at 85.18 form the next group. Pivot S3 at 84.15 and the 61.8 percent retracement from the 52-week low at 84.10 are the deeper references.
The primary setup is a short from a rally into 90.00 to 90.30, around one deviation resistance at 90.07 and Pivot R1 at 90.19. It needs a rally first. Wednesday settled in the lowest tenth of a range that reached 90.98, and beneath the 5-day, 9-day and 20-day settlement averages. The composite read fell to 8 percent buy with direction weakening. A rally into that band offers a short with a defined risk point above three deviation resistance at 91.38. In our reading, the Gulf storm shut-ins and the tanker attacks show buyers still respond to supply headlines. So the setup is an analyst judgment against live headline risk. Risk is 1.30 from the 90.15 midpoint.
The entry band sits 1.72 points above the settle. Thursday’s session reopened at 6:00 PM ET Wednesday with the 3:41 PM ET tanker notice near Qatar and the 4:37 PM ET statement on Hormuz transit coordinates with Oman already out. Bias is neutral to lower beneath the 89.07 Pivot Point. The expected Globex band is roughly 87.60 to 89.60, absent a headline shock. Gulf and Hormuz headlines are the gap risk in both directions.
Europe brings speakers. The calendar lists a Federal Reserve governor on the economic outlook at 4:30 AM ET on Thursday, October 8, 2026. The European Central Bank’s meeting account is listed at 7:30 AM ET, per the news-feed calendar and unconfirmed. Wednesday’s 3.02 point range shows that two-way swings of three points remain possible inside a single session. Bias is neutral to lower, with an expected band of roughly 87.40 to 89.80.
Weekly jobless claims are listed at 8:30 AM ET, per the news-feed calendar and unconfirmed, just before the morning window. The calendar lists wholesale inventories at 10:00 AM ET. A regional Federal Reserve president is listed at 10:40 AM ET, per the news-feed calendar and unconfirmed. Expected band roughly 87.20 to 90.20, with the 90.07 to 90.23 band the first meaningful resistance above the Pivot Point.
The afternoon tests rates again. A thirty-year bond auction is listed at 1:00 PM ET, per the news-feed calendar and unconfirmed. It follows a ten-year sale that stopped at the highest yield since November 2000, per the news feed. The same regional Federal Reserve president is listed again at 1:40 PM ET. Crude settles at 2:30 PM ET. Expected band roughly 87.20 to 89.80.
Japanese household spending is listed at 7:30 PM ET Thursday, per the news-feed calendar and unconfirmed. The University of Michigan preliminary survey, with its inflation expectations, is listed at 10:00 AM ET Friday on the same basis. The calendar lists the consumer price index for September at 8:30 AM ET on Wednesday, October 14, 2026. It lists the next weekly petroleum status report at 12:00 PM ET on Thursday, October 15, 2026, delayed one day by the Columbus Day holiday. The captured calendars carry no crude-specific scheduled release for Thursday and no mega-capitalisation earnings entry.
Three scenarios frame the full session. The low-range case runs 87.60 to 89.60, the mid-range case, which is the most likely, 86.90 to 90.30, and the high-range case 84.20 to 92.30. None carries a derived frequency. In our analyst judgment the most probable path holds the contract between Pivot S1 at 87.17 and the 90.07 to 90.23 resistance band. In the same judgment Hormuz and Gulf storm headlines decide the side. A rally into that band that fails beneath Wednesday’s 90.98 high is weighted above a sustained break higher. Three readings carry that weighting. Wednesday settled in the lowest tenth of its range. It settled beneath the 5-day, 9-day and 20-day settlement averages. The composite read fell to 8 percent buy with direction weakening. One alternative invalidates the reading. A confirmed halt of tanker traffic or a deeper Gulf shut-in that lifts the contract through 91.38 and toward Pivot R2 at 92.09 would do it.
In our judgment the first-order influence on crude on Thursday is unscheduled. It is whether the Iran and Oman transit-route statement turns into tanker traffic, set against the Gulf storm shut-ins.
Wednesday’s high cleared the last entry band by eight cents. Thursday’s band sits 60 cents lower.
The complete data picture
Every number behind Thursday’s plan, charted first, then the full level lists, then the complete numeric reference underneath.
Full numeric reference, every remaining figure from the session review
Carried below in the review’s own order: the level notes from sections 3.1 and 3.2, the executive summary from section 1, sections 2.1 to 2.6, sections 4.1 to 4.6, the coverage note from section 5, the session-by-session forecast from section 6, the Thursday calendar from section 7 and the primary setup from section 8.
3.1 Resistance and 3.2 Support, level notes
The settle at 88.28 sits 79 cents beneath the Pivot Point at 89.07, which is the first resistance, with the 40-day average crossing price and the 14-3 day raw stochastic 20 percent threshold both at 89.09 alongside it. The 38.2 percent retracement from the 13-week high at 89.66 and the 14-day stochastic %K stall price at 89.79 follow. One standard deviation resistance at 90.07, Pivot R1 at 90.19 and the 5-day settlement average at 90.23 form the band that anchors the setup, with the 14-day relative-strength 50 percent line at 90.27 just above.
The 9-day average crossing price at 90.44, the 9-day settlement average at 90.66, two standard deviations resistance at 90.81 and Wednesday’s 90.98 high come next, then three standard deviations resistance at 91.38 and Pivot R2 at 92.09. The 38.2 percent retracement from the four-week low at 92.53, the 18-day average crossing at 92.77, Pivot R3 at 93.21 and the 20-day settlement average at 93.43 are the extended references.
Beneath the settle, Wednesday’s 87.96 low comes first, then the published target price of 87.69 and Pivot S1 at 87.17. Tuesday’s 86.86 low, the one-month low, sits next, followed by one standard deviation support at 86.49, the 50-day settlement average at 86.49 and the 3-10 day average crossover stall price at 86.43. Pivot S2 at 86.05, the 50 percent retracement of the 13-week range at 85.94, two standard deviations support at 85.75 and three standard deviations support at 85.18 form the next group. Pivot S3 at 84.15 and the 61.8 percent retracement from the 52-week low at 84.10 are the deeper references.
1. Executive Summary
The November crude contract settled at 88.28 on Wednesday, down 1.16 points or 1.30 percent from Tuesday’s 2:30 PM ET settle of 89.44, after trading between 90.98 and 87.96, a 3.02 point daily range. The settle finished at 10.6 percent of the range, and the 3.02 point range was 0.68 times the published 14-day average daily range of 4.43 points. Wednesday printed a higher high and a higher low against Tuesday, yet the settle was the lowest since the 88.03 settle of 09/03, and the 3.02 point range was the narrowest since the 2.78 point range of 09/09.
Provider commentary said crude and gasoline erased an early rally and settled lower after the Energy Information Administration cut its 2026 global crude demand forecast, and that the weekly inventory report was mixed, with domestic crude production at a record high and gasoline supplies unexpectedly higher. The same commentary attributed the early strength to Iran stepping up attacks on tankers in the Strait of Hormuz and to a two-week high in the crude crack spread. No intraday series was preserved in full, so no price move here is tied to a specific headline.
The weekly petroleum status report at 10:30 AM ET on Wednesday, October 7, 2026, on the calendar, showed a crude draw of 3.186 million barrels against a forecast build of 1.915 million, per the news-feed calendar. Brent’s December contract settled at 100.20, down 0.38, so Brent’s premium over November WTI widened to 11.92 from 11.14. The dollar index rose 0.40 percent to 102.24, and the ten-year yield index closed one basis point higher at 5.27 percent after a session high of 5.36 percent, which provider commentary described as a 24-year high.
Crude remains the most volatile of the four instruments covered here; the published 14-day average true range of 4.05 points is 4.59 percent of the settle. The Primary Setup below is a short from the 90.00 to 90.30 band, around Pivot R1 at 90.19 and one standard deviation resistance at 90.07, stopped at 91.45 above three standard deviations resistance at 91.38, with objectives at 88.85, 87.55 and an extended 86.25.
2.1 Intraday and Session Review
The Wednesday session opened at 89.96 at the Tuesday 6:00 PM ET reopen, 52 cents above Tuesday’s settle, marked a daily high of 90.98 and a daily low of 87.96, and settled at 88.28 at 2:30 PM ET. The chart’s 30-minute bars, recorded when the data were read, place the 90.98 high inside the 9:30 AM ET bar, which traded from 90.24 to 90.98, and the 87.96 low inside the 1:30 PM ET bar, which traded from 87.96 to 88.40. Only selected 30-minute bars were preserved, not a complete intraday series, so this outlook makes no claim about the path between those bars.
After the settle, the chart’s 3:30 PM ET bar traded between 88.71 and 89.11 and the 4:30 PM ET bar between 88.87 and 89.26; those post-settlement quotes are not used as the settlement anywhere here. The Thursday session reopened at 6:00 PM ET Wednesday; the provider’s day open, high and low of 89.00, 89.06 and 88.80 shown when the data were read belong to that new session, not to Wednesday.
The session extremes used here are the completed-session inputs behind the published pivot ladder, back-solved from the outer pivot pairs and verified against every rung. The third resistance point at 93.21 minus the third support point at 84.15, divided by three, returns 3.02, and the second resistance point at 92.09 minus the second support point at 86.05, divided by two, returns the same 3.02. Three times the Pivot Point of 89.07 less the 88.28 settle gives a high plus low sum of 178.93, one cent from the 178.94 of the solved pair because the published pivot is rounded, and the pair of 90.98 and 87.96 reproduces all seven published rungs. Independent corroboration: the provider’s settlement row and the chart’s completed Wednesday daily bar carry the same 90.98 high and 87.96 low.
2.2 Daily Structure
Wednesday printed a higher high and a higher low against Tuesday: the 90.98 high sits 93 cents above Tuesday’s 90.05, and the 87.96 low sits 1.10 points above Tuesday’s 86.86. The settle in the lowest tenth of the range leaves a long upper shadow on the daily bar. The sequence of session highs over the last six sessions reads 91.96, 93.68, 93.51, 91.88, 90.05 and 90.98, and the sequence of session lows reads 88.58, 88.79, 87.89, 88.74, 86.86 and 87.96.
The prior week, September 28 through October 2, spanned 96.54 to 87.89, and Wednesday’s range sits inside it. The 52-week, 13-week and one-month high of 101.69, dated 09/15/26, sits 13.41 points above the settle, and the one-month low of 86.86, dated 10/06/26, sits 1.42 points beneath it. Settlements over the last six sessions ran 90.42, 92.87, 91.11, 89.43, 89.44 and 88.28.
No prior-quarter high or low was captured, so the 13-week extremes serve as the available quarterly reference: 101.69 above and 70.19, dated 07/10/26, beneath.
2.3 4-Hour and Swing Structure
Daily ranges for the last eight sessions ran 5.29, 5.96, 3.38, 4.89, 5.62, 3.14, 3.19 and 3.02, so the three most recent sessions are the three narrowest of that group. The settlement sequence has made lower settles in three of the last four sessions, from 92.87 on 10/01 to 88.28 on Wednesday.
The retracement grid published for Thursday places the 38.2 percent retracement from the 13-week high at 89.66, 1.38 points above the settle, and the 50 percent retracement of the 13-week range at 85.94. Above the settle, the 38.2 percent retracement from the four-week low sits at 92.53, the 50 percent retracement of the four-week range at 94.28 and the 38.2 percent retracement from the four-week high at 96.02. No four-hour series was captured, so swing structure here rests on daily bars only.
2.4 Moving Averages
The averages cited in this subsection were computed from the provider’s daily settlement series for the November contract, which holds 259 completed sessions through Wednesday. The 5-day average stands at 90.23, the 9-day at 90.66, the 20-day at 93.43, the 50-day at 86.49, the 100-day at 81.94 and the 200-day at 75.49.
The 88.28 settle sits 1.95 points beneath the 5-day average, 2.38 points beneath the 9-day and 5.15 points beneath the 20-day, and 1.80 points above the 50-day. The 5-day average fell 43 cents from Tuesday’s 90.65, because the 09/30 settle of 90.42 left the window and was replaced by 88.28. The 9-day average fell 70 cents from 91.36 as the 09/24 settle of 94.61 left its window, and the 20-day fell 23 cents from 93.66 as the 09/09 settle of 92.87 left. The 50-day average rose 26 cents from 86.23 as the 07/28 settle of 75.33 left its window.
The 20-day average sits above the 50-day because the last 20 settlements averaged 93.43 against 86.49 for the full 50, which means the 30 older settlements in the 50-day window averaged lower, at 81.85. The projection grid gives the prices at which each average would be crossed on Thursday: 90.44 for the 9-day, 92.77 for the 18-day and 89.09 for the 40-day.
2.5 Oscillator and Trend Readings
The oscillator figures below are as published on the provider’s technical page dated for the Thursday session, read after the 6:00 PM ET reopen; the page may carry the live Globex price, so they are quoted as published. The 9-day relative strength reads 39.53, the 14-day relative strength 45.52 and the 20-day relative strength 49.13.
The stochastics sit low in their ranges. The 9-day raw stochastic reads 14.67 percent and the 14-day raw stochastic 12.74 percent, while the 14-day stochastic %K reads 15.99 percent and the 14-day stochastic %D 19.41 percent.
The 9-day directional index reads 18.29 with the 9-day positive direction at 16.34 and the 9-day negative direction at 16.00, so the two directional lines sit almost level on the 9-day; the 14-day directional index reads 22.88 with positive direction at 18.87 and negative direction at 15.74. The 9-day historic volatility reads 28.34 percent and the 14-day historic volatility 32.54 percent.
The composite multi-indicator read published for the Thursday session is 8 percent buy, down from 16 percent buy in the prior session’s snapshot, with signal strength described as weak and direction as weakening. The snapshot history reads 16 percent buy a week ago and 88 percent buy a month ago. The short-horizon group averages 40 percent sell, the medium-horizon group 25 percent buy and the long-horizon group 67 percent buy, and the composite trend indicator reads hold.
2.6 Volatility and Expected Range
The published 14-day average true range stands at 4.05 points and the 14-day average daily range at 4.43 points; the 9-day average true range is 4.13 with a 9-day average daily range of 4.19, and the 20-day average true range is 3.90 with a 20-day average daily range of 4.54. Wednesday’s 3.02 point range was 0.68 times the 14-day average daily range.
Adding and subtracting the 14-day average true range of 4.05 points from the 88.28 settle frames Thursday between 84.23 and 92.33. The published standard-deviation bands are narrower because they are built from five settlements: one deviation spans 86.49 to 90.07, two spans 85.75 to 90.81 and three spans 85.18 to 91.38. These bands measure how settlements have dispersed, and the high and low can run beyond them.
4.1 Producer Alliance and Supply Policy (Quotas, Compliance, Saudi and Russia Signals)
No new statement from the producer alliance was captured on the feeds read for this session. The news feed carried an item at 10:31 AM ET that member governments of the International Energy Agency support accelerating the oil stock releases announced in March, with about 100 million barrels still to reach the market if all pledged stocks are released, and an item at 12:46 PM ET that France will release 10 million barrels of diesel from reserves. On the producer side, the feed carried at 10:47 AM ET that domestic crude production rose to a record high for a second week, per the agency’s weekly data. These are statements carried by the news feed, and none of the figures was measured here.
4.2 Inventory Data (Crude Stocks, Gasoline, Distillates, Cushing, Strategic Reserve)
The weekly petroleum status report was released at 10:30 AM ET on Wednesday, October 7, 2026, on the calendar. The news-feed calendar records a crude draw of 3.186 million barrels against a forecast build of 1.915 million and a prior build of 0.922 million. Provider commentary described the report as mixed, with record domestic production and an unexpected increase in gasoline supplies; no gasoline, distillate or Cushing figure was captured on the feeds read for this session, so none is quoted. Provider commentary also said the agency cut its 2026 global crude demand forecast to 102.4 million barrels a day from a January forecast of 104.8 million. Tuesday’s private survey had shown a 2.1 million barrel crude draw, so the official draw was larger than the survey’s.
4.3 Geopolitical Backdrop (Middle East, Iran, Russia and Ukraine, Venezuela)
The news feed carried at 6:43 AM ET that Iran reiterated that the Strait of Hormuz stays closed until its demands are met, and at 12:06 PM ET a press report of a stalemate in mediation between the United States and Iran. At 3:41 PM ET, after the settle, the feed carried a maritime security notice that a tanker was struck by multiple projectiles 51 nautical miles north of Madinat Ash Shamal in Qatar, with casualties reported. Between 4:35 PM ET and 4:37 PM ET Iran’s foreign ministry spokesperson said Iran and Oman agreed on geographical coordinates for safe transit routes through the Strait of Hormuz and that Iran’s response to United States proposals will go through intermediaries, and at 4:53 PM ET the Saudi-led coalition said it retaliated against the Houthis. These are statements carried by the news feed, none confirmed here, and the tanker notice and the transit-route statement both came after the 2:30 PM ET settle.
4.4 Demand and Refining (Refinery Utilisation, Crack Spreads, Seasonal Pattern)
The November gasoline contract settled at 3.2342 dollars a gallon, down 0.0390 or 1.19 percent per provider commentary, and the November heating oil contract settled at 4.6227, per the news feed at 2:31 PM ET. On the settlement arithmetic the gasoline margin, 42 gallons times the gasoline settle less the WTI settle, stands at 47.56 dollars a barrel and the heating oil margin at 105.87.
The news feed carried at 3:43 PM ET that 511,619 barrels a day, or 25.08 percent, of Gulf of Mexico oil production is shut in ahead of Tropical Storm Isaias, which was forecast to strengthen into a Category 2 hurricane toward the northern Gulf coast, per an item at 2:01 PM ET. No refinery utilisation figure and no seasonal demand series were captured, so neither is asserted.
4.5 Dollar and Cross-Asset (Dollar Index, Commodities Complex, Equity Risk Appetite)
The dollar index closed at 102.24, up 0.41 points or 0.40 percent, after a session range of 101.90 to 102.50, per the provider’s quote. The ten-year yield index closed at 5.27 percent, up one basis point, after a session high of 5.36 percent. A ten-year note auction stopped at a high yield of 5.300 percent with a bid-to-cover of 2.770, per the news-feed calendar and unconfirmed, and the news feed described it as the highest auction yield since November 2000.
The minutes of the September policy meeting were released at 2:00 PM ET on Wednesday, October 7, 2026, on the calendar, and provider commentary said most policymakers judged another rate increase by year-end appropriate. Brent’s December contract settled at 100.20, down 0.38 or 0.38 percent, so its premium over November WTI widened to 11.92 from 11.14. The S&P 500 cash index closed at 7,801.77, down 0.22 percent, and gold’s December contract settled at 4,140.7, down 46.4 points or 1.11 percent.
4.6 Institutional Positioning (Commitments Data, Money Manager and Commercial Hedger, Speculator Length)
The latest positioning report on the provider’s overview is still the one as of September 29, 2026: managed money long 209,028 contracts against short 129,436, a net long of 79,592, with commercials 873,637 long against 1,016,255 short, a net short of 142,618. The overview read for this session shows that September 29 report as its latest, so no change in positioning is asserted for Wednesday.
Open interest on the November contract is shown at 236,274, which is Tuesday’s figure on the dated 10/06 row, down from 248,138 on Monday’s 10/05 row; Wednesday’s open interest had not been reported at the time of capture, and the dated 10/07 row carries no open interest value. Wednesday’s volume was 260,374 contracts against Tuesday’s 265,937, on the dated 10/07 and 10/06 rows. The November contract expires on 10/20/26, per the provider, with first notice on 10/22/26, so roll activity into December grows over the coming sessions.
5. No liquid options proxy
Crude is covered here without a positioning dataset. There is no dealer-positioning surface read for this instrument, no gamma map, no options concentration levels and no flow attribution, and none is inferred from any other instrument. Every level in section 3 originates in published pivot arithmetic, published standard-deviation bands, published retracement and moving-average projections, settlement averages computed from the provider’s daily record, or the completed-session extremes described in section 2.1.
This is a statement about coverage, and listed crude options do exist. No such dataset was read, so no claim resting on one appears anywhere in this outlook. The positioning inputs used for crude are the weekly positioning report, the official inventory report, the Brent spread and the product margins.
Night Session (6:00 PM ET Wednesday to 3:00 AM ET Thursday, Globex and Asia)
The contract reopened at 6:00 PM ET Wednesday with the 4:37 PM ET statement on Hormuz transit coordinates with Oman and the 3:41 PM ET tanker notice near Qatar both already released. A Federal Reserve governor speaks on the economic outlook at 4:30 AM ET on Thursday, October 8, 2026, on the calendar, just after this window closes. Bias neutral to lower beneath the 89.07 Pivot Point, expected Globex band roughly 87.60 to 89.60 absent a headline shock, with Gulf and Hormuz headlines the gap risk in both directions.
London Session (3:00 AM ET to 8:00 AM ET Thursday)
The Federal Reserve governor’s outlook speech at 4:30 AM ET on Thursday, October 8, 2026, on the calendar, falls inside this window, and the European Central Bank’s meeting account is listed at 7:30 AM ET, per the news-feed calendar and unconfirmed. Wednesday’s 3.02 point range shows that two-way swings of three points remain possible inside a single session. Bias neutral to lower, expected band roughly 87.40 to 89.80.
Morning Session (9:00 AM ET to 12:00 PM ET Thursday, United States Open and Pit Session)
Weekly jobless claims are listed at 8:30 AM ET, per the news-feed calendar and unconfirmed, just before this window, and wholesale inventories follow at 10:00 AM ET on Thursday, October 8, 2026, on the calendar. A regional Federal Reserve president is listed at 10:40 AM ET, per the news-feed calendar and unconfirmed. Expected band roughly 87.20 to 90.20, with the 90.07 to 90.23 band the first meaningful resistance above the Pivot Point.
Afternoon Session (12:00 PM ET to 2:30 PM ET Thursday, NYMEX Pit Close)
A thirty-year bond auction is listed at 1:00 PM ET, per the news-feed calendar and unconfirmed, after Wednesday’s ten-year sale stopped at the highest yield since November 2000 per the news feed. The same regional Federal Reserve president is listed again at 1:40 PM ET, per the news-feed calendar and unconfirmed. Crude settles at 2:30 PM ET. Expected band roughly 87.20 to 89.80.
Night Session Forward (6:00 PM ET Thursday)
Japanese household spending is listed at 7:30 PM ET Thursday, per the news-feed calendar and unconfirmed. The University of Michigan preliminary survey with its inflation expectations is listed at 10:00 AM ET on Friday, per the news-feed calendar and unconfirmed, the next scheduled item inside the following session.
Expected Range (Thursday Full Session)
Low-range scenario: 87.60 to 89.60. Mid-range scenario (most likely): 86.90 to 90.30. High-range scenario: 84.20 to 92.30.
Most Likely Path
In our analyst judgment the most probable path holds the contract between Pivot S1 at 87.17 and the 90.07 to 90.23 resistance band, with Hormuz and Gulf storm headlines deciding the side. A rally into that band that fails beneath Wednesday’s 90.98 high is weighted above a sustained break higher, because Wednesday settled in the lowest tenth of its range and beneath the 5-day, 9-day and 20-day settlement averages, and the composite read fell to 8 percent buy with direction weakening. The alternative that would invalidate this reading is a confirmed halt of tanker traffic or a deeper Gulf shut-in that lifts the contract through 91.38 and toward Pivot R2 at 92.09.
7. Thursday Economic Calendar
The Thursday session reopened at 6:00 PM ET Wednesday. German trade data are listed at 2:00 AM ET Thursday, per the news-feed calendar and unconfirmed. A Federal Reserve governor speaks on the economic outlook at 4:30 AM ET on Thursday, October 8, 2026, on the calendar. The European Central Bank’s meeting account is listed at 7:30 AM ET and the Bank of England governor at 8:15 AM ET, both per the news-feed calendar and unconfirmed.
Weekly initial jobless claims are listed at 8:30 AM ET with a forecast of 200 thousand against 197 thousand, per the news-feed calendar and unconfirmed. Wholesale inventories are scheduled for 10:00 AM ET on Thursday, October 8, 2026, on the calendar. A regional Federal Reserve president is listed at 10:40 AM ET and again at 1:40 PM ET, and a thirty-year bond auction at 1:00 PM ET, all per the news-feed calendar and unconfirmed. Crude settles at 2:30 PM ET. The captured calendars carry no crude-specific scheduled release for Thursday and no mega-capitalisation earnings entry.
The November contract’s expiration is listed as 10/20/26 by the provider, with first notice on 10/22/26. The next weekly petroleum status report is scheduled for 12:00 PM ET on Thursday, October 15, 2026, on the calendar, delayed one day by the Columbus Day holiday, and the consumer price index for September is scheduled for 8:30 AM ET on Wednesday, October 14, 2026, on the calendar. In our judgment the first-order influence on crude on Thursday is unscheduled: whether the Iran and Oman transit-route statement translates into tanker traffic, set against the Gulf storm shut-ins.
8. Primary Trade Setup
Direction: Short
Rationale: Wednesday’s settle in the lowest tenth of a range that reached 90.98 sits beneath the 5-day, 9-day and 20-day settlement averages, and the composite read fell to 8 percent buy with direction weakening; a rally into one standard deviation resistance at 90.07 and Pivot R1 at 90.19 offers a short with a defined risk point above three standard deviations resistance at 91.38. The Gulf storm shut-ins and the tanker attacks show buyers still respond to supply headlines, so the setup is an analyst judgment against live headline risk.
Entry Zone: 90.00 to 90.30
Stop Loss: 91.45 (above three standard deviations resistance at 91.38 and Wednesday’s 90.98 high)
Target 1 (T1): 88.85 (22 cents beneath the 89.07 Pivot Point)
Target 2 (T2): 87.55 (38 cents above Pivot S1 at 87.17)
Target 3 (T3, extended): 86.25 (20 cents above Pivot S2 at 86.05)
Risk-to-Reward: Approximately 1:1 to T1, 1:2 to T2, 1:3 to T3
Invalidation: A settle above 91.38 negates the thesis. Short of that, the edge is removed by acceptance above Wednesday’s 90.98 high, defined as two consecutive 30-minute closes above 90.98.
Macro override: A confirmed halt of tanker traffic through the Strait of Hormuz, or a widening of the Gulf storm shut-ins, would restore the supply premium. In that scenario a gap above the 91.45 stop removes the short before entry, and the 92.09 to 92.77 band becomes the reference within one 14-day average true range of 4.05 points.
Sources and methodology
This outlook is built from our session review of the November NYMEX WTI crude contract, CLX26, the November ’26 month, tracked on the continuous CL1! chart and prepared after Wednesday’s close on October 7, 2026 for the Thursday, October 8, 2026 session. The contract domain was checked before any level was used: the daily chart’s completed Wednesday bar equals the provider’s settlement row, and the chart’s current Thursday bar opened at 89.00, equal to the provider’s day open, while the provider’s published previous close of 88.28 equals the settlement, so chart and levels sit on the same November contract. The Globex session reopened at 6:00 PM ET Wednesday, so the day high, day low and open on the provider’s overview page belong to the Thursday session and are not used as Wednesday’s range.
Wednesday’s session extremes are the completed-session inputs behind the published pivot ladder, back-solved from the outer pivot pairs, checked against all seven published rungs and reproduced by the chart’s daily bar and the settlement row. Only selected Wednesday 30-minute bars were preserved: 9:30 AM ET, 10:00 AM ET, 10:30 AM ET, 1:30 PM ET, 2:00 PM ET, and the post-settlement 3:30 PM ET and 4:30 PM ET bars. They place the high and the low in time; nothing is claimed about the path between them. The 5-day, 9-day, 20-day, 50-day, 100-day and 200-day averages were computed from the provider’s 259-session daily settlement series, which leaves out the partial Thursday row. Volume and open interest are quoted from the dated rows of that daily record for 10/05, 10/06 and 10/07; the 10/07 row carries volume 260,374 but no open interest value, so no Wednesday open interest is stated. The provider revised the 10/06 row after Wednesday’s outlook was written: it now reads volume 265,937 and open interest 236,274, where that outlook cited 234,969 contracts and no open interest value. This outlook uses the revised row.
Oscillator readings are cited as published. No dealer-positioning dataset was read for crude, so no gamma, dealer-positioning or options-flow claim is made. Items marked unconfirmed come from the news-feed calendar captured for this session; catalysts whose time had passed when collection began are recorded as completed. Scenario ranges are analyst judgment and carry no calibration. Wednesday’s grade uses Wednesday’s open, high, low and settle as stated in tonight’s review and the dated 10/07 row of the daily record, which agree, the selected 30-minute bars above, and the setup card as published on Wednesday’s outlook.
Not captured, and stated nowhere as a figure: a complete intraday series for Wednesday, a four-hour series, a prior-quarter high or low, gasoline, distillate and Cushing figures from the weekly report, a heating oil change on the day, a refinery utilisation figure, a seasonal demand series, Wednesday’s open interest and a positioning report newer than September 29.
Wednesday’s outlook for this contract is here, and Wednesday’s gold outlook is here. Outlooks for the equity index, technology index, gold and crude contracts are collected on the market outlook page, and our forward trading record is on the performance statement.



