Thursday's outlook planned to sell December S&P 500 futures into 7,400 to 7,410, and the band traded early. The 1:00 AM ET bar reached 7,402.50, inside the band, and the 1:30 AM ET bar was the first to trade the 7,405 midpoint. The overnight climb kept going: the 6:30 AM ET bar printed 7,440.50, 0.50 through the 7,440 stop. After the band was reached, none of the objectives at 7,370, 7,335 or 7,300 traded before the stop. On a modeled entry at the 7,405 midpoint, the card lost 35.00 points; that is a replay of the card's own levels on 30-minute bars, not a reported fill.
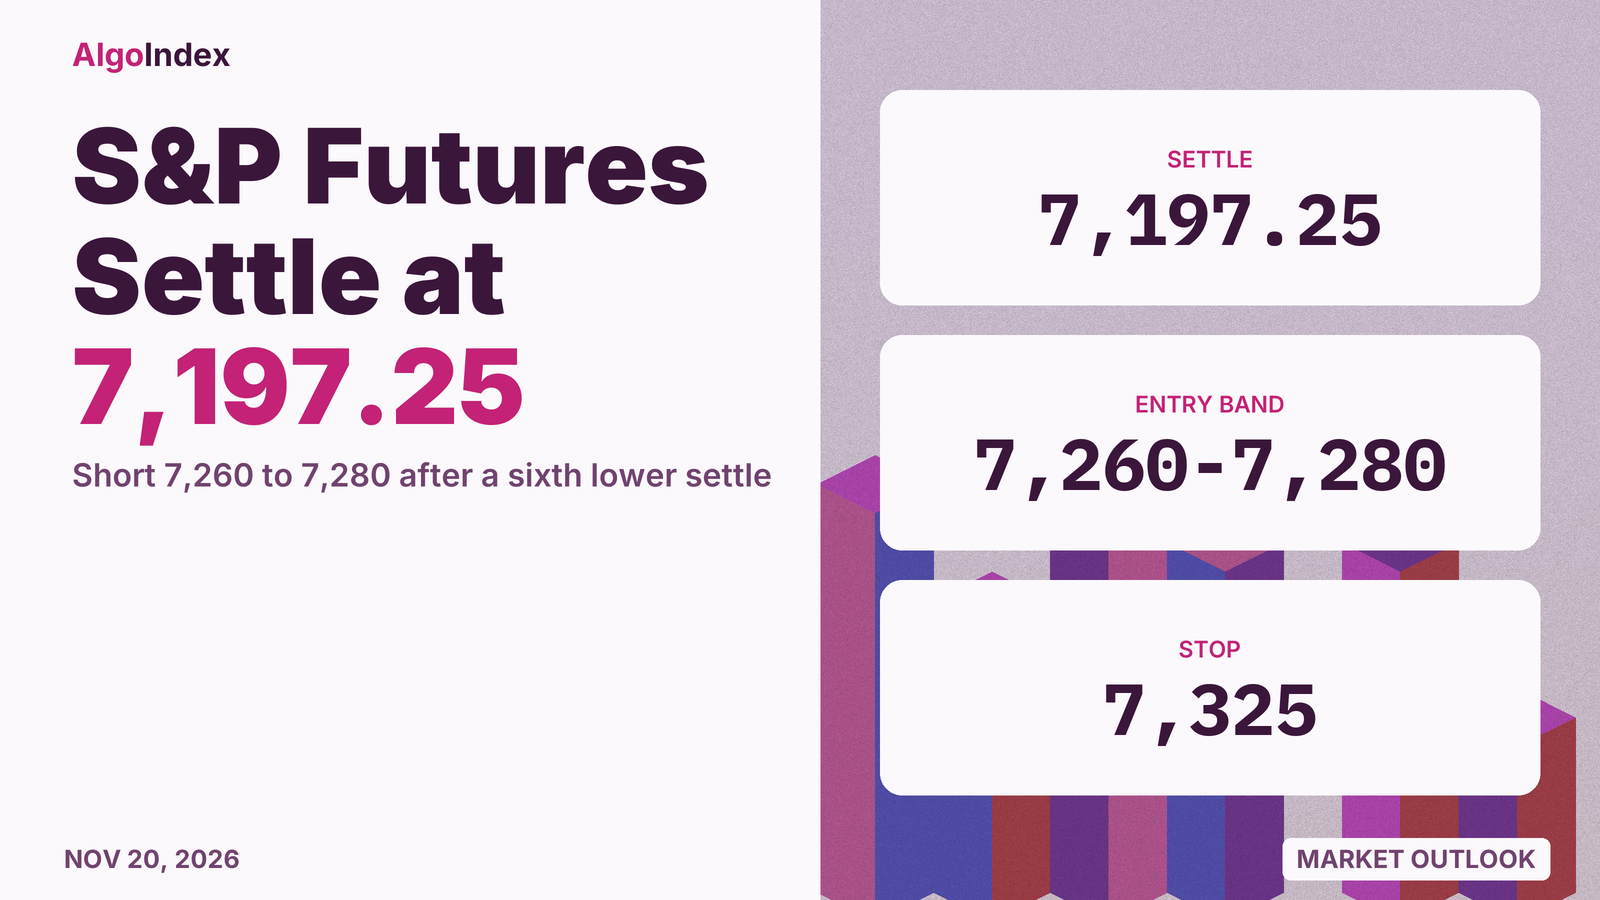
Then the market did what the card expected, too late to count. December fell from that 7,440.50 high to settle at 7,197.25, down 143.25 or 1.95 percent, and the 4:30 PM ET bar printed a 7,167.75 low after the settle. The 272.75 point range was the widest since 11/05/26. It was the sixth lower settle in a row and the lowest settle since 04/16/26.
Friday's plan sells a rebound again, one shelf lower: a short from 7,260 to 7,280 (SPX 7,238.58 to 7,258.58), around the Pivot Point at 7,268.50, with the stop at 7,325 above the 7,321.50 conversion of the SPX 7,300 put side base. Fed Governor Waller's remarks at 8:25 AM ET, listed by the news-feed calendar and unconfirmed, and the monthly options expiration that appears on a published key-date list, unconfirmed, are the first inputs.
AT A GLANCE
- December settle 7,197.25, down 143.25 or 1.95 percent; range 7,167.75 to 7,440.50, an outside session; sixth straight lower settle.
- Thursday's card: the 7,400 to 7,410 band traded at 1:00 AM ET and the 7,440 stop at 6:30 AM ET, a modeled 35.00 point loss measured from the band midpoint.
- Friday's setup: short 7,260 to 7,280 (SPX 7,238.58 to 7,258.58), stop 7,325, objectives 7,215, 7,160 and an extended 7,105.
- Thesis negated on a settle above Pivot R1 at 7,369.25; two consecutive 30-minute closes above 7,280, with the stop untouched, remove the edge.
- Dealer map: the 7,175.83 cash close sits 124.17 beneath the SPX 7,300 put side base (ES 7,321.50) and 175.83 above the SPX 7,000 largest gamma concentration (ES 7,021.50).
- Calendar: Lagarde 3:15 AM ET, Waller 8:25 AM ET and University of Michigan 10:00 AM ET, news-feed calendar, unconfirmed; Fed Governor Cook 12:15 PM ET, verified.
How Thursday traded: a dawn high, a midday break
The contract reopened at 7,340.50, level with Wednesday's settle, and buyers carried it higher through the night. The 6:00 PM ET bar closed at 7,368.75 and the 7:30 PM ET bar at 7,393.50. After a quiet stretch between 7,361.50 and 7,402.50, the 1:30 AM ET bar gained 17.50 to 7,417.75, and the 7,440.50 session high came in the 6:30 AM ET bar, 5.75 above Wednesday's high.
The cash open broke it. The 9:30 AM ET bar swung between 7,436.50 and 7,390.50, and the 10:00 AM ET bar fell 55.50 to 7,343.50. The 11:30 AM ET bar dropped 58.50, from 7,331.50 to 7,273.00, the largest decline of any bar. No time-stamped index headline sits inside that bar, so we do not pin it on a single item.
Selling did not stop at midday. The 12:00 PM ET bar reached 7,210.50, the contract held between 7,213.75 and 7,268.25 into the 2:30 PM ET bar, and the 3:30 PM ET bar closed at 7,194.25 into the 7,197.25 settle. After the settle the 4:30 PM ET bar printed 7,167.75 and closed at 7,182.50, 14.75 beneath the settle.
A failed share debut, softer data and a broad decline
Published market commentary said the S&P 500 and the Dow posted 6.5-month lows as stocks gave up an early rally when an AI developer's share debut failed to sustain enthusiasm for technology stocks, and that a chipmaker fell more than 7 percent after a short seller cited China risks. That is attributed commentary.
The data did not help. US jobless claims printed 203,000 against a 197,500 forecast and the Philadelphia Fed survey 6.3 against 20.1 at 8:30 AM ET, figures per the news-feed calendar and unconfirmed. Chicago Fed President Goolsbee said at 3:31 PM ET that he does not see inflation on a path back to 2 percent, per the news feed, unconfirmed. The dollar index closed at 103.93, up 0.07, and the ten-year yield index at 5.05, down 0.01.
The selling was broad. The S&P 500 cash index closed at 7,175.83, down 2.02 percent, the Nasdaq-100 cash index fell 2.21 percent and, per the same commentary, the Dow 2.19 percent. The volatility index rose 3.88 points to 28.44, its highest close since 03/30/26, while gold fell 1.51 percent. In our reading a decline of similar size across the three benchmarks, with gold lower too, describes a demand for cash rather than a rotation.
Where the dealer map sits
The options positioning data set read for Friday uses Wednesday's closes as its reference prices. Against Thursday's 7,175.83 cash close, the SPX 7,300 primary put side support base (ES 7,321.50) sits 124.17 points overhead, the modeled gamma-flip level at SPX 7,503 (ES 7,524.50) sits 327.17 overhead, and the largest gamma concentration at SPX 7,000 (ES 7,021.50) sits 175.83 beneath.
Gamma tilt reads 0.690 and gamma notional minus 1.245 billion dollars. In our reading a cash close beneath the put side base, with the largest concentration beneath price, describes an environment where hedging may add to moves in both directions into Friday's monthly options expiration, which appears on a published key-date list and is unconfirmed. Futures equivalents use Thursday's measured basis of 21.42 points, the 7,197.25 settle less the 7,175.83 cash close.
The trade map for Friday
The setup is a short from 7,260 to 7,280 (SPX 7,238.58 to 7,258.58), around the Pivot Point at 7,268.50. The stop is 7,325 (SPX 7,303.58), above the 7,321.50 conversion of the put side base. Objectives are 7,215 (SPX 7,193.58), 7,160 (SPX 7,138.58) beneath Thursday's 7,167.75 low, and an extended 7,105 (SPX 7,083.58) above Pivot S1 at 7,096.50.
Measured from the 7,270 midpoint, the risk to the stop is 55.00 points and the three objectives sit 55.00, 110.00 and 165.00 points away, or 1.00R, 2.00R and 3.00R. A settle above Pivot R1 at 7,369.25 negates the thesis. Short of that, and only while the 7,325 stop has not traded, two consecutive 30-minute closes above 7,280 remove the edge.
A 9-day raw stochastic of 0.05 percent says the decline is stretched, and an options expiration can produce sharp rebounds. That is why the plan waits for a rebound into the band rather than selling the low. The setup is an analyst judgment that rebounds are sold, not a measured edge.
How Friday could unfold
Night Session (6:00 PM ET Thursday to 3:00 AM ET Friday)
Japanese consumer prices and remarks by Philadelphia Fed President Paulson are listed for 6:30 PM ET and Chinese loan prime rates for 8:00 PM ET, by the news-feed calendar, unconfirmed. Our base case holds between Thursday's 7,167.75 low and the Pivot Point at 7,268.50, roughly 7,150 to 7,270.
London Session (3:00 AM to 8:00 AM ET Friday)
ECB President Lagarde is listed for 3:15 AM ET, unconfirmed. Bias lower beneath the Pivot Point at 7,268.50, roughly 7,130 to 7,280.
Morning Session (9:00 AM to 12:00 PM ET Friday)
Waller's remarks at 8:25 AM ET and the University of Michigan survey at 10:00 AM ET are listed by the news-feed calendar, unconfirmed. A rebound into the 7,260 to 7,280 band beneath 7,321.50 is the test the setup needs, roughly 7,120 to 7,300.
Afternoon Session (12:00 PM to 4:00 PM ET Friday)
Remarks by the US president are listed for 12:00 PM ET, unconfirmed, and Fed Governor Cook speaks at 12:15 PM ET per the verified forward calendar. Roughly 7,100 to 7,280, with the Pivot Point at 7,268.50 the reference into the 4:00 PM ET settlement.
Night Session Forward (6:00 PM ET Sunday)
The market closes for the weekend after Friday's session and reopens at 6:00 PM ET on Sunday, November 22, 2026. The personal income and outlays report is scheduled for 8:30 AM ET on Wednesday, November 25, ahead of the Thanksgiving holiday.
The most likely path, in our judgment, holds beneath the Pivot Point overnight, tries a rebound toward the band after the 8:25 AM ET remarks, fails beneath 7,321.50 and trades back toward the 7,167.75 low; a test of the 7,123.03 target price is more likely than a run to 7,021.50. A settle above Pivot R1 at 7,369.25 is the alternative, which would bring the 7,383.75 5-day average and 7,397.27 back into play. Acceptance beneath Pivot S1 at 7,096.50 could carry the contract toward 7,021.50 before the setup triggers.
The complete data picture
Every level, average, oscillator and range figure from Thursday's review, charted first and then listed in full.
| Time (Friday) | Event |
|---|---|
| 3:15 AM ET | ECB President Lagarde remarks, news-feed calendar, unconfirmed |
| 8:25 AM ET | Fed Governor Waller remarks, news-feed calendar, unconfirmed |
| 10:00 AM ET | University of Michigan final survey (sentiment forecast 51.5), news-feed calendar, unconfirmed |
| 10:00 AM ET | State employment figures, verified forward calendar |
| 12:00 PM ET | Remarks by the US president, news-feed calendar, unconfirmed |
| 12:15 PM ET | Fed Governor Cook speech, verified forward calendar |
| All day | Monthly options expiration, published key-date list, unconfirmed |
Full numeric reference
Executive Summary
The December S&P 500 contract settled at 7,197.25 on Thursday, down 143.25 or 1.95 percent from Wednesday's settle of 7,340.50, after trading between 7,440.50 and 7,167.75, a 272.75 point daily range. The settle finished 29.50 above the low and 243.25 beneath the high, in the lower ninth of the range. Thursday printed a higher high, 5.75 above Wednesday's 7,434.75, and a lower low, 137.50 beneath Wednesday's 7,305.25, an outside session that reversed from the high to settle near the low, and the 272.75 point range was the widest since the 392.75 point range of 11/05/26.
It was the sixth consecutive lower settle, the fifth consecutive lower low and the lowest settle since the 7,189.75 settle of 04/16/26, and the 7,167.75 low is the lowest since the 7,163.25 low of 04/16/26; the provider publishes 7,167.75 as the one-month and 13-week low. Over five sessions the contract is down 418.00 from the 7,615.25 settle of 11/12/26, a decline of 5.49 percent. The cash index closed at 7,175.83, down 147.80 or 2.02 percent, and the provider's market commentary said the S&P 500 and the Dow posted 6.5-month lows as stocks gave up an early rally when an AI developer's share debut failed to sustain enthusiasm for technology stocks; that is attributed commentary and was not recomputed.
On the dealer-positioning data, whose level table uses Wednesday's cash close as its reference, the cash close sits 124.17 beneath the SPX 7,300 primary put side support base, 327.17 beneath the modeled gamma-flip level at SPX 7,503 and 175.83 above the largest gamma concentration at SPX 7,000, in this review's interpretation a condition where hedging may add to moves in both directions into Friday's monthly options expiration, which appears on a published key-date list and is unconfirmed. The volatility index rose 3.88 points to 28.44, its highest close since 03/30/26 per the provider's daily record.
The composite multi-indicator read published on Thursday evening is "100% SELL", with strength "Maximum" and direction "Strongest". The Primary Setup in section 8 is a short from the 7,260 to 7,280 band (SPX 7,238.58 to 7,258.58), around the Pivot Point at 7,268.50, stopped at 7,325, with objectives at 7,215, 7,160 and an extended 7,105. In this review's judgment Fed Governor Waller's remarks at 8:25 AM ET on Friday, listed by the news-feed calendar and unconfirmed, and Friday's monthly options expiration, which appears on a published key-date list and is unconfirmed, are the first-order inputs for the contract.
Price Action & Technical Structure
2.1 Intraday and Session Review
The December contract opened Thursday's session at 7,340.50 at the Wednesday 6:00 PM ET reopen, level with Wednesday's settle, traded between 7,440.50 and 7,167.75 and settled at 7,197.25 at 4:00 PM ET, per the provider's December settlement record. The chart's completed Thursday daily bar reads 7,340.50, 7,440.50, 7,167.75 and 7,197.25, equal to the provider's December row, and its prior bar closes at 7,340.50, equal to Wednesday's December settle.
On the preserved 30-minute series the contract rose through the evening, with the 6:00 PM ET bar closing at 7,368.75 and the 7:30 PM ET bar at 7,393.50, then held between 7,361.50 and 7,402.50 until 1:30 AM ET. The 1:30 AM ET bar gained 17.50 to 7,417.75, and the session high of 7,440.50 printed in the 6:30 AM ET bar. The contract held between 7,408.50 and 7,435.50 through the 9:00 AM ET bar, and the 9:30 AM ET bar, which spans the cash open at 9:30 AM ET, traded between 7,436.50 and 7,390.50 and closed at 7,399.25.
The 10:00 AM ET bar then fell 55.50, from 7,399.00 to 7,343.50, and the 10:30 AM ET bar reached 7,293.00. The 11:30 AM ET bar fell 58.50, from 7,331.50 to 7,273.00, the largest decline of any bar in the session, and the 12:00 PM ET bar reached 7,210.50 before closing at 7,287.75. The 12:30 PM ET bar fell 34.00 to 7,253.50, the contract held between 7,213.75 and 7,268.25 into the 2:30 PM ET bar, and the 3:30 PM ET bar closed at 7,194.25.
The settlement at 4:00 PM ET came at 7,197.25. After the settle the 4:00 PM ET bar closed at 7,184.50, and the 4:30 PM ET bar printed the session low of 7,167.75 before closing at 7,182.50, 14.75 beneath the settle. The captured news feed carries no time-stamped index headline inside the 11:30 AM ET bar, so this review does not attribute the largest decline to a single item.
The provider pages were read at 5:49 PM ET, before the 6:00 PM ET reopen, and the overview's day open of 7,340.50, high of 7,440.50, low of 7,167.75 and previous close of 7,340.50 belong to Thursday's completed session. The chart's header read 7,197.25, down a rounded 1.95 percent, which is consistent with the prior close but does not fix it to the cent; the provider's exact settlement change of 143.25 points does, since 7,197.25 plus 143.25 is 7,340.50, which matches the provider's previous close field and the chart's prior bar.
The ladder published after the reopen projects Friday's levels from Thursday's completed session, and Thursday's high and low were recovered from it with the outer pairs. Pivot R3 at 7,642.00 minus Pivot S3 at 6,823.75, divided by three, returns 272.75, and Pivot R2 at 7,541.25 minus Pivot S2 at 6,995.75, divided by two, returns the same 272.75. The published Pivot Point is 7,268.50. Three times that value, less the 7,197.25 settle, gives a high plus low sum of 14,608.25, which with the 272.75 range solves to a high of 7,440.50 and a low of 7,167.75. That pair, with the 7,197.25 settle, reproduces all seven published rungs. These are the completed-session inputs behind the published pivot ladder rather than an independently read bar, and the provider's published one-month and 13-week low of 7,167.75 is independent corroboration of the low.
2.2 Daily Structure
Thursday printed a higher high and a lower low against Wednesday, an outside session, and settled 143.25 lower, 29.50 above the low. Settlements over the last six sessions read 7,615.25, 7,583.00, 7,439.00, 7,359.00, 7,340.50 and 7,197.25, six consecutive lower settles.
Highs over the last five sessions read 7,669.25 on 11/13/26, 7,614.25 on 11/16/26, 7,456.75 on 11/17/26, 7,434.75 on 11/18/26 and 7,440.50 on Thursday, so the high broke a run of lower highs by 5.75 points, while lows read 7,519.25, 7,420.25, 7,308.00, 7,305.25 and 7,167.75, the fifth consecutive lower low. The provider publishes 7,905.00 as the 52-week high, 7,897.50 as the 13-week high, 7,819.50 as the one-month high and 6,466.00 as the 52-week low. The settle sits 11.75 above the 7,185.50 level published as the 50 percent retracement of the 52-week range.
In this review's interpretation an outside session that failed 5.75 points above Wednesday's high and settled in the lower ninth of a range twice Wednesday's width extends the decline rather than marking a low.
2.3 4-Hour and Swing Structure
The 272.75 point range followed ranges of 194.00 on 11/16/26, 148.75 on 11/17/26 and 129.50 on 11/18/26. Daily ranges over the last ten sessions, from 11/06/26, ran 146.75, 236.75, 105.75, 124.00, 102.75, 150.00, 194.00, 148.75, 129.50 and 272.75.
The swing sequence since the 7,819.50 one-month high shows a decline that reached Thursday's 7,167.75 low, and the six consecutive lower settles carried the contract 418.00 points beneath the 7,615.25 settle of 11/12/26. Beneath the settle the next published references are the 7,185.50 retracement, the 7,169.08 relative strength 30 percent projection, Thursday's 7,167.75 low and the 7,123.03 target price.
The published grid places a stall projection at 7,370.70, the 7,355.30 level published as the 61.8 percent retracement from the 52-week low and the 9-day average crossing at 7,464.84 above the settle, with the 7,048.54 projection for the 3-10 day average crossover stall beneath it.
2.4 Moving Averages
The averages cited here were computed this run from the provider's daily settlement series for the December contract, preserved in the coverage receipt, which holds 260 completed sessions from 11/10/25 through Thursday; no row dated Friday was present at capture, and each average is carried at full precision and rounded once to the cent. The 5-day average stands at 7,383.75, the 9-day at 7,477.00, the 20-day at 7,562.69, the 50-day at 7,685.59, the 100-day at 7,692.22 and the 200-day at 7,455.68.
The 7,197.25 settle sits 186.50 beneath the 5-day average, 279.75 beneath the 9-day, 365.44 beneath the 20-day, 488.34 beneath the 50-day, 494.97 beneath the 100-day and 258.43 beneath the 200-day. It is the fifth consecutive settle beneath the 5-day average, the last settle above it on 11/12/26, the fourth beneath the 9-day and the 200-day, the last above both on 11/13/26, the sixteenth consecutive settle beneath the 20-day and the 50-day, the last above both on 10/28/26, and the eleventh beneath the 100-day, the last above it on 11/04/26. The 5-day average fell from Wednesday's 7,467.35 and the 9-day from 7,499.75.
The 5-day average sits beneath the 9-day because the four older settlements in the 9-day window averaged higher, at 7,593.56. The 9-day sits beneath the 20-day because the 11 older settlements in the 20-day window averaged higher, at 7,632.80. The 20-day sits beneath the 50-day because the 30 older settlements in the 50-day window averaged higher, at 7,767.52. The 50-day sits beneath the 100-day because the 50 older settlements in the 100-day window averaged higher, at 7,698.85, and the 100-day sits above the 200-day because the 100 older settlements in the 200-day window averaged lower, at 7,219.14.
2.5 Oscillator and Trend Readings
The oscillator figures below are as published on the provider's December technical page, read at 5:49 PM ET before the 6:00 PM ET reopen, so they reflect Thursday's settle; they are the provider's readings, not this run's computations. The 9-day relative strength reads 25.38, the 14-day relative strength 30.25 and the 20-day relative strength 33.59.
The 9-day raw stochastic reads 0.05 percent and the 14-day raw stochastic 0.04 percent, while the 14-day stochastic %K reads 6.33 percent and the 14-day stochastic %D 16.48 percent. The 9-day directional index ADX reads 25.24 with the 9-day +DI at 10.15 and the 9-day -DI at 30.70, and the 14-day directional index ADX reads 19.96 with the 14-day +DI at 11.99 and the 14-day -DI at 28.68, so negative direction leads on both systems. The 9-day historic volatility reads 21.20 percent and the 14-day historic volatility 25.98 percent.
The composite multi-indicator read published on Thursday evening is "100% SELL", with signal strength "Maximum" (Top 1%) and direction "Strongest" (Top 1%). The short, medium and long horizon groups each average "100% SELL", and the trend composite reads "SELL".
2.6 Volatility and Expected Range
The published 14-day average true range stands at 144.28 points and the 14-day average daily range at 175.21 points; the 9-day average true range is 159.45 with a 9-day average daily range of 161.83, and the 20-day average true range is 131.35 with a 20-day average daily range of 148.39. Thursday's daily range exceeded each of those averages.
Adding and subtracting the 14-day average true range of 144.28 from the 7,197.25 settle frames Friday between 7,052.97 and 7,341.53. The published standard-deviation bands, built from five settlements, span 7,055.81 to 7,338.69 at one deviation, 6,997.23 to 7,397.27 at two and 6,952.27 to 7,442.23 at three. These bands describe dispersion, not intraday reach. In this review's judgment the Fed remarks and Friday's monthly options expiration, which appears on a published key-date list and is unconfirmed, point to a range near the 9-day average daily range of 161.83.
Key Levels
3.1 Resistance
Above the 7,197.25 settle, the first reference is the Pivot Point at 7,268.50, followed by the 7,321.50 conversion of the SPX 7,300 put side base and one standard deviation resistance at 7,338.69. Wednesday's 7,340.50 settle, Pivot R1 at 7,369.25 and the 7,370.70 stall projection form the next band, with the 7,383.75 5-day average and two standard deviation resistance at 7,397.27 above it. The 7,421.50 conversion of the SPX 7,400 summary resistance, Thursday's 7,440.50 high and the 7,455.68 200-day average follow, with the 7,524.50 conversion of the modeled gamma-flip level beyond them.
3.2 Support
Beneath the settle sit the 7,185.50 retracement, the 7,182.50 close of the 4:30 PM ET bar, the 7,169.08 projection and Thursday's 7,167.75 low. The 7,123.03 target price, Pivot S1 at 7,096.50 and one standard deviation support at 7,055.81 form the next band, followed by the 7,048.54 crossover stall and the 7,021.50 conversion of the SPX 7,000 largest gamma concentration. Two standard deviation support at 6,997.23 and Pivot S2 at 6,995.75 are the deeper references.
Macro Drivers
4.1 Dollar, Rates, and Fed Policy
The dollar index's daily record closed at 103.93, up 0.07, and the ten-year yield index closed at 5.05, down 0.01 from Wednesday's close, while the December ten-year note contract settled at 105.875. US jobless claims printed 203,000 against a 197,500 forecast and the Philadelphia Fed survey 6.3 against a 20.1 forecast at 8:30 AM ET on Thursday, figures per the news-feed calendar and unconfirmed. Goolsbee said at 3:31 PM ET that he does not see inflation on a path back to 2 percent, per the news feed, unconfirmed. The FOMC statement is scheduled for 2:00 PM ET on Wednesday, December 9, 2026, per the verified forward calendar.
In this review's interpretation softer activity data did not lift equities, because the hike pricing that the headlines describe stayed in place and the selling was led by technology.
4.2 Large-Cap Leadership and Earnings
Walmart's results were released at 8:00 AM ET on Thursday, November 19, 2026, per the verified forward calendar, and Intuit's results call was scheduled for 4:30 PM ET on Thursday, November 19, 2026, per the verified forward calendar; their figures were not captured. The provider's commentary said an AI developer's share debut failed to sustain enthusiasm for technology stocks and that a chipmaker fell more than 7 percent after a short seller cited China risks; that is attributed. At 3:16 PM ET the news feed carried NVIDIA and Microsoft announcing deployment of NVIDIA's next rack-scale systems on Azure, and at 4:37 PM ET a report that Apple is developing its own AI agent.
4.3 Geopolitical Backdrop
At 2:39 PM ET the US president said he and the Chinese leader would work together on reasonable AI regulations, and at 3:06 PM ET that a deal limiting nuclear weapons would be hard to reach, per the news feed. Between 2:27 PM ET and 2:45 PM ET the feed carried House committee statements on advanced-chip export licenses for China. At 1:47 PM ET an Iranian press report said a tanker hit a mine in the eastern Strait of Hormuz. These are reports carried by the feeds, and the settlement record does not establish that any single item caused a particular move.
4.4 Sector Breadth and Rotation
The provider's commentary said weakness in health insurers extended to a third day after a proposed Medicare Advantage audit framework, which is attributed. The Nasdaq-100 cash index fell 2.21 percent against the S&P 500's 2.02 percent, and the provider's commentary put the Dow's decline at 2.19 percent, which is attributed; a news-feed headline at 4:45 PM ET said the Dow fell more than 1,000 points. In this review's interpretation a decline of similar size across the three benchmarks describes broad selling rather than a rotation between groups.
4.5 Cross-Asset and Volatility
The volatility index rose 3.88 points to 28.44, its highest close since 03/30/26, per the provider's daily record. Gold's December contract fell 1.51 percent, silver's 1.55 percent and January crude settled 0.13 higher. A news-feed item at 4:53 PM ET said total money market fund assets fell 3.58 billion dollars to 7.98 trillion in the week ended November 18, per an industry survey. In this review's interpretation the rise in the volatility index alongside lower gold and a firm dollar describes a demand for cash across asset classes.
4.6 Institutional Positioning
The latest weekly positioning report on the provider's overview, for the week to Tuesday, November 10, 2026, shows leveraged funds at 145,755 long, up 20,486, against 448,815 short, down 48,772, and asset managers at 1,115,756 long against 201,626 short, as listed and not recomputed. December volume was 2,494,046 contracts on Thursday against 2,057,168 on Wednesday, per the settlement record. The provider lists 12/18/26 as the December contract's expiration date.
SPX Options Flow Context
The dealer-positioning dataset read for this section is the edition dated Thursday, November 19, 2026 at 6:01 PM ET, whose level table is unchanged from the morning edition, and its reference prices are Wednesday's closes: SPX 7,323 matches Wednesday's 7,323.63 cash close, which the positioning console also carries as its previous close, and 7,323.63 less Thursday's 147.80 point decline reproduces the 7,175.83 close, a decline of 2.02 percent when rounded. Every level below is read against Thursday's 7,175.83 close.
On the index the primary call side ceiling sits at SPX 8,100, the largest gamma concentration at SPX 7,000, the modeled volatility threshold at SPX 7,600, the modeled gamma-flip level at SPX 7,503 and the primary put side support base at SPX 7,300. The close sits 924.17 points beneath the ceiling, 424.17 beneath the threshold, 327.17 beneath the flip level, 124.17 beneath the put side base and 175.83 above the largest concentration. Gamma tilt reads 0.690, gamma notional minus 1.245 billion dollars and the dataset's gamma index minus 4.484, with an implied five-day move of 1.48 percent, all from the table built on Wednesday's reference. The dataset's key strikes are SPX 7,000, 8,000, 7,400 and 7,500.
The dataset's summary block lists resistance at 7,400, 7,420 and 7,450, a directional line at 7,590, bearish beneath and bullish above, marked as updated on 11/12/26, and support at 7,300 and 7,000. Its update dated 11/18 describes a base case of a rally above 7,600 into next week, and a risk that outage headlines could bring selling toward the 7,000s; that is the source's view, not this review's.
The dataset publishes its own December futures pair for each level, carrying the source's 20.73 point offset rather than this run's measured 21.42 point basis: the ceiling at 8,120.73, the largest concentration at 7,020.73, the modeled volatility threshold at 7,620.73, the modeled gamma-flip level at 7,523.73 and the put side support base at 7,320.73. These are quoted as the source's pairs. The modeled threshold and flip level are model outputs, not option strikes. This run's basis is the December settle of 7,197.25 less the provider's 7,175.83 cash close, both completed 4:00 PM ET records, or 21.42; at that basis the SPX 7,000 concentration converts to 7,021.50, the SPX 7,300 base to 7,321.50, the SPX 7,400 resistance to 7,421.50, the SPX 7,503 flip level to 7,524.50 and the SPX 7,600 threshold to 7,621.50, each rounded to the contract's tick.
The S&P 500 positioning console, read at 6:00 PM ET, carried Wednesday's 7,323.63 as its previous close, with its largest gamma concentration at 7,000, its call side ceiling at 8,100, its put side base at 7,300 and a negative gamma hedge estimate. Its current price field read 7,161.7, which differs from the provider's 7,175.83 close and is not used. In this review's interpretation a cash close beneath the put side base, with the largest concentration at 7,000 beneath price, leaves 7,000 as the next positioning reference and describes an environment where hedging may add to moves into Friday's monthly options expiration, which appears on a published key-date list and is unconfirmed.
Forecast
Night Session (6:00 PM ET Thursday to 3:00 AM ET Friday, Globex/Asia)
Globex reopened at 6:00 PM ET on Thursday. Japanese consumer prices and remarks by Philadelphia Fed President Paulson are listed for 6:30 PM ET on Thursday, and Chinese loan prime rate decisions for 8:00 PM ET on Thursday, by the news-feed calendar, unconfirmed. In this review's judgment the overnight session is likely to hold between Thursday's 7,167.75 low and the Pivot Point at 7,268.50; expected band roughly 7,150 to 7,270.
London Session (3:00 AM to 8:00 AM ET Friday)
Remarks by ECB President Lagarde are listed for 3:15 AM ET on Friday by the news-feed calendar, unconfirmed. Bias lower beneath the Pivot Point at 7,268.50, expected band roughly 7,130 to 7,280.
Morning Session (9:00 AM to 12:00 PM ET Friday, US Open / Pit Session)
Fed Governor Waller's remarks are listed for 8:25 AM ET on Friday by the news-feed calendar, unconfirmed, and the final University of Michigan survey is listed for 10:00 AM ET on Friday by the news-feed calendar, unconfirmed. The cash open at 9:30 AM ET is the first directional test of the session, with monthly options expiring on Friday per a published key-date list, unconfirmed. A rebound into the 7,260 to 7,280 band beneath the 7,321.50 conversion of the put side base is the test the setup needs; expected band roughly 7,120 to 7,300.
Afternoon Session (12:00 PM to 4:00 PM ET Friday)
Remarks by the US president are listed for 12:00 PM ET on Friday by the news-feed calendar, unconfirmed, and Fed Governor Cook's speech is scheduled for 12:15 PM ET on Friday, November 20, 2026, per the verified forward calendar. Expected band roughly 7,100 to 7,280, with the Pivot Point at 7,268.50 the reference into the settlement at 4:00 PM ET.
Night Session Forward (6:00 PM ET Sunday)
The ES market closes for the weekend after Friday's session and reopens at 6:00 PM ET on Sunday, November 22, 2026. Australian purchasing manager surveys are listed for 5:00 PM ET on Sunday by the news-feed calendar, unconfirmed, ahead of that reopen. The personal income and outlays report is scheduled for 8:30 AM ET on Wednesday, November 25, 2026, per the verified forward calendar, ahead of the Thanksgiving holiday on Thursday, November 26, which appears on a published key-date list and is unconfirmed.
Expected Range (Friday Full Session)
- Low-range scenario: 7,150 to 7,270
- Mid-range scenario (most likely): 7,055 to 7,340
- High-range scenario: 6,995 to 7,400
Most Likely Path
In this review's analyst judgment, the most probable path holds beneath the Pivot Point at 7,268.50 through the overnight hours, attempts a rebound toward the 7,260 to 7,280 band after the 8:25 AM ET remarks and fails beneath the 7,321.50 conversion of the put side base, then trades back toward Thursday's 7,167.75 low. Six consecutive lower settles, the outside reversal, the composite at "100% SELL" and a cash close beneath the SPX 7,300 put side base support that reading, while a 9-day raw stochastic of 0.05 percent argues that the decline is extended and that a test of the 7,123.03 target price is more likely than a run to the 7,021.50 conversion of the largest concentration.
The alternative that would invalidate this reading is a settle above Pivot R1 at 7,369.25, which would bring the 7,383.75 5-day average and two standard deviation resistance at 7,397.27 back into play; a reduction in hedging pressure after Friday's monthly options expiration, which appears on a published key-date list and is unconfirmed, or a softer turn in the Fed remarks are the inputs most likely to drive that alternative. On the other side, acceptance beneath Pivot S1 at 7,096.50 could carry the contract toward the 7,021.50 conversion of the SPX 7,000 concentration before the setup triggers.
Friday Economic Calendar
Thursday's releases are complete. Walmart's results were released at 8:00 AM ET on Thursday, November 19, 2026, per the verified forward calendar. US jobless claims printed 203,000 against a 197,500 forecast, continuing claims 1.763 million and the Philadelphia Fed survey 6.3 against a 20.1 forecast at 8:30 AM ET on Thursday, figures per the news-feed calendar and unconfirmed. The advance quarterly services report was released at 10:00 AM ET on Thursday, November 19, 2026, per the verified forward calendar, and Intuit's results call was scheduled for 4:30 PM ET on Thursday, November 19, 2026, per the verified forward calendar.
Friday brings remarks by ECB President Lagarde at 3:15 AM ET, listed by the news-feed calendar, unconfirmed. Fed Governor Waller's remarks are listed for 8:25 AM ET on Friday by the news-feed calendar, unconfirmed. The final University of Michigan survey is listed for 10:00 AM ET on Friday by the news-feed calendar with a sentiment forecast of 51.5, unconfirmed, and state employment figures are scheduled for 10:00 AM ET on Friday, November 20, 2026, per the verified forward calendar.
Remarks by the US president are listed for 12:00 PM ET on Friday by the news-feed calendar, unconfirmed, and Fed Governor Cook's speech is scheduled for 12:15 PM ET on Friday, November 20, 2026, per the verified forward calendar. Monthly options expiration on Friday, November 20, 2026, appears on a published key-date list and is unconfirmed. In this review's judgment the expiration, which appears on a published key-date list and is unconfirmed, and the Fed remarks are the first-order inputs for the contract on Friday.
Sources and methodology
Prices, settlements and volume come from the exchange settlement record and the daily series for the December contract (ESZ26). Session timing comes from Thursday's 30-minute bars, from the Wednesday 6:00 PM ET reopen through the 4:30 PM ET bar. Moving averages were computed from 260 completed daily settlements; oscillators, the composite read and the pivot ladder are quoted as published. Dealer-positioning levels come from an options positioning data set that uses Wednesday's closes as reference prices; futures equivalents use Thursday's measured basis of 21.42 points.
The prior card, in Thursday's outlook, sold December into 7,400 to 7,410 with a 7,440 stop and objectives at 7,370, 7,335 and 7,300. It is graded only on its own levels across Thursday's full 30-minute path: the 1:00 AM ET bar reached 7,402.50, inside the band, and the 1:30 AM ET bar first traded the 7,405 midpoint; after the band was reached, no objective traded before the 6:30 AM ET bar reached 7,440.50 and the stop. The modeled result is a loss of 35.00 points measured from the 7,405 midpoint, a replay of the card's own levels on 30-minute bars, not a reported fill. The 7,370 objective had traded in the 6:00 PM ET bar, before the band was reached, and does not count. The decline that followed came after the stop and does not change that result.
Every outlook is graded in public against its own levels; the running record sits on our performance statement.
Six lower settles in a row. Friday may show whether a rebound into 7,260 to 7,280 finds sellers again.