
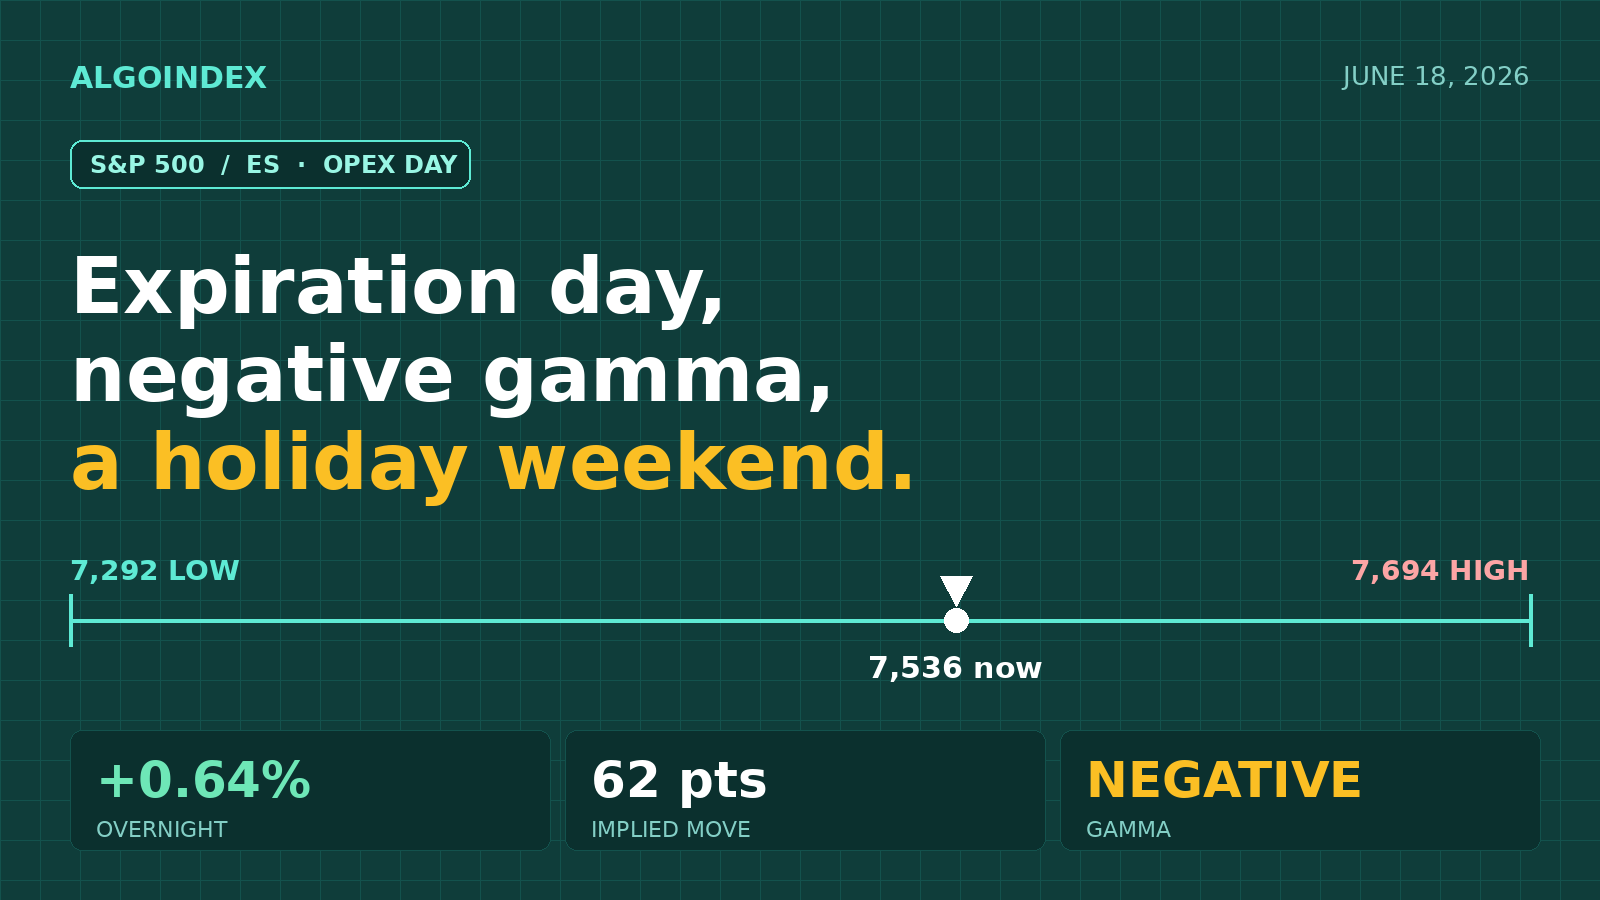
Four hours before the close on the largest options expiration of the cycle, with the cash market shut tomorrow for Juneteenth, the S&P 500 is trying to undo a hawkish Federal Reserve. The overnight bid has erased about half of yesterday's slide, but the calendar, not the day-to-day tick, is what defines this session.
The prior cash session closed at 7,420 on the index, down roughly 1.2%, with the bulk of that loss concentrated in a sharp move during the final two hours after the central bank signaled the door remains open to higher rates. Front-month ES futures settled the prior day at 7,492.75 and have spent the overnight grinding higher, last near 7,536 to 7,541, a gain of about 48 points or 0.64%. The recovery has carried price back above the computed daily pivot at 7,525.83, a constructive near-term tell, while the index volatility gauge has slid more than five percent to the mid-17s after spiking into the decision.
The dominant feature of today is the calendar itself. Today is monthly options expiration, and tomorrow the cash market is closed for Juneteenth, producing a compressed three-day weekend. Options-positioning data shows the market sitting in a net-negative gamma environment, meaning dealers are positioned in a way that tends to amplify rather than dampen intraday moves. That fragility, layered on top of expiration mechanics and a still-fresh hawkish policy shift, argues for respecting both sides of the range until the market proves direction.
Mid-range in a wide, choppy band
On the daily timeframe, ES sits mid-range within a one-month band defined by the 7,292.25 low printed June 11 and the 7,693.75 high from June 2. Price is roughly two percent under the cycle high and about three percent above the monthly low. The longer-term trend remains higher, with medium and long-term readings still net positive, yet the short-term picture has turned defensive. The multi-indicator composite reads 32% buy overall, with short-term indicators averaging 20% sell against medium-term at 75% buy and long-term at 67% buy. The larger trend is intact; the near term is in repair.
The moving-average crossover levels frame the near-term battle: the 9-day sits near 7,491.63, the 40-day near 7,471.53, and the 18-day cross near 7,562.06. Price trading above the 9-day and 40-day while pressing the 18-day is a mildly positive alignment, with the 18-day the next overhead pivot to clear. The environment is low-volatility, with front-month implied volatility near 15.5% and the one-standard-deviation band spanning roughly 7,435 to 7,551, the two-standard-deviation extension reaching 7,411 to 7,575.
Negative gamma is the fragility signal
The primary flow surface for ES is the index-cash options book. The updated morning desk note frames index 7,500 as the major resistance for today and into early next week, with additional supply building toward 7,600, a pivot at 7,475, and support at 7,400. The desk's base case is a modest one-to-two-percent correction, and it explicitly looks for today's monthly expiration to mark a short-term high as elevated single-stock call skews revert on expiry.
The fragility signal is the gamma posture. Positioning data shows a net-negative stance, with the prior day's heatmap flipping from volatility-dampening to volatility-amplifying after 2:00 PM. The index holds negative gamma for today down to roughly 7,350, which means that if selling starts it can gather pace rather than mean-revert. Today is the largest delta expiration of the cycle, with a large block of index options settling at the 9:30 AM open and single stocks at 4:00 PM. The near-term offset is that traders are likely to sell volatility into the three-day weekend, which can be briefly supportive, but the dominant read is that the expiration caps the upside. Positioning is put-heavy, with a put-to-call open-interest ratio of 1.32 and the prior session showing roughly negative eight billion dollars of net hedging flow dominated by put buying near seven billion, protection that now sits as potential fuel for a relief move if it unwinds.
Buy the dip, but respect the supply
The first overhead shelf is 7,550, the one-standard-deviation resistance and the immediate cap on the overnight rally. Above it, 7,562 marks the 18-day cross and 7,568 is the prior-session high, a combined supply zone that defines the morning's bull-bear line. Clearing and holding 7,568 opens 7,579, the first pivot resistance, with the 2-standard-deviation extension at 7,575 just beneath, then 7,666 and the cycle high at 7,693.75. The first support is the pivot at 7,525.83, which price reclaimed overnight, then today's open and prior-day low at 7,504 to 7,512, the primary buy-the-dip shelf. Below that, 7,492.75 is the prior settle and aligns with the 9-day cross, ahead of 7,471, the 7,435 to 7,439 grouping, and deeper toward the 7,292.25 monthly low.
The conditional path is to short the rejection: if price rallies into 7,568 to 7,580 and stalls with weak breadth, a fade back toward the 7,525 pivot offers a counter-trend scalp with a stop above 7,585. The base case is a constructive but contained session, holding the pivot, probing the 7,550 to 7,568 supply, and chopping into expiration, a roughly 50% path. A hawkish data follow-through that breaks 7,492 retests 7,471 then 7,439 on a 30% path, and an unwind of downside hedges sparks a relief push through 7,580 on the 20% tail. The single first-order event block is the 08:30 ET jobless claims and Philadelphia Fed index, read through a higher-for-longer lens, with a hot print pressuring rate-sensitive equities and a soft print supporting the relief case. Given monthly expiration plus the pre-holiday liquidity drain, the cleanest discipline is to fade extremes rather than chase, and to stand aside in the afternoon if price is chopping with no clear flow.
AlgoIndex maps computed levels, dealer-positioning context, and the gamma backdrop every session. See how the levels hold up on the performance statement, compare strategies on the pricing page, and log every fill against the plan with the free AI Trading Journal.
Latest session: S&P 500: A Pullback Inside an Uptrend Meets Negative Gamma →
Foundational guides
New to S&P 500 futures? Start with What Are ES Futures, the ES, NQ, MES & MNQ point value and contract specs, gamma exposure (GEX) explained, and market internals: TICK, ADD, VOLD and VIX.



