
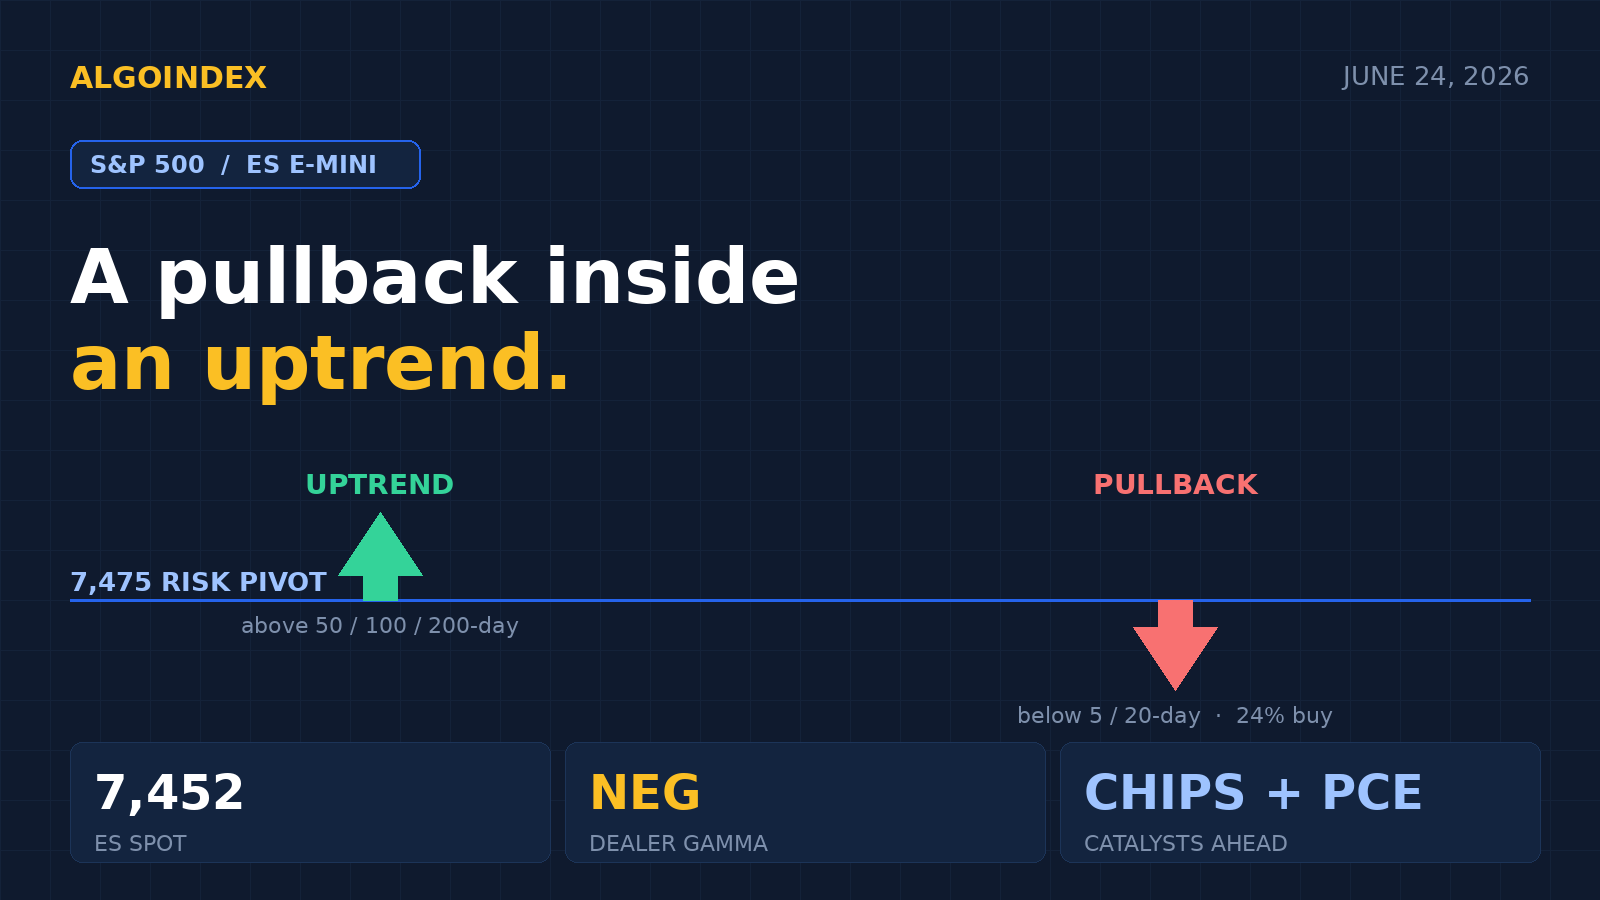
The S&P 500 is caught between two timeframes this morning. Step back and the multi-month uptrend is intact, with one major bank lifting its year-end target to 7,800. Zoom in and the index just fell 1.4% in a technology-led rout, closed below the level that dealers watch, and faces a chip-earnings report tonight and an inflation print tomorrow. The E-mini sits near 7,448 to 7,457, up about 0.2%, a relief stabilization rather than a fresh leg higher.
The September front month trades up roughly 10 to 19 points against Tuesday's 7,437.50 settle, after an overnight range of 7,420.25 to 7,459.75 on volume near 173,000 contracts. The bounce was concentrated in Asia, where South Korea's Kospi rebounded 3.3% after one of its steepest single-day declines on record. Tuesday itself was a genuine risk-off day: the cash index closed near 7,366, the technology-heavy index dropped 3.3%, and chips fell roughly 7%, driven by a re-rating of the artificial-intelligence trade and mechanical hedging pressure as longer-dated single-stock calls were sold.
A pullback inside an uptrend
The configuration is a standard pullback within an uptrend: price has slipped beneath the fast averages while holding above the slow ones. The composite reads only 24% buy overall precisely because a 40% short-term sell is dragging against a 75% medium-term and 67% long-term buy. In plain terms, this is a pullback inside a larger uptrend, and the next forty-eight hours of catalysts will decide whether it stays a pullback or deepens into a correction.
Momentum confirms a moderate, active down-leg rather than a breakdown: the fourteen-day relative strength reads 47.19, below the midline but not oversold, while the directional system shows negative pressure at 24.48 above positive at 14.83. The working range is roughly 100 to 126 points; off the 7,437.50 settle a one-range band frames about 7,335 to 7,540, with the options-implied band tighter near 7,390 to 7,490 given the catalysts sit after the close and tomorrow morning.
Two domains, one map
The cash index's options-positioning data is the primary read for the E-mini. In cash terms, resistance builds at 7,400 and 7,500, the risk pivot sits at 7,475 (defensive below, constructive above), and support layers at 7,330 and 7,150, with the primary gamma concentration strike at 7,000 acting as the larger downside magnet into the end-of-month expiration. Those map into the ES futures domain at roughly a lower support strike of 7,468, a gamma flip near 7,497, a volatility inflection near 7,558, an upper resistance strike near 7,668, and the deep magnet near 7,068.
The desk thesis: with the cash index having closed below the 7,475 risk pivot, the environment is defensive, and the base case is a 1 to 2% correction. If today's chip earnings and tomorrow's inflation print fail to spark buyers, the path of least resistance points toward the 7,000 cash magnet into the end-of-month expiration. The negative dealer-gamma reading near minus 0.385 mechanically amplifies moves in both directions, and a thin short-put cushion means an air pocket lower is possible if 7,400 cash, about 7,460 to 7,468 ES, fails to hold.
Fade the supply shelf, respect the catalysts
The first overhead test is the 7,467 to 7,468 pivot, coincident with the lower dealer support strike. Above it, 7,485 to 7,497 marks the swing confluence, the gamma flip, and the 50% retracement at 7,493, then 7,505 to 7,520 and the 7,558 volatility inflection, a reclaim of which would neutralize the defensive posture. Support runs from 7,437 to 7,442, the settle and the 50-day, down through the 7,420 overnight low, the 7,385 first pivot, and the deeper 7,355 and 7,333 corrective targets.
The conditional path is a break-and-retest short below the 7,420 overnight low, targeting 7,385 then 7,355 with a stop back above 7,442; the upside conditional is a reclaim and hold above 7,497 to 7,500 on strong breadth, long toward 7,520 then 7,558 with a stop below 7,485. Stand aside in the final thirty to forty-five minutes before the close given the post-close chip earnings, and reduce size given tomorrow's inflation print. The most-likely path is a choppy, range-bound session with a downside skew: an early test of the 7,467 to 7,497 overhead that fails, a rotation back toward 7,420 to 7,437, and a guarded close as the market de-risks into the catalysts.
The complete data picture
For readers who want the full structure rather than the summary, here is the entire computed level map and the complete set of momentum, volatility, and positioning readings behind today's view.
| EXPECTED RANGE TODAY | |
| Low | 7,400 to 7,415 |
| Most-likely pivot | 7,450 to 7,460 |
| High | 7,500 to 7,510 |
One-ATR band off the settle frames about 7,335 to 7,540; the implied options band is tighter near 7,390 to 7,490. Thursday/Friday at-the-money implied volatility 20.3%.
Full session calendar. 08:30 Current Account and weekly mortgage applications (already released, applications +1%, 30-year 6.59%); 10:00 New Home Sales (consensus about 620,000 to 650,000) and the Conference Board Leading Economic Index; 10:30 weekly energy inventories; the bellwether chip earnings after the close; and the core inflation print tomorrow, the major macro event of the week.
AlgoIndex maps computed levels and the dealer-positioning backdrop every session. See the track record on the performance statement, learn the framework in our trading SPY signals guide, compare strategies on the pricing page, and grade every trade with the free AI Trading Journal.
Latest session: S&P 500 Turns Risk-On as Benign Inflation Clears the Way →
Foundational guides
New to S&P 500 futures? Start with What Are ES Futures, the ES, NQ, MES & MNQ point value and contract specs, gamma exposure (GEX) explained, and market internals: TICK, ADD, VOLD and VIX.



