
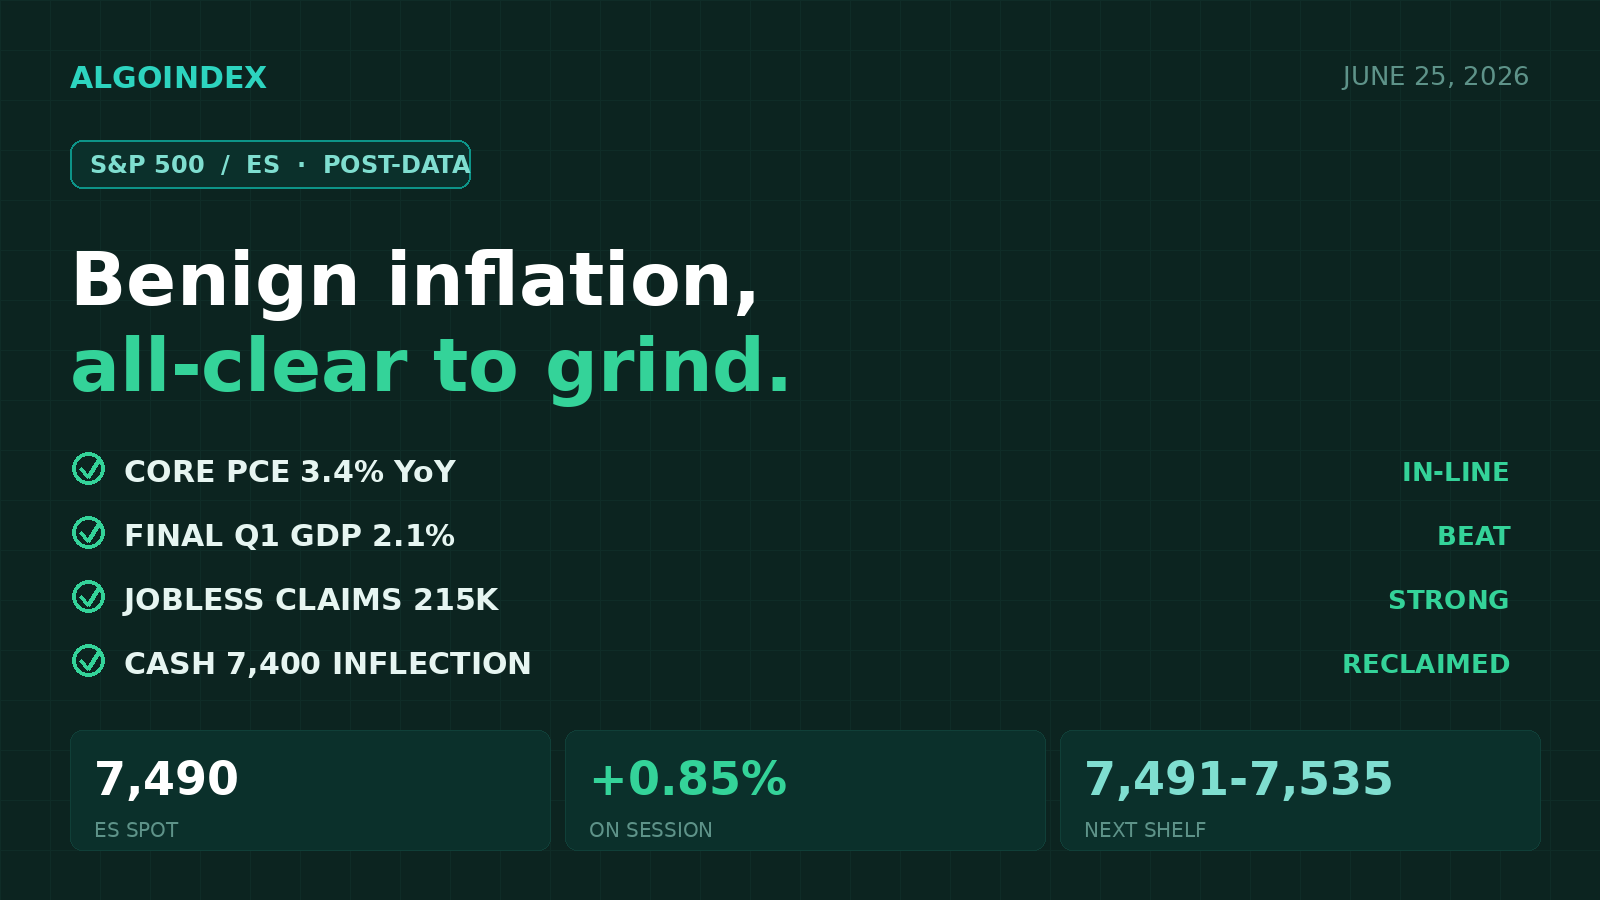
For a week the S&P 500 had been held hostage by one number. At 8:30 this morning it arrived, and it was benign: core inflation landed in-line to a touch cool, growth beat, and the labor market firmed. The event overhang that defined the pre-open setup is gone, and the E-mini has cleared the level that flips dealers from amplifying losses to dampening them.
The front-month contract extended its gain to roughly 7,490, up about 0.85 percent from Wednesday's 7,428.25 settle, pressing the first resistance gate at 7,491. The cash index repriced to roughly 7,423, clearing back above its volatility-inflection level near 7,400. That reclaim is structurally important: above that line, dealer hedging shifts from move-amplifying to move-dampening, removing the downside fragility that defined the pre-open. The overnight bid was a direct read-through from a strong memory-chip earnings result, up about 17 percent in pre-market, which lifted the entire chip complex and rippled hardest through the Nasdaq-100, up near 2 percent, while the broad index trailed near 0.6 percent.
The 8:30 scoreboard cleared the way
The inflation reading landed in-line to slightly cool while growth and labor came in firm, the constructive combination for equities. Core PCE was 3.4 percent year-over-year and 0.3 percent monthly, a hair under estimate; headline PCE was 4.1 percent year-over-year with a cooler 0.4 percent monthly versus a 0.5 estimate. Final first-quarter GDP beat at 2.1 percent against a 1.6 estimate, initial jobless claims fell to 215k versus 225k expected, personal income and consumer spending each rose 0.7 percent, and core durable goods rose 1.3 percent.
This is concentrated, single-name leadership rather than broad participation, which is constructive for headline index points but leaves the rally vulnerable if breadth fails to broaden beyond chips. Energy is the visible laggard, with the sector proxy down about 1.6 percent in sympathy with falling crude. The day's question shifts from direction to follow-through: whether the index can break and hold above the 7,491 to 7,500 shelf toward the second resistance pivot at 7,535.
A split average stack, compressed beneath supply
The moving-average stack is split, the signature of a short-term pullback inside a longer uptrend. Price near 7,473 is pinned between the rising 50-day beneath it at 7,437.88 and the 5-day and 20-day above it at 7,491.30 and 7,540.65, with the 100-day at 7,148.76 and 200-day at 7,056.86 well below. The 14-day relative strength is 49.35, dead neutral, leaving room in either direction, while the composite reads a soft 24 percent buy that has deteriorated from 100 percent a month ago to 32 percent a week ago to 8 percent yesterday, a clear loss of short-term momentum even as the longer signal stays constructive. The 14-day average true range is 106.11 points and the implied one-day move is about 0.63 percent, roughly 47 points.
The cash index's options positioning is the primary flow surface. The volatility-inflection sits at 7,400 cash (futures near 7,467), the dealer gamma flip at 7,370 cash (futures near 7,437), and a risk inflection recently raised to 7,380 because dealers hold negative positioning below it. The net dealer book is short, with call positioning near plus 2.6 billion against put positioning near minus 6.5 billion, so below the flip dealer hedging adds to moves rather than absorbing them. With price now above the 7,400 inflection, that mechanism works in reverse, supporting a controlled grind higher rather than an air-pocket lower.
Buy the continuation, watch the speakers
Overhead, the first gate is 7,491, reinforced by the 5-day average and the 50 percent retracement at 7,493, then the 7,517 to 7,531 second-deviation and 18-day cross, the 7,535 second pivot, the 7,540 four-week-high retracement and 20-day average, and the 7,574 third pivot beneath the 7,693.75 ceiling. Support runs from the 7,443 central pivot through the 7,389 first pivot and 7,365 one-deviation band, the 7,350 second pivot, and the 7,297 third pivot at the one-month low of 7,292.25, with the 7,000 cash magnet the stated downside objective into the month-end expiration.
The conditional path is now the lower-probability one: a failed-breakout fade only if the contract rejects the 7,491 to 7,500 shelf and loses the 7,443 pivot, opening 7,389 then 7,350 with a stop above 7,500. The remaining session risk is two policy-committee speakers in the afternoon and evening, plus positioning into the June 30 options expiration. Trade only after 9:45 ET once the opening range completes; a hawkish speaker surprise that pushes price back under 7,443 would shift the bias defensive.
The complete data picture
For readers who want the full structure rather than the summary, here is the entire computed level map and the complete set of momentum, volatility, and positioning readings behind today's view.
| EXPECTED RANGE TODAY | |
| Low (most-likely) | 7,420 to 7,440; hot-print tail 7,360 to 7,390 |
| Mid (fair value) | 7,470 to 7,480 |
| High (most-likely) | 7,510 to 7,540; cool-print tail to 7,575 |
Path A benign PCE continuation 40%, Path B hot-PCE reversal 35%, Path C in-line chop 25% (pre-data probabilities; Path A confirmed post-data).
Full session calendar. 8:30 AM (printed) Core PCE 3.4% YoY / 0.3% MoM, headline PCE 4.1% YoY / 0.4% MoM, final Q1 GDP 2.1% (est 1.6%), durable goods -4.5% (est -5%), core durable +1.3% (est +0.6%), personal income +0.7%, consumer spending +0.7%, initial claims 215k (est 225k, prior 226k); 1:00 PM 7-year note auction; 3:40 PM policy-committee speaker; 6:30 PM policy-committee speaker.
AlgoIndex maps computed levels and the dealer-positioning backdrop every session. See the track record on the performance statement, learn the framework in the trading SPY signals guide, compare strategies on the pricing page, and grade every trade with the free AI Trading Journal.
Next session: S&P 500 Sells the Breakout as Risk-Off Returns →
Foundational guides
New to S&P 500 futures? Start with What Are ES Futures, the ES, NQ, MES & MNQ point value and contract specs, gamma exposure (GEX) explained, and market internals: TICK, ADD, VOLD and VIX.



