
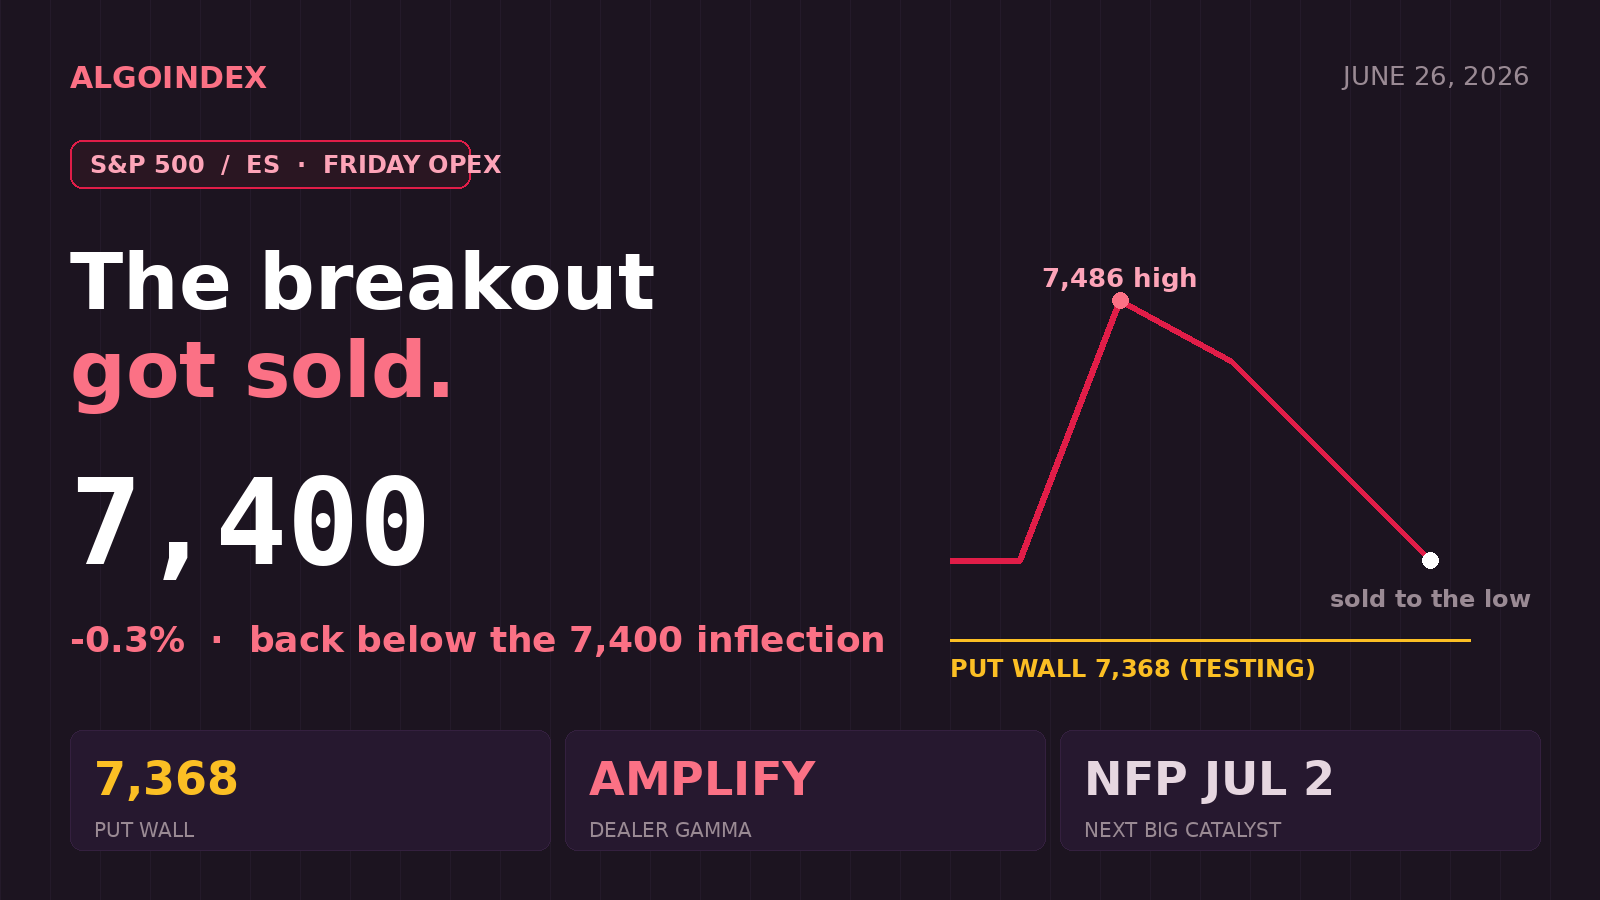
Yesterday a benign inflation print handed the S&P 500 a green light, and the rally lasted about an hour. Buyers who chased Thursday's gap were trapped: the cash index opened at its high of 7,419.08 and closed at 7,357.49, near the low of the day. This morning the market is finishing the job, back below the line that flips dealers from absorbing losses to amplifying them, sliding toward the wall of put options that has been quietly defining the range.
The front-month contract trades near 7,400, down roughly 0.3 percent versus Thursday's settle around 7,424, after holding a narrow 7,390 to 7,415 overnight band. The session is a clean reversal of Thursday's narrative. The Micron-led semiconductor squeeze that drove Wednesday into Thursday has fully unwound: the chip complex is selling off again, a report that a leading artificial-intelligence company may postpone its public listing is weighing on growth sentiment, and the Nasdaq-100 contract is leading lower by roughly 1.0 percent while the broad E-mini trails near minus 0.3 percent. Layer on a closely watched poll now showing more economists forecasting a Federal Reserve rate hike than a cut for the first time since 2023, and the macro overhang is decisively hawkish.
By closing back below the 7,400 cash volatility-inflection level, the index has re-entered move-amplifying territory, where dealer hedging adds to directional moves rather than absorbing them. It sits below the daily pivot near 7,433, below the dealer pivot at 7,448 (7,380 cash), and below the 50-day average equivalent at 7,433, having rejected the 7,486 to 7,494 supply shelf. The short-term directional system is firmly negative, with the 9-day directional index at 33.35 and negative movement at 33.07 far above positive at 11.28.
A breakout that opened high and closed low
Closing at the low of an outside range after opening at the high is the signature of distribution. The contract printed an intraday high near 7,486 during the morning pop and gave it all back, carving a confirmed lower high against the early-June peak near 7,688 (7,620.90 cash), the 52-week, 13-week, and one-month high. Price has since pressed back toward the lower half of the multi-week 7,300 to 7,500 range, and the five-day change is minus 1.91 percent. The longer-term picture stays constructive on an absolute basis, with price far above the 100-day at 7,128 and the 200-day at 6,993 and year-to-date up 7.48 percent, but the near-term momentum has clearly rolled over.
The momentum gauges agree. The 14-day relative strength is 45.74, below the neutral mark and sliding, with the 9-day at 40.84 and stochastics low (9-day percent-K 18.65). The multi-indicator composite reads 64 percent buy overall with strength strong but direction explicitly weakening, the 20-day and 50-day signals both reading sell while the longer crossovers stay buy. Volatility is compressed: the 14-day average true range is 92.23 points, historic volatility is 15.87 percent, and options-implied volatility sits at 16.12 percent, below realized. Compressed implied volatility into a Friday expiration raises the odds of a grind-and-pin character into the afternoon.
The dealer map, in two domains
The cash index's options positioning is the primary flow surface, and the 7:00 AM note refines it. The basis is confirmed at plus 68 points. Below the 7,400 cash inflection the index is in amplifying mode; the dealer gamma flip sits at 7,370 cash (7,438 ES) and the dealer pivot at 7,380 cash (7,448 ES), framed as bearish below and bullish above. The level the index is actively testing this morning is the 7,300 cash put wall (7,368 ES), reinforced by a dense combo-strike shelf at 7,299, 7,328, and 7,343 cash, all carrying conviction above 92.
The important nuance softens the bearish read. The dealer gamma index is negative on both the contract (minus 1.53) and cash (minus 0.60), but the index occupies a localized pocket of negative gamma with positive gamma building on either side. Rather than a clean short-gamma flush, the desk reads less downside momentum and genuine support forming near 7,100 cash, with the 7,000 cash absolute-gamma strike and the 6,900 cash collar the deeper magnets into the June 30 expiration, a zone the desk has signaled it would look to buy. The wild card is the technology complex, where implied volatility is trading below realized at the widest spread since 2003, a dislocation that historically resolves through sharp moves lower before relationships re-synchronize.
Fade the bounce, do not chase the hole
The cleanest expression is to sell a bounce into the dealer-pivot-to-volatility-trigger zone rather than chase weakness into the put wall, where the positive gamma building below argues against shorting directly into support. A failed retest of 7,448 to 7,468 ES that rejects with weak internals is the setup; a sustained reclaim and hold above 7,468 to 7,478 with strong internals flips dealer hedging back to dampening and negates it.
The conditional path is a reclaim long: if the contract reclaims and holds above 7,468, the amplifying-mode fragility neutralizes and short-covering can carry price toward 7,478, then 7,494 and 7,529, with a stop below 7,438 and smaller size, since it fights the prevailing down-tilt. The de-escalation narrative that supported risk earlier in the month is also fraying, with Iran turning back three tankers attempting an unauthorized Strait of Hormuz passage and Israel dropping leaflets on a southern Lebanese town, the first such order since the ceasefire. With no first-order US data today and a Friday expiration in play, the base case is a test and initial hold of the 7,368 put wall, a bounce attempt off the positive-gamma support, then a two-way fight beneath the 7,448 pivot, with the bears favored to press the wall again into the afternoon. The forward calendar is what matters most: it is front-loaded next week, with month-end and quarter-end rebalancing Tuesday, ISM manufacturing Wednesday, the June payrolls report moved up to Thursday July 2, and a full holiday Friday July 3, a setup that argues for a de-risking drift.
The complete data picture
For readers who want the full structure rather than the summary, here is the entire computed level map and the complete set of momentum, volatility, and positioning readings behind today's view.
| EXPECTED RANGE TODAY | |
| Low (most-likely) | 7,380 to 7,391; break toward 7,306 then 7,168 |
| Mid (pivot / fair value) | 7,415 to 7,434 |
| High (most-likely) | 7,467 to 7,486; reclaim and short-cover toward 7,494 to 7,529 |
Path A fade-the-bounce continuation lower 45%, Path B put-wall hold and chop 35%, Path C reclaim and squeeze 20%.
Full session calendar. 10:00 AM consumer sentiment, final reading (second-order); intraday potential Federal Reserve speaker commentary (headline risk); 4:00 PM Friday weekly options expiration (0DTE max-pain 7,400 cash). The forward calendar is front-loaded next week: Monday June 29 quiet with month-end positioning; Tuesday June 30 month-end and quarter-end rebalancing plus quarterly options expiration; Wednesday July 1 ISM Manufacturing PMI at 10:00 AM; Thursday July 2 the June Employment Situation (Nonfarm Payrolls) at 8:30 AM, moved up from Friday, with the bond market closing early at 2:00 PM; Friday July 3 a full market holiday for Independence Day.
AlgoIndex maps computed levels and the dealer-positioning backdrop every session. See the track record on the performance statement, learn the framework in the trading SPY signals guide, compare strategies on the pricing page, and grade every trade with the free AI Trading Journal.
Foundational guides
New to S&P 500 futures? Start with What Are ES Futures, the ES, NQ, MES & MNQ point value and contract specs, gamma exposure (GEX) explained, and market internals: TICK, ADD, VOLD and VIX.



