
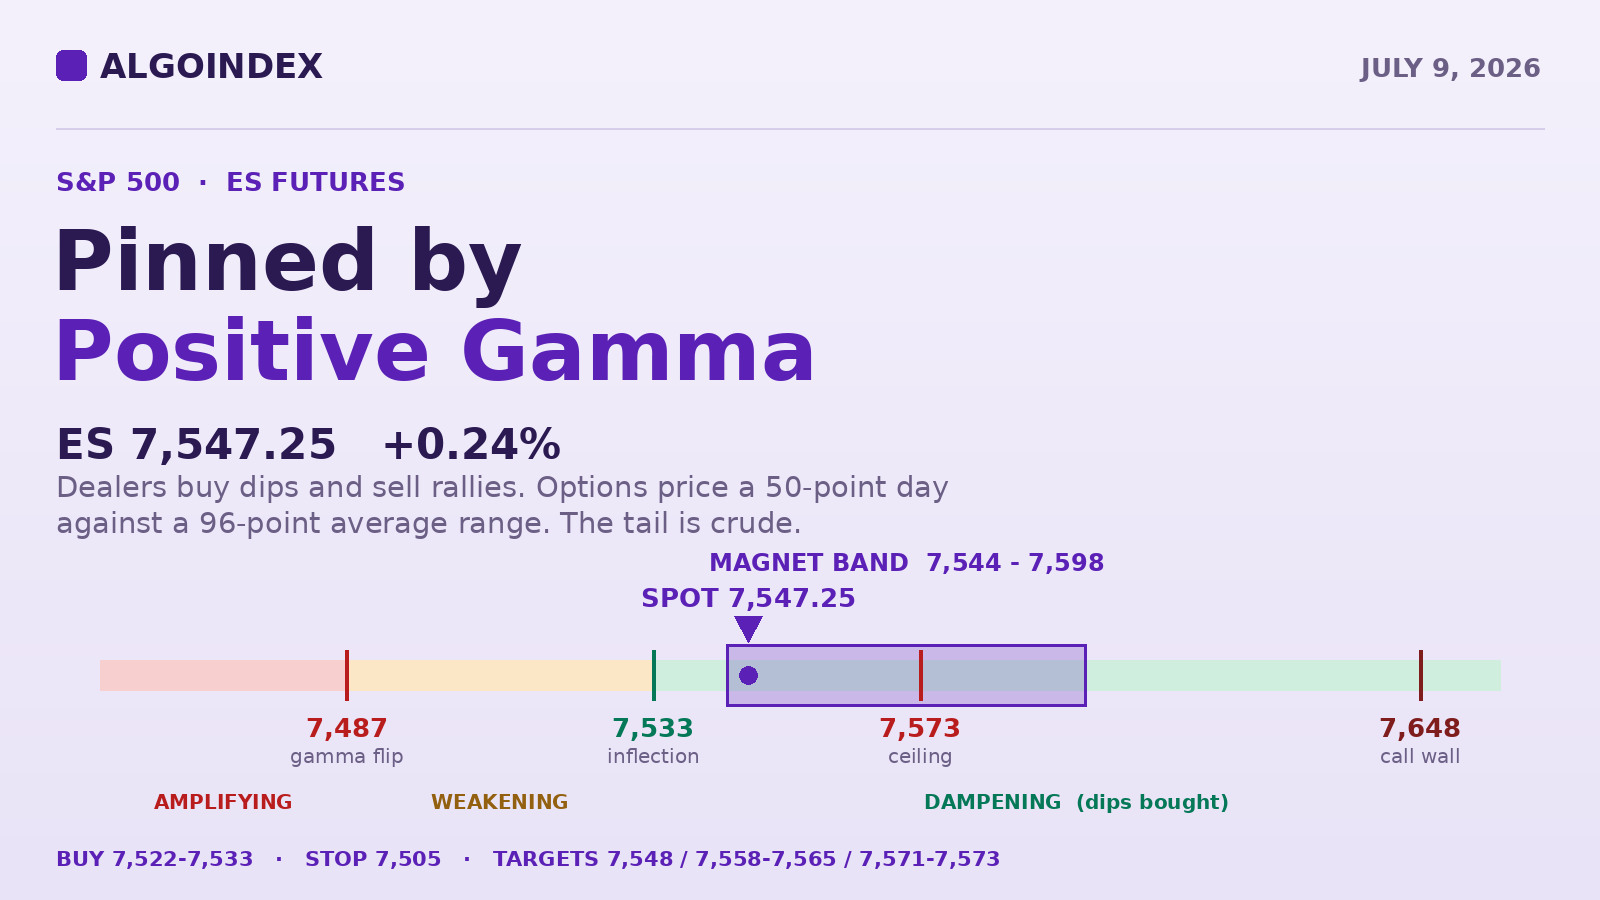
ES trades 7,547.25, up 0.24 percent, after Wednesday's escalation day printed a five-day low at 7,468.50 and buyers took it back by roughly 60 points into the settle. Heavy positive dealer gamma (6.79 billion call-side against negative 2.53 billion put-side) is pinning price inside a magnet band, and options price a 50-point day against a 96-point average range. The plan: buy weakness into the dense 7,522 to 7,533 shelf rather than chase the 7,548 to 7,558 supply overhead. Bias constructive but rotational, conviction moderate. The tail is crude.
Between the drone strikes that hit an LNG carrier and two oil tankers off the Omani coast, and the moment New York walked in this morning, the market made a decision. The United States ended the waiver on Iranian oil sales and struck Iran. Iran struck Bahrain and Kuwait. The President said the interim understanding is finished. Brent moved back toward 80 dollars. And equities are bid, Europe is outperforming, and chipmakers have rallied across every region.
In yesterday's note we set 7,470 as the first downside target and said dips were still being bought. Wednesday tagged 7,468.50, the lowest print in five sessions, and could not hold it, recovering about 60 points into the close. That is the single most informative data point on the board this morning. Sellers had a genuine catalyst, took price to a five-day low, and gave it straight back. What did that is not conviction. It is positioning.
Sellers had a catalyst and could not hold it
Wednesday traded down to 7,468.50 on the escalation and recovered roughly 60 points to settle 7,528.75. The low was made and rejected, not accepted. Overnight, Globex opened 7,517.25, immediately dipped to 7,516.25, and never revisited it, grinding a low-slope advance through Asian and European hours to tag 7,558.00 before easing into the New York morning. Volume of 170,986 contracts is unremarkable for a session with no first-order domestic print, and open interest stands at 1,934,986. Right now the 15-minute chart shows a narrow consolidation between 7,543.25 and 7,548.00, bid 7,544.75 against offer 7,545.00, a one-tick spread. That is orderly two-way liquidity, not a positioning imbalance into the bell.
Zoom out and the structure is constructive. ES sits 1.83 percent beneath its 52-week and record high of 7,693.75 from June 2, with the one-month high at 7,648.75 and the one-month low at 7,292.25 placing price at roughly 71 percent of the monthly range, upper portion but not extended. The contract holds above the 20-day (7,507.42), 50-day (7,496.55), 100-day (7,194.06), and 200-day (7,087.98), and it is up 8.00 percent year to date. The moving-average sequence is unambiguously bullish, 5-day over 20-day over 50-day over 100-day over 200-day. The only average price does not hold is the 5-day at 7,550.50, three points overhead, and reclaiming it is the minimum requirement for the short-term impulse to turn back up.
Momentum will not confirm. The 14-day directional index reads 19.19, beneath the 20 threshold that separates trending from non-trending conditions, and the negative directional line at 20.70 sits above the positive at 13.83 across the 9-, 14-, 20-, 50- and 100-day windows. That is a persistent structural feature, not a one-day artifact: directional pressure is mildly negative even as price advances, the fingerprint of a grind higher on absorbing supply rather than a demand-led impulse. The multi-indicator composite reads 56 percent buy with its direction component at the weakest end of its band, decomposing to 40 percent buy short-term against 75 percent medium-term and 67 percent long-term. Historic volatility is compressed, 9.22 percent on the 9-day against 14.46 percent on the 20-day. The higher-timeframe uptrend is intact. The short-term impulse has stalled. Price is grinding, not driving.
Two lines decide the character of the day
Positive dealer gamma dominates the index and its largest constituents. Index call-side gamma stands at 6.79 billion against put-side gamma of negative 2.53 billion, with gamma tilt 1.082, gamma notional of positive 317.483 million, and index gamma exposure at the E-mini level of 0.897. Dealers long gamma sell strength and buy weakness to stay hedged. That mechanically compresses realized movement and pulls price toward strike concentrations, which is exactly the pattern Wednesday produced, early lows reverting to opening highs. Note the nuance: the tracking ETF shows negative gamma with notional of negative 589.393 million, and the Nasdaq tracking fund is likewise negative, so the dampening effect is concentrated in the cash index rather than uniform across vehicles.
Support is real, but it is mechanical, not fundamental. Mechanical support does not survive a large enough shock.
The other half of the story is what options cost. One-month implied volatility at 13.45 percent now sits beneath one-month realized at 14.85 percent. The implied-volatility rank is a depressed 20.05 percent, the skew rank 52.57 percent, the 25-delta risk reversal on the cash index negative 0.048, and one-month implied correlation has reached two-year lows, which the desk flags as a risk-off alert threshold. Options are cheap in absolute and relative terms, correlation is depressed, and there is an active military exchange underway. That is an asymmetric configuration: the cost of protection is low precisely when the case for it is not. Put volume of 853,751 exceeds call volume of 636,375, and put open interest of 12.989 million against call open interest of 9.608 million gives a put-to-call ratio of 1.28. Under the surface, leading artificial-intelligence call skews are coming in while put skews steepen, particularly in memory names. The dominant position is short puts, which is what supplies dealers the positive gamma in the first place.
Where the magnets are
Options concentrations behave like magnets under positive gamma, and today price is sitting inside the densest concentration of them on the board. Translated to E-mini terms, the immediate magnetic band runs 7,544 to 7,598. The cash 7,550 node carries 98.28 percent confidence, cash 7,528 carries 97.41, and cash 7,573 carries 95.92. That is why the market has stalled exactly here.
Lower architecture: 7,430 (96.29), 7,400 (96.05), 7,348 (96.40), 7,303 (97.93). Upper: 7,647 (96.69).
A hawkish minority, a narrow bid, and an unresponsive barrel
Wednesday's June policy minutes showed all participants supported holding the target range at 3.50 to 3.75 percent, but a few judged there was a case for raising rates in June. That hawkish minority is the detail the market has under-priced. Most participants discussed scenarios in which inflationary pressures dissipate and inflation soon returns toward 2 percent, and almost all of those said it would then be appropriate to maintain or eventually lower rates. The disinflation evidence is accumulating: private-sector average hourly earnings growth slowed to 3.5 percent year over year in June, down 0.2 points since the start of the year and 0.4 since mid-2025, manufacturing input prices fell in June after three consecutive monthly increases, and both manufacturing and services prices-paid components dropped to their lowest since February 2026. Against that, the June labour report was a shock, payrolls at 57,000 against a 113,000 forecast with the prior month revised from 172,000 down to 129,000. A weakening labour market with easing pipeline prices argues for cuts; a hawkish minority and an oil shock argue against. Both are live. This morning's Fed remarks concern the ample-reserves framework and stablecoin effects on reserve demand, which is plumbing rather than policy.
"The conflict appears to be intensifying and oil has, so far, been unresponsive. That non-responsiveness is the tell. If crude breaks decisively above the low-80s while equity futures hold their bid, the divergence resolves, and history says it resolves toward the commodity."
Persian Gulf flows had recovered above 80 percent of pre-war levels shortly after the Strait of Hormuz reopened, but have slipped into the low-70 percent range following the latest attacks. Exports through Hormuz rebounded to roughly 10 million barrels a day, about half pre-war levels, before falling back to approximately 8.3 million. The binding constraint appears to be Iranian willingness to permit a full recovery in flows, not physical transport capacity. The outlook is explicitly two-sided: continued talks, restoration of the oil waiver, and improved security assurances could see flows recover by end-July, while failed negotiations and further escalation could see Gulf flows fall again. Leadership, meanwhile, has narrowed to technology and semiconductors, with the Nasdaq-100 E-mini higher by roughly 0.9 percent against the S&P E-mini's 0.24 percent. The broadening trade that underpinned the advance from the April low at 6,820.00 has stalled for a second time. A rally led by the largest constituents against a stalling equal-weight cohort is a late-stage consolidation feature, and it aligns with the directional index beneath 20. Narrow leadership is a fragility, not a strength.
Cross-asset, the volatility index at 16.76, higher by 0.42 percent, is a strikingly muted response to an active military exchange. The cash index trades 7,501, up 0.28 percent, the Nasdaq-100 cash index 29,524, up 0.97 percent. Euro-dollar has held up well given the jump in oil, with euro swap rates rising roughly 7 to 8 basis points more than short-dated dollar rates on the view that the European Central Bank is more likely to hike in September, currently priced at 22 basis points. Its June 11 minutes land today and are expected to read hawkish. United Kingdom two-year yields posted their largest move since March, sterling is outperforming, and the Swiss franc is underperforming.
The trade: buy weakness, do not chase strength
Price holds above the volatility inflection level at 7,533 and well above the gamma flip at 7,487, the mechanical condition under which dealer hedging buys dips and sells rallies. The support architecture beneath spot is exceptionally dense: four independent reference points inside 17 points, the inflection at 7,533, the prior settle at 7,528.75, the daily pivot at 7,520.08, and the overnight low at 7,516.25. Buy the 7,522 to 7,533 zone and scale in. Do not chase above 7,540 on the first attempt, because price is already inside the 7,548 to 7,558 supply shelf with the 5-day at 7,550.50 directly overhead. Stop 7,505, structural, beneath the overnight low and the 20-day but above the gamma flip, so the trade is wrong before the mechanical environment changes. That is the correct sequencing, and it puts risk near 22 points from a mid-zone entry.
Take partial profit at 7,548, the cash 7,500 concentration strike and a 95.49-confidence magnet at the lower edge of the supply shelf, about 21 points and roughly 1:1. Then 7,558 to 7,565, the overnight high and second-standard-deviation resistance, about 33 points and roughly 1:1.5. Bank the remainder at 7,571 to 7,573, where the first pivot resistance and third-standard-deviation resistance form the dense four-way confluence, about 44 points and roughly 1:2. A sustained 15-minute close beneath 7,516.25 closes the constructive structure and shifts focus to the 7,496 to 7,507 average confluence. A loss of 7,487 is a separate and more serious event, flipping the mechanical environment from dampening to amplifying, and should be treated as a reason to be flat or short rather than to average down.
The conditional short is the mirror trade on the same map, lower conviction. Trigger on a first-attempt rejection at 7,565 to 7,573, defined as a 15-minute close back beneath 7,565 after trading into the band. Four resistance references converge in eight points, and the directional index at 19.19 with the negative line above the positive argues first-attempt breakouts fail in this environment. Enter 7,563 to 7,570 on the rejection close, stop 7,580, targets 7,548 then 7,533, roughly 1:1 to 1:2. Take it off into the inflection level; do not press a short beneath 7,533 while positive gamma is buying dips. Stand aside entirely if crude breaks decisively above the low-80s during the cash session, if the volatility index breaks above 19, if price opens beneath 7,516.25 and fails to reclaim it within thirty minutes, if price gaps above 7,573 at the bell, or if a material Middle East headline lands inside the first thirty minutes. There is no edge in trading the first impulse of a geopolitical repricing.
The domestic calendar is effectively empty. Positioning and geopolitics set price today.
Path C carries the fattest tail: implied volatility is cheap and correlation sits at two-year lows.
Heavy positive gamma suppresses movement right up until it does not. Today sits comfortably inside the dip-buying window, and the window is not open indefinitely.
The complete data picture
Every level and reading from the morning ES review. Levels in E-mini terms, cash-index equivalent in parentheses; front-month basis about 46 points. Nothing rounded away.
| Resistance (top to bottom) | Support (top to bottom) |
|---|---|
| 7,756 upper volatility inflection (cash 7,710) | 7,533 volatility inflection level |
| 7,693.75 record and 52-week high; 7,666.17 third pivot resistance | 7,528.75 prior settle |
| 7,648 primary call concentration (cash 7,600); 7,648.75 one-month high | 7,520.08 daily pivot; 7,516.25 overnight low |
| 7,614.58 second pivot resistance | 7,507.42 20-day; 7,498 cash 7,450 strike; 7,496.55 50-day |
| 7,596 to 7,602 cash 7,550 strike (ES 7,598), week high 7,602.50 | 7,487 dealer gamma flip (cash 7,439, pivot 7,440) |
| 7,565 to 7,573 two-SD 7,565.18, cash 7,520 strike (ES 7,568), first pivot 7,571.67, three-SD 7,573.37 | 7,477.17 first pivot support; 7,468.50 Wednesday and five-day low; 7,448 cash 7,400 strike |
| 7,548 to 7,558 cash 7,500 strike (ES 7,548), 5-day 7,550.50, one-SD 7,554.51, overnight high 7,558.00 | 7,428 four-week retracement; 7,425.58 second pivot; 7,382.67 third pivot; 7,348 primary put concentration (cash 7,300); 7,048 primary gamma concentration strike |
Mechanical support is real support, until the shock is big enough.
See how AlgoIndex turns this kind of read into systematic signals. Read yesterday's ceasefire risk-off note and the pillar on how dealer call and put walls behave.
View pricing


