
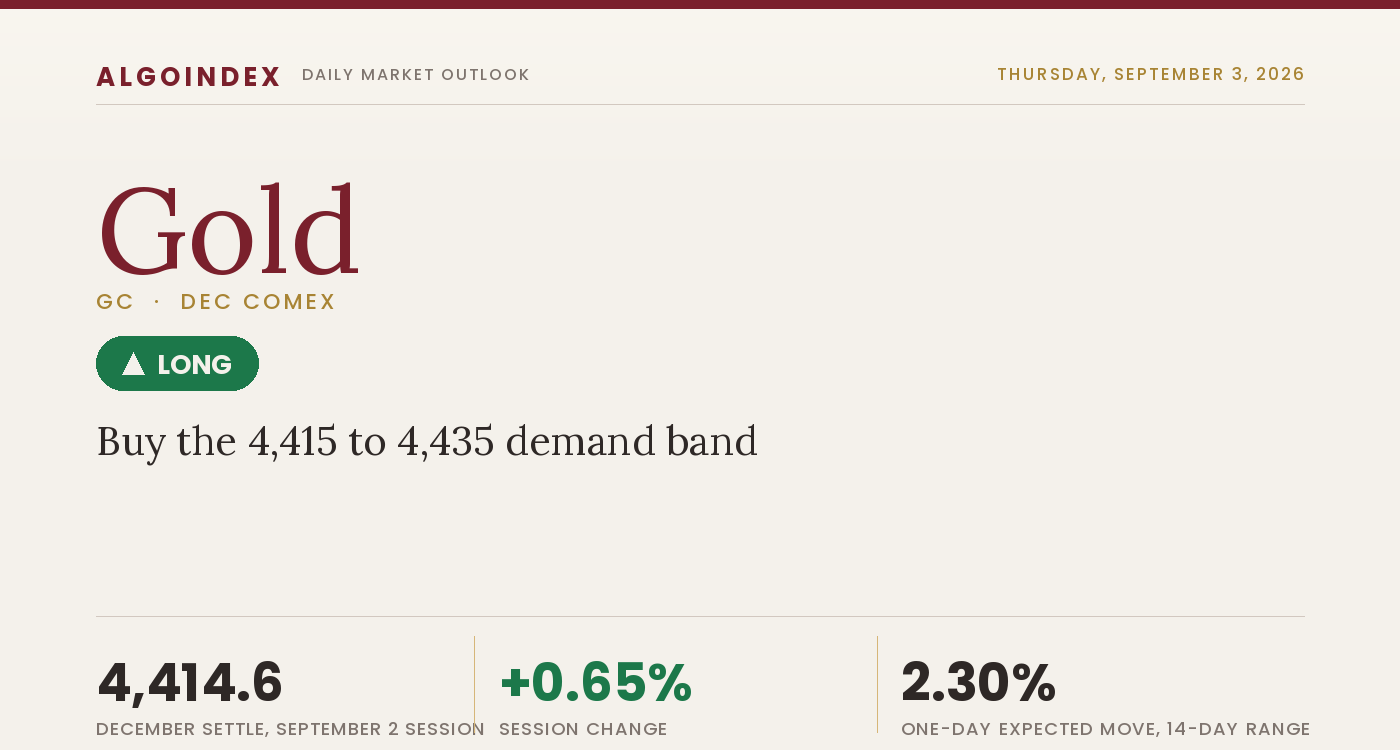
Gold turned a lower session into a constructive one on Wednesday, and the shape of the day matters more than the size of the gain. The December contract settled at 4,414.6 after an intraday reversal off a fresh five-session low near 4,329.2, and the benchmark closed up 0.65 percent at 4,419.71, a gain of 28.63. Futures were pressed to the lowest print in a week during the morning, absorbed the selling, and closed back near the upper third of the range, the profile of a support test that held rather than a trend that resumed lower. The driver was the interest-rate and currency complex, not fear. The dollar index sat at 99.48, softer on the day and extending two consecutive monthly declines, and the 10-year yield eased to 4.78 percent off its highs. A weaker dollar and lower nominal yields are the two most reliable tailwinds for gold, and both were present.
Layered on top was a renewed geopolitical premium out of the Persian Gulf, where Wednesday-afternoon headlines pointed to escalating US and Iran tension around the Strait of Hormuz. That the metal rose even as equity-market volatility fell about 7 percent to 15.19 and stocks gained is an unusual pairing that signals a rate-and-dollar led bid rather than an outright risk-off flight. The contradiction heading into Thursday is the calendar. Gold is bouncing into the most important macro window of the month: Friday brings US nonfarm payrolls, and a September 16 Federal Reserve meeting is priced at better than a 60 percent probability of a rate increase, an unusually hawkish backdrop for a rising gold price. Thursday itself is a pre-payrolls positioning session carrying jobless claims, the ISM Services survey and three Fed speakers, so the tension is a supportive rate-and-dollar backdrop against a hawkish policy risk that a single strong data point could reassert.
A reversal off the five-session low into a hawkish calendar
The daily picture is a corrective consolidation inside a longer uptrend. Gold set its 52-week high at 5,781.8 on January 29 and has since worked 22.8 percent lower, a deep but orderly retracement, with a local high of 4,755.0 on August 25 giving way to a 9.0 percent slide into the 4,329.2 low and now a reversal attempt from it. Wednesday's candle is a bullish reversal bar off a five-session low, the kind of print that frequently marks a short-term base when it forms at confluence. The settlement at 4,414.6 sits just above the standard pivot at 4,396.1, keeping price on the constructive side of the calculated midline. The moving-average stack is jumbled, which is itself the signal that this is consolidation rather than a clean trend, and the reclaim of the 100-day near 4,457.6 is the most encouraging near-term detail.
Momentum is neutral with a short-term-oversold tilt that supports a bounce. The 14-day relative strength index reads 51.15, essentially neutral, with the 9-day at 46.75 and the 20-day at 52.30. Short-term stochastics are depressed, the 9-day and 14-day percent-K both near 19 to 20, consistent with a market rebounding from a washed-out condition. The directional system still leans mildly negative on the medium horizon, the 14-day directional index at 27.21 with the negative directional line at 23.61 above the positive line at 18.98, and the 9-day directional index at 35.04 confirms a recent down-leg that Wednesday's reversal is now working against. Historic volatility on the 14-day window is 23.69 percent, and the multi-indicator composite is a weak buy at 16 percent, a reading that sits between a sell a week ago and a firmer buy a month ago with the longer-run signal still constructive.
The 4,415 to 4,435 shelf and the 4,463 to 4,468 ceiling frame Thursday
Two areas frame Thursday. The immediate ceiling is the 4,463 to 4,468 shelf, a confluence of the overnight high at 4,466.2, the first computed resistance pivot at 4,462.9 and the 1 standard deviation band at 4,468.0, and it is the pivot the reversal must convert to keep the bid intact. Above it, 4,490 is the 2 standard deviation resistance and the 4,507 to 4,511 zone stacks the 3 standard deviation band at 4,507.0 with the second computed resistance pivot at 4,511.3, forming the first supply shelf and the logical first objective; higher still, 4,517 to 4,529 pairs the 38.2 percent marker at 4,516.8 with the 18-day crossover at 4,528.8, then 4,566 marks the 9-day crossover and 4,755.0 the August high. Beneath price the first support is the overnight-open shelf near 4,436 and then the 4,414.6 settlement, with the standard pivot at 4,396.1 the line separating the constructive read from a neutral one. Below that, the first computed support at 4,347.7, the 1 standard deviation support at 4,361.2 and the 2 standard deviation support at 4,339.2 lead into the critical structural support at 4,321 to 4,329, where the 3 standard deviation band, the 40-day crossover and the reversal low converge; a decisive loss there would void the bullish reversal and open the 4,280.9 and 4,232.5 pivots.
Buy the shelf, respect 4,393, size it down
The plan buys a controlled pullback into the 4,415 to 4,435 shelf, a retest of the settlement and overnight-open support, rather than chasing the overnight extension into the 4,463 to 4,468 ceiling. The stop is 4,393, below the 4,396.1 standard pivot and the reversal structure, about 32 points from a 4,425 fill. Targets run to 4,490 at the 2 standard deviation resistance, then 4,511 at the second computed pivot and 3 standard deviation band, then an extended 4,566 at the 9-day crossover, worked only if momentum carries through the second target on volume, for reward-to-risk near 1 to 2.0, 1 to 2.7 and 1 to 4.4. Two conditions govern the trade in real time. The 8:30 AM ET jobless claims and the 10:00 AM ET ISM Services survey, specifically its prices-paid subindex at a prior 70.3, are the intraday pivots: a hot prices-paid read can firm the dollar and press the metal back toward the 4,414 shelf and, on a break, the 4,396 pivot, while a soft services read likely carries gold toward 4,490 and possibly 4,511. The macro override that argues for standing back is a hot ISM prices-paid print or a hawkish Waller and Goolsbee lean that lifts the dollar and yields, or a sudden Persian Gulf de-escalation, any of which would cap the bounce near the 4,468 shelf. Position at half size given that Friday nonfarm payrolls sit two sessions out. Our published record lays out how we grade these calls.
Wednesday turned a lower session constructive: a reversal off the 4,329.2 five-session low to a 4,414.6 settlement, rate-and-dollar led with the dollar below 100 and the 10-year at 4.78 percent. The reclaim of the 100-day at 4,457.6 is the encouraging detail, and the 4,463 to 4,468 shelf is the pivot the reversal must convert. Buying pullbacks into the 4,415 to 4,435 shelf toward the 4,490 to 4,511 supply band, half size into Friday payrolls, is the trade.
A bullish reversal off a five-session low, rate-and-dollar led, bouncing into a hawkish payrolls week. The edge is buying the 4,415 to 4,435 shelf toward the 4,490 to 4,511 supply band, and a sustained trade back below the 4,396.1 pivot is the line that flips the read from long to sidelined.
This is the read our members get every session, before the bell, with the levels drawn and the setup defined. See how the same dealer-positioning work turns into systematic signals.
View pricingThe complete data picture
Every number behind Thursday’s plan, charted first; the full numeric reference follows underneath.
Full numeric reference, every remaining figure from the review
| Average | Value | Settle vs |
|---|---|---|
| 5-day | 4,456.2 | below by 41.6 |
| 20-day | 4,513.4 | below by 98.8 |
| 50-day | 4,291.0 | above by 123.6 |
| 100-day | 4,457.6 | below by 43.0 |
| 200-day | 4,642.7 | below by 228.1 |
| Level | Reference |
|---|---|
| 5,781.8 | 52-week high, set January 29, a distant reference |
| 4,758.0 | half retracement of the yearlong range, a distant upside marker |
| 4,755.0 | August 25 swing high, the one-month high and the extended objective |
| 4,642.7 | 200-day average, well overhead |
| 4,578.1 | third computed resistance pivot |
| 4,566.0 | 9-day moving-average crossover, the extended target |
| 4,528.8 | 18-day moving-average crossover |
| 4,516.8 | 38.2 percent retracement marker |
| 4,513.4 | 20-day average, overhead |
| 4,511.3 | second computed resistance pivot, the second target |
| 4,507.0 | 3 standard deviation resistance band |
| 4,490.0 | 2 standard deviation resistance, the first target |
| 4,468.0 | 1 standard deviation resistance band |
| 4,466.2 | overnight session high, the ceiling to convert |
| 4,462.9 | first computed resistance pivot |
| 4,457.6 | 100-day average, reclaimed near price |
| 4,456.2 | 5-day average, right at price |
| 4,436.0 | overnight-open shelf and first support, the top of the buy band |
| 4,415 to 4,435 | buy shelf, the long entry, a retest of the settlement and overnight-open support |
| 4,414.6 | December settle |
| 4,396.1 | standard pivot point, the constructive line |
| 4,361.2 | 1 standard deviation support |
| 4,347.7 | first computed support pivot |
| 4,339.2 | 2 standard deviation support |
| 4,329.2 | reversal low, the five-session low, target-area invalidation |
| 4,322.2 | 3 standard deviation support band |
| 4,320.8 | 40-day moving-average crossover |
| 4,291.0 | 50-day average, rising beneath price |
| 4,280.9 | second computed support pivot |
| 4,232.5 | third computed support pivot |
| Metric | Reading |
|---|---|
| Gold-ETF proxy price | 396.82, the end-of-day close updated for September 2, the positioning reference for the metal |
| Call-side dealer gamma | about negative 309 million, a net short call-gamma posture |
| Put-side dealer gamma | about positive 146 million, the smaller leg |
| Net configuration | net short gamma, which tends to amplify directional moves rather than pin price, consistent with the sharp intraday reversal and the clean overnight extension |
| Volatility inflection level | near the 413 proxy strike, mapping to roughly the 4,600 area in gold at the current eleven-to-one ratio, above the market and consistent with a breakout gathering pace once it clears the near-term supply band |
| Dealer-supported strikes above market | the 410 to 440 proxy band, or roughly 4,565 to 4,900 translated to gold |
| Downside reference strikes | the 395 and 380 proxy strikes, or roughly 4,400 and 4,233 translated to gold |
| Top expiry concentration | the heaviest gamma and delta expirations concentrate at the September 18 monthly expiration, about two weeks out |
| Input | |
|---|---|
| Dollar | the dollar index closed near 99.48, softer on the session and lower for two straight months, the pivotal daily driver working in gold favor as long as it stays capped below the 100 handle |
| 10-year yield | the nominal 10-year yield eased to 4.78 percent, down on the day and off its highs, a real-rate pullback that supports a non-yielding asset |
| Fed and policy | markets price better than a 60 percent probability of a rate increase at the September 16 meeting, with three Federal Reserve speakers Thursday, Waller at 8:30 AM ET, Hammack at 3:00 PM ET and Goolsbee at 3:55 PM ET, any hawkish lean a same-day dollar risk |
| Geopolitics | a renewed Persian Gulf risk premium, with Wednesday-afternoon headlines on escalating US and Iran tension and control of the Strait of Hormuz, supports gold directly as a haven and indirectly through the energy-inflation channel |
| Crude oil | US crude settled at 91.01, higher by 0.88 percent, and the international grade at 95.63, higher by 1.04 percent, with European natural gas sharply higher on Gulf supply concerns, feeding the inflation-hedge case |
| Equities and volatility | the broad-market volatility index fell about 7 percent to 15.19 and US equities rose modestly, an unusual pairing with a gold gain that confirms a rate-and-dollar bid rather than a fear trade |
| Central-bank demand | no fresh official-sector purchase data crossed the wires, leaving structural reserve accumulation a slow-moving background bid beneath the multi-year uptrend rather than a Thursday catalyst |
| Positioning | no new weekly positioning report was released, the standing read being that speculative length was trimmed during the week-long slide from 4,755 into the 4,329 low, reducing the overhang of stale longs |
| When | Event |
|---|---|
| Thu Sep 3 | a pre-payrolls positioning session, jobless claims and Fed governor Waller at 8:30 AM ET, the final US services index at 9:45 AM ET forecast at 56.8, the 10:00 AM ET ISM Services survey forecast at 54.1 with its prices-paid subindex at a prior 70.3, and Fed speakers Hammack and Goolsbee in the afternoon |
| Fri Sep 4 | US nonfarm payrolls at 8:30 AM ET, consensus 55,000 against a prior negative 23,000, the decisive forward catalyst for the rate path and the September 16 meeting |
| Mon Sep 7 | a US market holiday |
| Thu Sep 11 | the consumer price index, the next major inflation print framing the balance of the month |
| Sep 16 to 18 | the Federal Reserve decision on September 16 and the monthly options expiration on September 18, coinciding with top gamma and top delta expiry for this complex |
The economic releases referenced above are published on the official government calendars below. Price levels are derived from standard technical and statistical methods, and the market read is AlgoIndex's own analysis. How we grade these calls is set out in our performance methodology.
- US Bureau of Economic Analysis, Personal Income and Outlays (PCE)
- US Bureau of Economic Analysis, Gross Domestic Product
- US Bureau of Economic Analysis, release schedule
- US Census Bureau, Advance Durable Goods (M3) release schedule
- US Energy Information Administration, Weekly Petroleum Status Report
- US Department of the Treasury, auction schedule and results
- AlgoIndex performance methodology



