
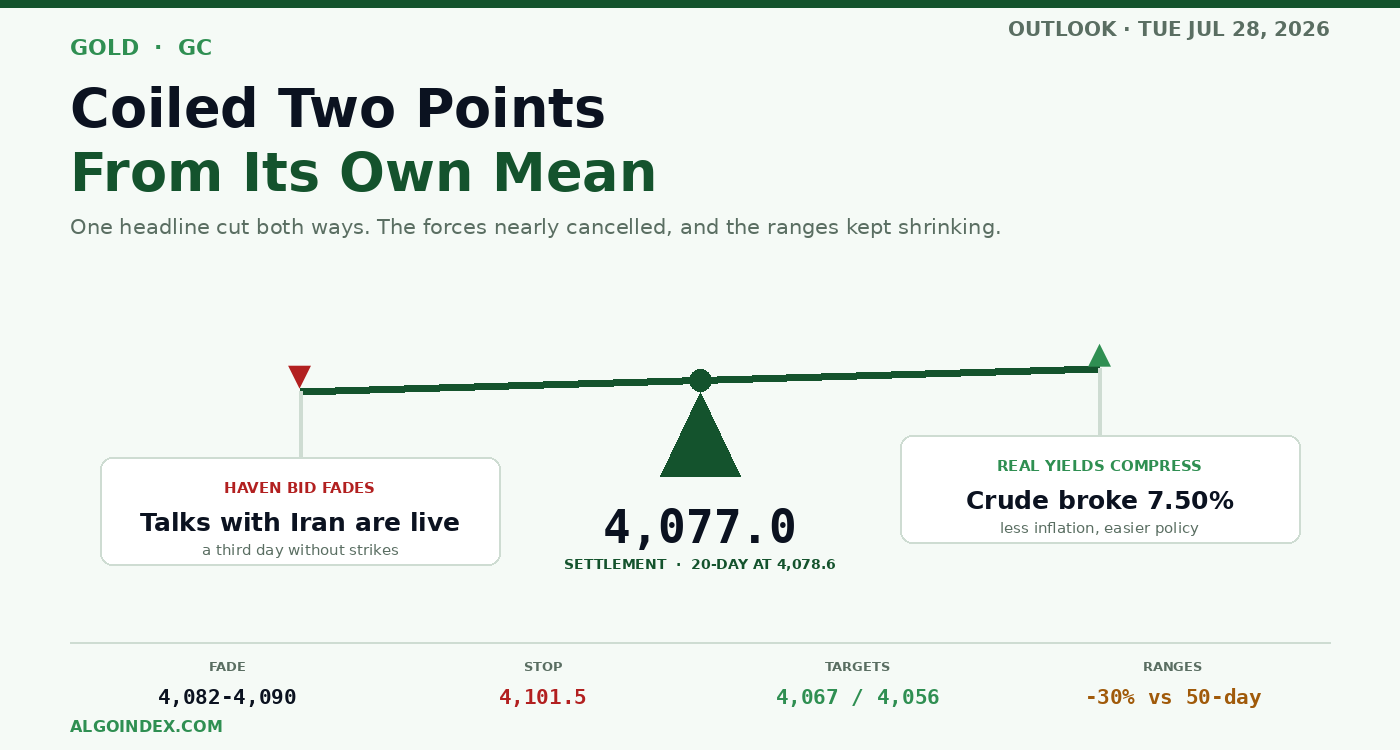
The August gold contract closed Monday at 4,077.0. The move itself barely registers. What it happened alongside is the part worth stopping on: crude oil fell 7.50 percent, one of its worst days of the year, and the dollar edged up rather than down. A metal that gains ground while the market's main inflation input caves and the currency firms is being bought for something other than the inflation hedge.
Both markets moved on the identical headline. Just past noon, word came from the administration that discussions with Tehran are live and that terms could be reached, a third straight day without strikes. Energy treated that as permanent and stripped the conflict premium out on the spot. Gold couldn't, because the same de-escalation cuts two ways for the metal. Less war premium means less inflation, which pulls the easing case forward and compresses real yields. Two forces pointing opposite directions, and on Monday they came within a whisker of cancelling each other.
The result is a market pinned almost exactly on its own mean. Friday's note framed the same tension as a live catalyst sitting on a corrective chart. Three sessions later the chart has stopped moving and the catalyst has a date on it.
Two points from the 20-day, and the ranges are closing
Settlement came in at 4,077.0. The 20-day average marks 4,078.6. That is a gap of a point and a half, which is about as balanced as this contract ever gets. Just overhead sits a 5-day average of 4,086.4, forming the bottom lip of the zone that decides everything.
Meanwhile the ranges keep shrinking. True range on the 9-day now measures 79.7 against 114.3 on the 50-day, a contraction of roughly 30 percent. The 9-day daily range at 69.4 sits a full third under its 50-day equivalent at 103.6. Historic volatility traces the same path, sliding from 27.05 percent measured over 100 days to 20.24 percent over nine. Weeks of steady narrowing, and Tuesday arrives with a light calendar in front of a rate decision, which compresses things further.
Directional readings finish the picture. Across 14 and 20 days the trend measure prints above 32 with the downside clearly in charge, confirming a real decline over the past month. Pull in to nine days and it drops to 24.45, with the two direction lines dead even at 20.12 and 20.40. Near-term momentum has run dry while the medium term stays intact. That combination is a consolidation, and consolidations need a catalyst. Wednesday supplies one.
The structure underneath is still heavy
None of the above should be mistaken for a bottom call. The metal topped on January 29 at 5,706.0 and has surrendered 28.5 percent since, bottoming out June 30 at 3,955.4. Price runs 4.1 percent under a 50-day of 4,250.5 and 10.6 percent under a 200-day of 4,560.1. It is beneath every average on the board. The long-horizon composite reads 67 percent sell.
What has changed is the front of that gradient. Short-term components now read 20 percent buy. Medium term flips to 25 percent sell, with the long-horizon group still pinned at 67. Bullish at the near end, bearish at the far end. The stochastic readings say the same thing from another angle: 16.96 percent on the 50-day and 9.26 percent on the 100-day are washed-out numbers, which means the straightforward downside has already been harvested. That is not a reason to buy. It is a reason to demand more from any fresh short.
The overnight session already showed its hand
The reopen delivered the tell inside thirty minutes. Gold opened the new trade date at 4,083.0, poked 4,085.7, and was sold straight back down to the 4,073 through 4,076 pocket on 642 lots. Look at where that high landed. Halfway back across the four-week span sits 4,085.5. Overnight traders walked into the bottom lip of the zone that governs Tuesday and were turned away at the first attempt.
That zone runs from 4,080.5 up to 4,087.8 and it is unusually crowded. Inside seven points the chart holds an 18-day crossing at 4,080.5, then a stall marker at 4,082.4, then a second one derived from the stochastic at 4,084.1, then the four-week midpoint, then the overnight high itself, and finally the session pivot up at 4,087.8. Six references. Price is under all of them, and every upside argument runs through taking them back.
Why the eventual break will be violent
This is where the options surface earns its place in the analysis. Reading through the main equity proxy for the metal, call gamma prints negative 116.06 million while put gamma prints positive 75.55 million, which leaves net exposure somewhere around negative 40 million. When that net figure is negative, hedgers are forced to trade alongside the move instead of leaning against it, selling weakness and buying strength. It amplifies. It does not dampen.
Pair that with the volatility contraction and you get a specific expectation: the range holds until it doesn't, and then it goes a long way. Options are cheap by their own standards, with implied volatility ranked at 28.66 percent of its trailing year and one-month implied at 22.08 against realised at 21.34, a premium of well under a point. Protection against a drop carries a skew rank of just 17.39 percent, which is remarkably cheap. Nobody is paying up for cover ahead of a meeting the market gives roughly two-in-five odds of delivering a hike. Treat that as a risk to respect rather than a signal to copy.
The setup, and the timing detail that matters most
The primary trade is a short into the decision band. Scale into 4,082 through 4,090 in thirds, no earlier than 09:45, with the stop at 4,101.5, clear of the shelf that runs 4,095 through 4,100. Targets sit at 4,067.2, then 4,056.3, then 4,038.2. Risk from an average 4,086 fill is 15.5 points, which is 1,550 dollars a contract, and the three objectives pay roughly 1.2, 1.9 and 3.1 to one. Take a third off at the first and pull the stop to entry. Should a 30-minute bar close over 4,100, or two of them hold above 4,090, the zone has been taken back and the idea is dead. Exit rather than widen.
The conditional long only exists above that band. It needs a 30-minute bar closing over 4,090 after 09:45, ideally with a softening dollar, buying the 4,090 through 4,095 retest against a 4,071 stop, working toward 4,108.5, then 4,116.1, then 4,131.5. The reward profile is thinner, which is exactly why it is the alternate rather than the primary.
Now the timing. Tuesday carries no first-tier data. The 7-year note auction lands at 13:00. August gold settles half an hour later. Monday's 5-year went off at a 4.408 percent high yield, up from 4.200, and its cover ratio eased from 2.350 down to 2.280. Higher yield, weaker demand, right in the middle of the curve. Should the 7-year repeat that, yields push up directly into gold's settlement window with almost no room to absorb it. A firm result does the reverse. Either way the final half hour is where Tuesday gets decided.
One more window deserves flat exposure: the 11:00 meeting with Israel's Prime Minister, Iran on the agenda. Every cross-asset move Monday traced back to Iran headlines, so that readout can push the metal either way. Friendly language carries the de-escalation forward and weighs on gold. Any stiffening of tone brings the haven bid straight back.
How the paths weight out
A compression session that tests the decision band once or twice, fails, and settles mid-range carries 55 percent. A downside resolution through the 4,056 shelf toward the 4,035.6 and 4,043.6 pair, with the 4,022 through 4,025 pocket reachable on extension, runs 25 percent, and it needs a real trigger rather than drift. Upside acceptance over 4,090 aiming at 4,108.5 and 4,116.1 takes the remaining 20 percent, with the washed-out longer stochastics supplying fuel that has so far lacked a match.
One scheduling item for anyone holding into the back half of the week: first notice for August lands July 31, four sessions out, and the roll will begin bending liquidity and spreads before that. Open interest reads 139,192.
Everything about this setup argues for a narrow session and a wide one after it. The metal is balanced on its own mean, the ranges have been shrinking for weeks, the calendar is thin, and the hedging community is positioned to exaggerate whatever eventually breaks. Fade the edges Tuesday. Save the conviction for Wednesday afternoon.
The complete data picture
Every number behind Tuesday’s plan, charted first; the full numeric reference follows underneath.
Full numeric reference , every remaining figure from the review
| August settlement | 4,077.0 |
| Five-session change | up 61.1 points, or 1.52 percent |
| Five-session low | 4,024.0, printed Friday July 24 |
| Prior week high | 4,171.4 |
| Globex reopen | opened 4,083.0, high 4,085.7, drifted to 4,073 through 4,076 |
| Reopen 30-minute candle | open 4,073.7, high 4,076.3, low 4,073.7, close 4,075.9 |
| Reopen volume | 642 contracts |
| 4-hour candle | open 4,078.2, high 4,091.8, low 4,074.5, close 4,078.6 |
| Open interest | 139,192 |
| First notice day, August | July 31, four sessions out |
| All-time cycle high | 5,706.0 on January 29 |
| Decline from that high | 28.5 percent |
| One-month and 13-week low | 3,955.4 on June 30 |
| Lower highs on the way down | roughly 4,819.1 on May 12, then 4,215.5 on July 6 |
| Four-week band | 3,955.4 to 4,215.5, a 260-point span |
| One-month change | negative 14.0 points, or negative 0.34 percent |
| 52-week span | 3,441.5 to 5,706.0 |
| Position in the 52-week span | roughly the 28th percentile |
| Position in the one-month span | near the 47th percentile |
| Heaviest accepted volume | 3,980 to 4,000 |
| 4-hour swing pivots | 4,120 above, 4,020 below; consolidation 4,060 to 4,100 |
| 5-day | 4,086.4, price 12 points below |
| 20-day | 4,078.6, price 4 points below |
| 50-day | 4,250.5, price 4.1 percent below |
| 100-day | 4,527.7, price 10.0 percent below |
| 200-day | 4,560.1, price 10.6 percent below |
| Year-to-date | 4,665.9, price 12.6 percent below |
| Distance to the 50-day | 173 points overhead |
| 9-day | raw 57.25 percent, %K 54.56 percent, %D 55.13 percent, strength 49.31 |
| 14-day | raw 57.25 percent, %K 52.98 percent, %D 50.17 percent, strength 46.20 |
| 20-day | raw 48.79 percent, %K 46.64 percent, %D 47.09 percent, strength 44.27 |
| 50-day | raw 16.96 percent, %K 15.42 percent, %D 14.94 percent, strength 44.35 |
| 100-day | raw 9.26 percent, %K 8.59 percent, %D 8.30 percent, strength 47.47 |
| 14-day relative strength | 45.76, just below neutral |
| 9-day | trend 24.45, positive 20.12, negative 20.40, historic volatility 20.24 percent |
| 14-day | trend 32.06, positive 17.19, negative 22.69, historic volatility 22.02 percent |
| 20-day | trend 32.75, positive 15.77, negative 24.12, historic volatility 20.56 percent |
| 50-day | trend 20.37, positive 16.22, negative 25.53, historic volatility 24.59 percent |
| 100-day | trend 12.90, positive 19.08, negative 25.31, historic volatility 27.05 percent |
| Overall | 24 percent sell, average strength, weakening direction |
| Short-term group | 20 percent buy |
| Medium-term group | 25 percent sell |
| Long-term group | 67 percent sell |
| Average true range, 9-day | 79.7, or 2.00 percent |
| Average true range, 14-day | 89.9, or 2.20 percent |
| Average true range, 20-day | 97.5, or 2.40 percent |
| Average true range, 50-day | 114.3, or 2.80 percent |
| Average true range, 100-day | 111.3, or 2.70 percent |
| Average daily range, 9-day | 69.4, or 1.70 percent |
| Average daily range, 14-day | 77.1, or 1.89 percent |
| Average daily range, 20-day | 87.9, or 2.15 percent |
| Average daily range, 50-day | 103.6, or 2.54 percent |
| Average daily range, 100-day | 119.0, or 2.91 percent |
| Working expectation for Tuesday | 60 to 75 percent of the 9-day daily range, roughly 45 to 55 points |
| One-deviation band | 4,038.2 to 4,115.8, a 78-point span |
| Decision band | 4,080.5, 4,082.4, 4,084.1, 4,085.5, 4,085.7 and the pivot at 4,087.8 |
| Embedded in the band | the 5-day average at 4,086.4 |
| Next zone | 4,108.5, 4,108.9, 4,113.4, 4,115.8, 4,116.1 |
| Above that | 4,129.7, 4,131.5, 4,131.9, 4,140.0, 4,144.2 |
| Distance to the 4,129.7 to 4,144.2 zone | roughly 65 points of range, which Tuesday's calendar does not obviously supply |
| Out of one-day reach | 4,160.7, 4,171.4, 4,176.0, 4,215.5 |
| Nearest | overnight low 4,073.9, settlement 4,077.0 |
| First shelf | 4,051.8, 4,054.8, 4,056.3, 4,056.6, 4,061.3, 4,067.2 |
| Next zone | 4,035.6, 4,038.2, 4,043.6 |
| Below that | 4,022.1, 4,024.0, 4,025.5 |
| Deeper | 4,004.1, 4,004.7, 4,009.8, with the 4,000 handle beneath |
| Structural base | 3,955.4 |
| Last / previous close | 374.03 against 371.90, up 0.57 percent |
| Volume | 7.17 million shares |
| Translation ratio | approximately 10.9 futures points per proxy dollar |
| Call gamma / put gamma | negative 116.06 million / positive 75.55 million |
| Net gamma | approximately negative 40 million |
| Put-to-call open interest | 0.52 |
| Call volume / put volume | 75.77 thousand / 57.23 thousand |
| Largest gamma and delta expiry | September 17 |
| One-month implied / realised volatility | 22.08 percent / 21.34 percent |
| Implied volatility rank / skew rank | 28.66 percent / 17.39 percent |
| Implied move | 5.18 dollars on the proxy, roughly 56 futures points |
| High / low volatility points, low confidence | 413 and 333, roughly 4,498 and 3,626 |
| Dollar index | 101.513, up 0.05 percent |
| US durable goods | 0.3 percent against a 1.8 percent forecast |
| Producer prices | 5.5 percent year on year against 6.2 percent forecast, prior 6.5 percent revised to 6.0 percent |
| Policy rate | 3.75 percent, consensus no change, implied hike odds roughly 40 percent |
| Two-year auction | high yield 4.315 percent against 4.189 percent prior |
| Five-year auction | high yield 4.408 percent against 4.200 percent prior, cover 2.280 against 2.350 |
| Seven-year, prior auction | high yield 4.260 percent, cover 2.500 |
| Equity index future / cash | 7,446.25 / 7,413.18, up 0.02 percent |
| Technology index future | 28,135.75, down 0.19 percent, its fund proxy down 0.31 percent |
| Blue-chip future | 52,432 |
| Volatility index | 18.68, up 0.59 percent |
| Crude / international crude | 82.61, down 6.70 or 7.50 percent / 88.36, down 8.42 or 8.7 percent |
| Natural gas / gasoline / diesel | 2.7670 / 3.3273 / 4.1116 |
| Digital asset benchmark | 64,515.73, down 1.26 percent |
| Swiss policy | expected to hold at zero through the end of 2027 |
| Japanese policy | consensus July hold, roughly two-thirds expect a shortened interval between hikes |
| Bank of England | decides Thursday, prior vote seven unchanged against two for a hike, none for a cut |
| Commercial | long 80,457 up 818, short 293,656 down 771, net short 213,199 |
| Non-commercial | long 224,785 down 2,525, short 40,875 up 247, net long 183,910 |
| Entry zone | 4,082 to 4,090, scaled in thirds, not before 09:45 |
| Stop | 4,101.5 |
| Target 1 | 4,067.2 |
| Target 2 | 4,056.3 |
| Target 3 | 4,038.2 |
| Risk | 15.5 points, or 1,550 dollars per contract at 100 dollars per point |
| Reward | approximately 1:1.2, 1:1.9 and 1:3.1 |
| Invalidation | a 30-minute close above 4,100, or two consecutive closes holding above 4,090 |
| Trigger | a 30-minute close above 4,090 after 09:45 |
| Entry zone | 4,090 to 4,095 on the retest |
| Stop | 4,071 |
| Targets | 4,108.5, then 4,116.1, then 4,131.5 |
| Reward | roughly 1:0.8, 1:1.2 and 1:1.9 from a 4,092 entry |
| Compression and rejection | 55 percent, roughly 4,056 to 4,105 |
| Downside resolution | 25 percent, 4,035.6 to 4,043.6, then 4,022 to 4,025 |
| Upside acceptance | 20 percent, 4,108.5 to 4,116.1 |
| High band | 4,100 to 4,112 |
| Most-likely upper | 4,088 to 4,095 |
| Anchor | 4,073 to 4,080 |
| Most-likely lower | 4,056 to 4,067 |
| Low band | 4,038 to 4,050 |
| Overnight expectation | a 20 to 30 point span contained within 4,060 to 4,090 |
| Directionless drift | price opens inside 4,073 to 4,082 and stays there through 11:00 on light volume |
| Compression premise fails | realised range by 12:00 already exceeds 55 points |
| Headline volatility | the 11:00 meeting produces materially escalatory language |
| Session rules | any entry before 09:45 or after 16:00 |
| Poor risk placement | trading within ten points of the 4,087.8 pivot at the 13:00 auction |
| 02:45 | French consumer confidence, forecast 85, prior 84 |
| 06:00 / 06:55 / 07:30 | Parcel, beverage and aerospace quarterly earnings |
| 09:00 | Case-Shiller twenty-city, forecast 1.3 percent, prior 1.1 percent |
| 10:00 | US consumer confidence, forecast 92.4, prior 91.2 |
| 11:00 | Meeting on Iran, tentative, high impact |
| 13:00 | Seven-year note auction, the highest scheduled impact for the metal |
| 13:30 | August contract settlement |
| 16:05 | Automotive and payments quarterly earnings |
| 21:30 | Australian quarterly inflation, trimmed mean 3.7 percent forecast against 3.5 percent prior |
| Wednesday 10:30 | Crude inventories |
| Wednesday 14:00 | Rate decision, forecast 3.75 percent unchanged, press conference 14:30 |
| Thursday 07:00 | Bank of England decision |
| Thursday 08:30 | Core inflation, forecast 3.3 percent against 3.4 percent prior, with advance growth and jobless claims |



