
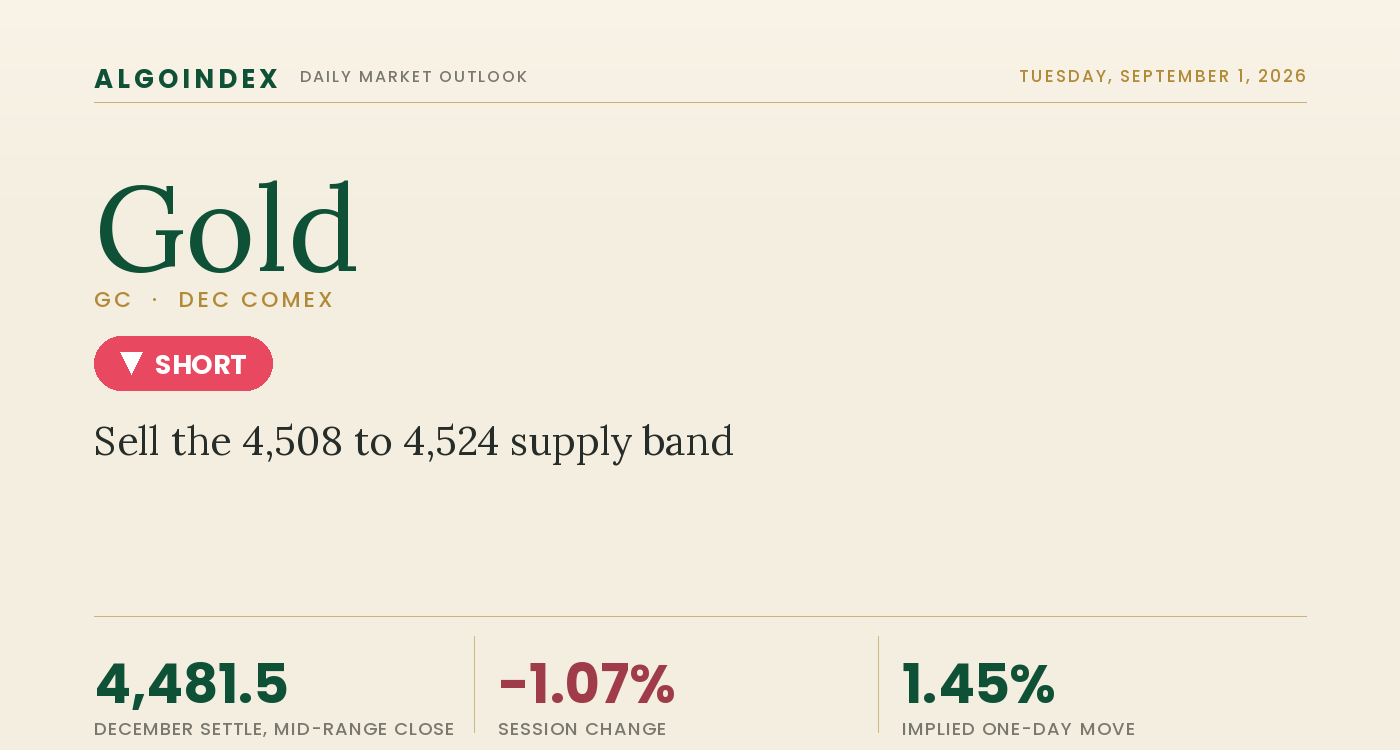
Gold consolidated on Monday after Friday break, and the distinction between the two sessions is the whole story. The December contract settled at 4,481.5, down 48.4 points or about 1.07 percent from Friday 4,529.9 settle, inside a band of 4,445.6 to 4,521.5. That 75.9-point range came in at 74.1 percent of the 102.4-point 14-day average daily range, and volume fell to 152,216 contracts against Friday 274,603. The settle sat at 47.3 percent of the range, the middle, and 1.7 points beneath the open, effectively unchanged on the day own terms. A session that gives back 48.4 points against the prior settle but finishes flat to its own open is describing overnight gap damage rather than intraday selling. Taken with Friday 193-point break, the pairing reads as impulse then pause, not a two-day rout.
The dominant driver was monetary policy rather than the safe-haven channel. Hawkish central-bank communication repriced the path toward higher-for-longer and away from near-term easing, which lifts real-yield expectations and firms the dollar, gold primary daily headwind. The 10-year yield closed Monday at 4.76 percent after touching 4.77 percent intraday, its highest since January 2025, and a headline personal consumption expenditures reading of 3.7 percent against a 3.6 percent consensus kept the disinflation story stalled. The complicating layer is geopolitical. Renewed United States and Iran military exchanges pushed crude more than 2.5 percent higher, the international benchmark back above 90 dollars, yet the metal drew no lasting bid because de-escalatory commentary framed the Strait of Hormuz as in extremely good shape. A contained conflict that raises oil is, for gold, a net negative, because the inflation impulse hardens the hawkish path faster than the risk premium bids the metal. Into the electronic reopen order flow turned constructive, with price back to 4,508.7, up 27.2 points from the settle and holding above both the settle and the session midpoint.
A quiet pause that did not repair Friday damage
The break did real structural damage and Monday did not undo it. Against the 4,481.5 settle the reference averages read 4,565.7 on the 5-day, 4,505.1 on the 20-day, 4,281.2 on the 50-day, 4,467.7 on the 100-day and 4,642.1 on the 200-day, a genuinely mixed stack rather than a uniform breakdown, with price beneath the 5-day, 20-day and 200-day but above the 50-day and 100-day. The 100-day at 4,467.7 is the level that matters most on Tuesday, because it sits between Monday low and Monday settle and is the nearest long-horizon average price has not yet lost. The August advance ran from the August 18 close of 4,420.6 to the August 25 high of 4,755.0, a 334.4-point move, and Monday low of 4,445.6 retraced 92.52 percent of it in three sessions, taking price back inside the base the breakout launched from.
Momentum points lower without yet signalling a reversal. The 9-day relative-strength reading sits at 48.80, the 14-day at 53.79 and the 20-day at 54.41, the short window beneath the midline while the medium windows hold above it, the signature of a correction inside an intact structure. Stochastics confirm the tilt, with every percent-K beneath its percent-D across the 9-day, 14-day and 20-day windows, and the 9-day raw reading of 17.55 approaching stretched territory. The standout is the 9-day directional read of 35.27, above the 30 that marks a genuine trend, with the negative directional indicator at 23.10 holding above the positive at 19.57. That is the single most bearish reading in the technical set and the main argument against calling Monday pause a bottom.
The 4,505 to 4,525 band decides Tuesday
Two zones frame Tuesday. The immediate supply band runs 4,505 to 4,525, containing the 20-day average at 4,505.1, the computed first resistance at 4,520.1 and Monday session high at 4,521.5, three references inside twenty points, with price trading into it now at 4,508.7. Above it sit the computed second resistance at 4,558.8, the 5-day average at 4,565.7 tightening a single shelf, the computed third resistance at 4,596.0 and the 200-day average at 4,642.1. Beneath price, first support is the 4,481.5 settle and 4,482.9 pivot, then the 100-day average at 4,467.7, then the tested pair of Monday 4,445.6 low and the computed first support at 4,444.2, with the pre-breakout base at 4,420.6 to 4,473.7, the computed second support at 4,407.0 and the 50-day average at 4,281.2 beneath. Dealers on the gold-ETF proxy carry net-short gamma, so moves around the supply band and the 4,444 support pair are likely to run larger than a neutral-positioning session would produce, holding cleanly or breaking hard.
Fade the band, respect 4,568, size it down
The plan fades strength into the 4,508 to 4,524 supply band, where the 20-day average, the computed first resistance and Monday high stack, leaning on a confirmed downtrend and a 92.52 percent retracement of the August advance rather than chasing a fresh low. The stop is 4,568, above the 4,558.8 second resistance and the 4,565.7 five-day average, so it triggers only if the entire supply shelf has been reclaimed, about 52 points from a 4,516 entry midpoint. Targets run to the 4,481.5 settle and 4,482.9 pivot, then the 4,467.7 100-day average, then the 4,444.2 first-support pair, for reward-to-risk near 1 to 0.66, 1 to 0.93 and 1 to 1.38. These are poor ratios and they are stated plainly, because the level structure here is dense and compresses the distance to every target; the trade is justified only on a fill in the upper half of the band, nearer 4,520 than 4,508, which improves the extended ratio toward 1 to 1.58. Two overrides act in real time. A manufacturing prices-paid print materially beneath the 70.5 consensus alongside weak job openings relieves the real-rate pressure that is the entire basis for the short and voids it, while a genuine Strait of Hormuz transit disruption converts the energy story from an inflation problem into a systemic one, at which point the safe-haven channel overwhelms the rates channel and short exposure is the wrong side. The better-structured alternate is a long from 4,445 to 4,468 on a first test that holds, stop 4,432, targets 4,481.5, 4,505.1 and 4,520.1, preferred if price comes to the support pair rather than the supply band. Our published record lays out how we grade these calls.
The dominant driver is monetary policy, not the safe-haven channel, as hawkish communication lifted real yields and firmed the dollar while a contained oil shock hardened the higher-for-longer path. Monday paused rather than extended, finishing flat to its own open after retracing 92.52 percent of the August advance, and the 9-day trend read still points lower. Beneath the 4,568 line the tilt favors fading strength into the 4,505 to 4,525 band. Selling the retest that stalls, half size, is the trade.
A one-session pause that finishes flat to its own open, after a break that retraced almost the entire August advance, is a market digesting rather than a fresh trend that chases from here. The edge is fading the 4,505 to 4,525 supply band, and sustained trade above 4,525 is the line that flips the read from short to sidelined.
This is the read our members get every session, before the bell, with the levels drawn and the setup defined. See how the same dealer-positioning work turns into systematic signals.
View pricingThe complete data picture
Every number behind Tuesday’s plan, charted first; the full numeric reference follows underneath.
Full numeric reference, every remaining figure from the review
| Average | Value | Settle vs |
|---|---|---|
| 5-day | 4,565.7 | below by 84.2 |
| 20-day | 4,505.1 | below by 23.6 |
| 50-day | 4,281.2 | above by 200.3 |
| 100-day | 4,467.7 | above by 13.8 |
| 200-day | 4,642.1 | below by 160.6 |
| Level | Reference |
|---|---|
| 5,781.8 | 52-week high, a distant reference |
| 4,755.0 | August 25 peak, the swing high and one-month ceiling |
| 4,688.0 | August 28 high, a structural marker |
| 4,642.1 | 200-day average, the nearest long-horizon average overhead |
| 4,596.0 | computed third resistance, a stretch objective |
| 4,565.7 | 5-day average, the upper shelf |
| 4,558.8 | computed second resistance |
| 4,521.5 | Monday session high, the upside extreme |
| 4,520.1 | computed first resistance |
| 4,508 to 4,524 | supply band, the short entry, containing the 20-day, first resistance and Monday high |
| 4,505.1 | 20-day average, the first hurdle for a recovery |
| 4,482.9 | computed pivot point |
| 4,481.5 | December settle, target 1 with the pivot |
| 4,473.7 | August 17 close, top of the pre-breakout base |
| 4,467.7 | 100-day average, the first support beneath, target 2 |
| 4,445.6 | Monday session low, tested once and held |
| 4,444.2 | computed first support, paired with the session low, target 3 |
| 4,420.6 | August 18 close, the base of the pre-breakout zone |
| 4,407.0 | computed second support |
| 4,368.3 | computed third support, the outer downside edge |
| 4,281.2 | 50-day average, the last line before a deeper corrective leg |
| 3,664.0 | 52-week low, a distant reference |
| Metric | Reading |
|---|---|
| Gold-ETF proxy price | 408.04, the positioning reference for the metal |
| Call-side dealer gamma | about negative 311.34 million, the dominant leg |
| Put-side dealer gamma | about positive 131.81 million, the smaller leg |
| Net positioning | about negative 179.5 million, net short gamma, dealers positioned to amplify directional moves rather than absorb them |
| One-day options-implied move | about 5.93 on the proxy, roughly 1.45 percent, mapping to about 65 gold points around the 4,481.5 settle |
| Implied-vol rank | about 29 percent, 30-day implied volatility 22.97 percent against 27.75 percent realized, implied beneath realized |
| Skew rank | mid-range near 55 percent |
| Put-to-call open interest | 0.46, call-heavy on an outright basis, with Monday flow running 1.846 calls per put |
| Volatility reference labels | the model upper and lower references print inverted at 417 and 470 dollars against a 408.04 price and are excluded as unreliable, the model dated August 29 reflecting Friday closing surface |
| Input | |
|---|---|
| Fed and policy | the central bank chair used the Jackson Hole platform to name inflation as the problem and rate increases as the instrument, and follow-on commentary left markets pricing a higher probability of a September increase rather than a reduction |
| 10-year yield | closed Monday at 4.76 percent after touching 4.77 percent intraday, its highest since January 2025, lifting real-yield expectations against a non-yielding asset |
| Inflation data | the headline personal consumption expenditures price index printed 3.7 percent on the year, above the 3.6 percent consensus and level with the prior 3.7 percent, keeping the disinflation story stalled |
| Crude oil | the United States and Iran exchanged strikes for the first time in about a month and crude rose more than 2.5 percent, the international benchmark trading back above 90 dollars a barrel in early Asian hours |
| Geopolitics | administration commentary was de-escalatory in tone, strikes characterised as limited and the Strait of Hormuz described as in extremely good shape with transit continuing, a contained conflict that raises oil and hardens the policy path faster than it bids the metal |
| Metals complex | the physical precious metals basket fell 5.74 percent, the precious metals fund 4.67 percent, the gold trust 2.08 percent and the gold exchange-traded fund 2.09 percent, a broad repricing rather than an idiosyncratic futures move |
| Equities and rotation | index dispersion showed money rotating toward long-duration technology rather than defensive assets, not the behaviour of a market seeking a safe-haven bid |
| Positioning | net dealer gamma on the proxy near negative 179.5 million, call gamma negative 311.34 million against put gamma positive 131.81 million, hedging set to amplify a directional catalyst rather than absorb it |
| Volume and open interest | Monday volume of 152,216 against Friday 274,603, with December futures open interest at 323,793, down 1,072 from Friday, so the break drew no aggressive new position-building |
| Overnight expectation | a neutral read with a mild upward lean, the electronic session reopened at 4,498.7 and last traded 4,508.7, up 27.2 points from the settle and pressing the lower edge of the supply band |
| When | Event |
|---|---|
| Tue Sep 1 | the euro-area flash consumer price index at 5:00 AM ET and the compressed 10:00 AM ET set of manufacturing prices-paid, job openings and the manufacturing activity survey, prices paid the first-order read for gold |
| Wed Sep 2 | the private-payrolls estimate and a Canadian rate decision, a first read on hiring momentum |
| Thu Sep 3 | services activity, jobless claims and two central bank speakers |
| Fri Sep 4 | the monthly employment report at 8:30 AM ET, 55 thousand consensus against a negative 23 thousand prior, the week dominant forward catalyst for the rate path |
The economic releases referenced above are published on the official government calendars below. Price levels are derived from standard technical and statistical methods, and the market read is AlgoIndex's own analysis. How we grade these calls is set out in our performance methodology.
- US Bureau of Economic Analysis, Personal Income and Outlays (PCE)
- US Bureau of Economic Analysis, Gross Domestic Product
- US Bureau of Economic Analysis, release schedule
- US Census Bureau, Advance Durable Goods (M3) release schedule
- US Energy Information Administration, Weekly Petroleum Status Report
- US Department of the Treasury, auction schedule and results
- AlgoIndex performance methodology



