
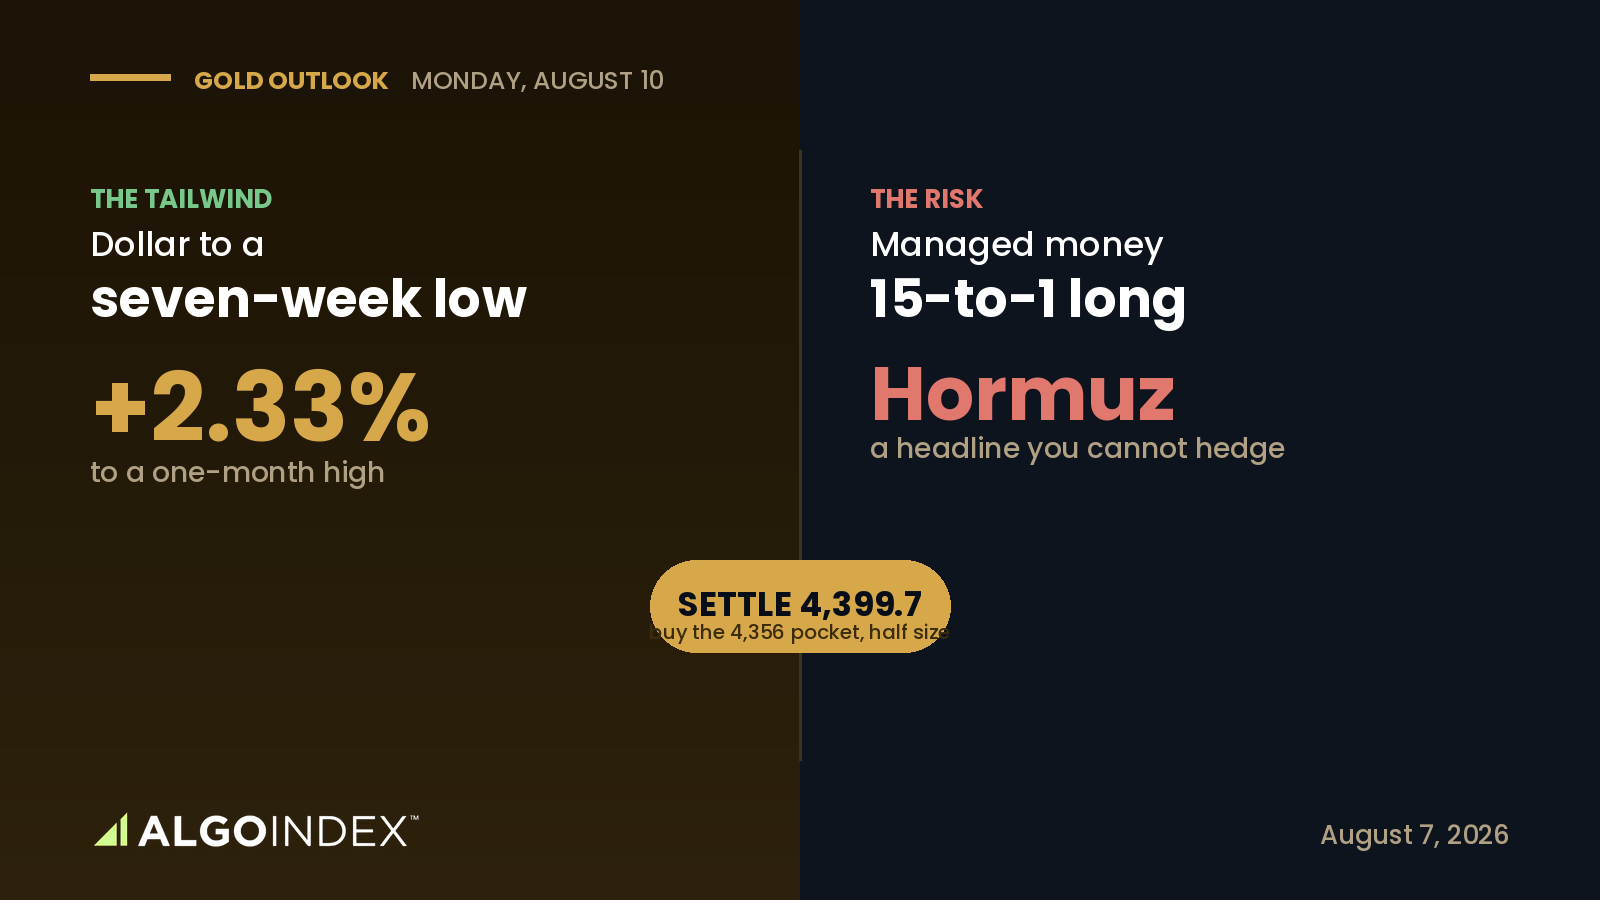
At the 8:30 payroll release on Friday, gold stopped waiting. From a session low of 4,288.0 it ran almost without a pause to 4,432.3, a fresh one-month high, and settled at 4,399.7, up 2.33 percent on its strongest single day in weeks.
The trigger was clean. A labor market shedding jobs pulled the dollar to a seven-week low at 99.539 and cut the odds of a September rate hike to 44 percent from 58 percent. A weaker dollar and a lower expected policy path is the most reliable tailwind this metal has. But the picture into Monday is more complicated than the settle, because the same rally that looks so strong is also crowded and stretched. Managed money is holding more than fifteen longs for every short, the shortest windows on the stochastic are pinned above 90, and there's a live weekend headline that could pull a chunk of the price back out.
A monetary rally, not a fear rally
The way the complex moved tells you which kind of rally this was. Silver ran 3.07 percent, outpacing gold, and equities closed at records on the same day the metal surged. A fear bid doesn't lift stocks and gold together; a falling dollar does. That distinction matters for Monday, because monetary-driven rallies tend to consolidate and persist, while fear spikes tend to give it back in a hurry. The dealer-positioning proxy backs the constructive read, with dealers net short call gamma, which means they have to buy into strength to stay hedged and that mechanically amplifies advances.
The crowd is already all the way long
Positioning is the reason we wait for a pullback instead of chasing the settle. Managed money holds 139,809 long against just 9,043 short and added to that length last week while cutting shorts. With so few shorts left to cover, the fuel for a squeeze is largely spent, and a crowded long book raises the downside speed if the story cracks. Momentum agrees that the easy part is behind. Two bearish oscillator markers printed on the four-hour chart Thursday and Friday even as price rose, the early sign that internal momentum is fading under an advancing price. This is a strong trend with a tired engine.
So the entry waits at 4,356 to 4,375, where the pivot point and the 38.2 percent pullback grouping sit together, with a stop at 4,308 beneath the first pivot support. Half size is the right call here, because three risks compound: the crowded long, the stretched short-term momentum, and a weekend gap you can't hedge.
The headline you cannot hedge
Gold doesn't reopen until 18:00 ET Sunday, and a real slice of the premium built into recent weeks is geopolitical. On Friday a United States official said there's progress between Oman and Iran on the Strait of Hormuz and that a deal is expected soon. If an agreement is announced over the weekend, Monday's reopen can gap lower toward the 4,314 to 4,347 area as that safe-haven premium comes out, and it would do so with no way to adjust in between. That single risk is why an announced Hormuz deal is a stand-aside, not a dip to buy.
With fifteen longs for every short already on the book, the next move needs a pullback to find new buyers, not another push.
The pocket, and the 100-day above
Zoom out and this is a powerful recovery inside a larger correction that began in late January, not a fresh leg of the old bull market. Price is still below the 100-day average at 4,507.5 and the 200-day at 4,616.1, and the 100-day is the first place any Monday advance genuinely meets the bigger structure. The base case is consolidation: hold above the 4,373 pivot, range between 4,375 and 4,440, test but don't decisively break the 4,432 high, and resolve the overbought condition through time rather than a sharp reversal. Targets on the long run to 4,432, then 4,458, then 4,478. How we score a setup like this once it plays out is in our performance methodology.
A rally this crowded doesn't need more buyers, it needs a pullback that finds them, and the 4,356 pocket is where it should.
This is the read our members get every session, before the bell, with the levels drawn and the setup defined. See how the same dealer-positioning work turns into systematic signals.
View pricingThe complete data picture
Every number behind Friday’s plan, charted first; the full numeric reference follows underneath.
Full numeric reference , every remaining figure from the review
| Average | Value | Price vs |
|---|---|---|
| 5-day | 4,249.5 | +150.2 |
| 20-day | 4,146.4 | +253.3 |
| 50-day | 4,244.1 | +155.6 |
| 100-day | 4,507.5 | -107.8 (next barrier) |
| 200-day | 4,616.1 | -216.4 |
| YTD | 4,702.7 | -303.0 |
| Level | Reference |
|---|---|
| 4,243.1 | raw stochastic 50% |
| 4,229.0 | second pivot support |
| 4,222.4 | two-SD support |
| 4,201.5 | 9-day average crossing |
| 4,182.4 | 40-day average crossing |
| 4,170.1 | third pivot support |
| 4,015-4,019 | double base, structural line |
| Metric | Reading |
|---|---|
| Proxy close | 398.28, +2.21% |
| Call gamma / put gamma | -338.33M / +106.51M |
| Call vs put volume | 379.18k vs 134.14k (about 2.8:1) |
| Put-to-call OI | 0.49 |
| One-month implied / realized | 22.74% / 24.86% |
| Implied-vol rank / skew rank | 30.92% / 66.40% |
| Implied move | about 61 futures pts (1.40%) |
| Largest gamma/delta expiry | Sept 17 |
| Cohort | Long / Short |
|---|---|
| Managed money | 139,809 / 9,043 (>15:1) |
| Non-commercials | 227,013 / 29,379 |
| Commercials | 71,832 / 298,323 (+10,554 shorts) |
| Swap dealers | 20,753 / 228,388 |
| Producers | 15,738 / 34,594 |
| Weighted alpha | +12.84 |
| Input | |
|---|---|
| Nonfarm payrolls | -23,000 vs +80,000 |
| Avg hourly earnings | +0.1% m/m, 3.2% y/y |
| Sept hike odds | 44% from 58% |
| Dollar index | 99.539, seven-week low |
| NY Fed 1-yr inflation exp | 3.63% |
| Crude / equities | +1.15% / records |
| When | Event |
|---|---|
| Sat 21:30 | China PPI 3.9% / CPI 0.8% |
| Sun 19:50 | Bank of Japan minutes |
| Mon 04:30 | Eurozone Sentix -0.5 |
| Tue/Wed/Thu 13:00 | 3-yr, 10-yr, 30-yr auctions |
| Wed 08:30 | US CPI 0.1% m/m, 3.4% y/y |
| Thu 08:30 | US PPI 4.8% y/y + claims |



