
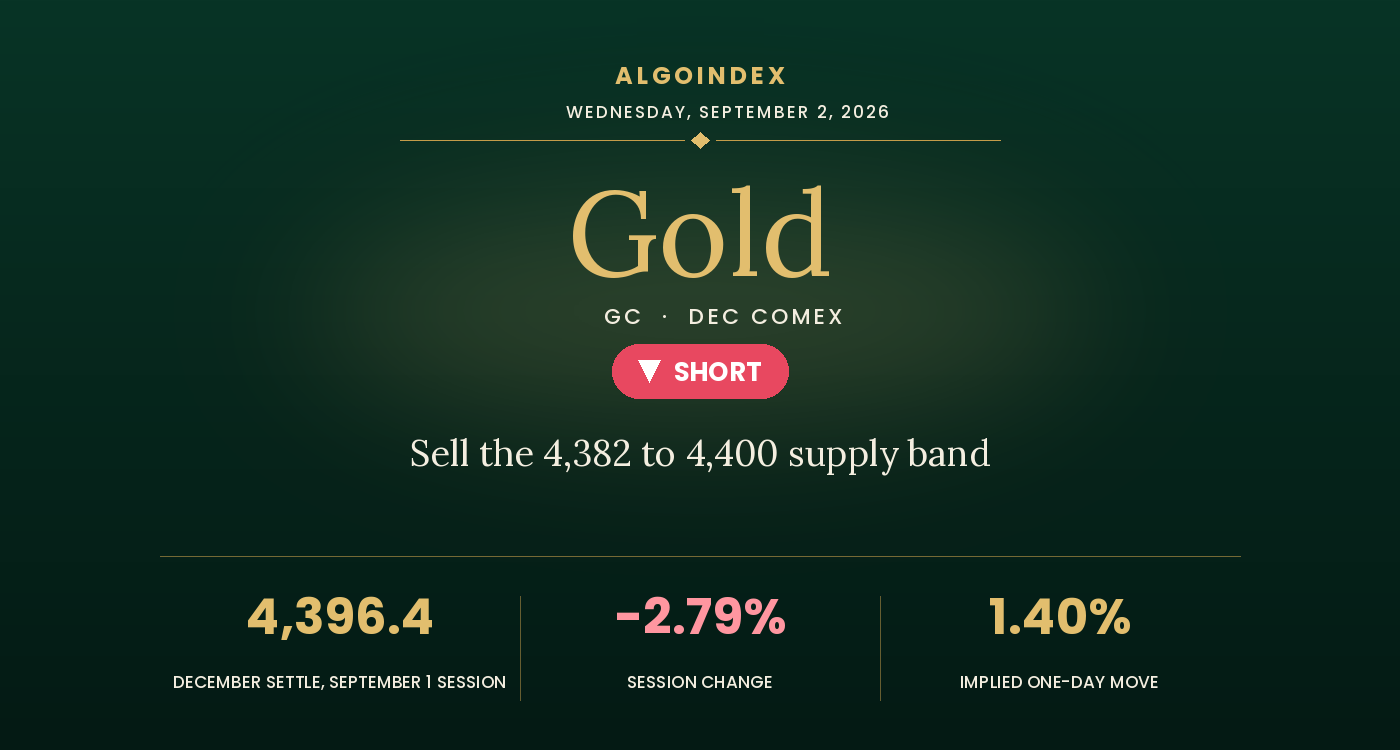
Gold did the one thing a haven is not supposed to do, and that failure is the whole story of Tuesday. On a session defined by an active military escalation between the United States and Iran, with crude sharply higher and volatility at a one-month high, the metal fell hard. The December contract settled at 4,396.4 and the exchange-traded proxy closed at 397.03, down 2.79 percent from a prior 408.44, with spot trading near 4,300, lower by roughly 3 percent. The move was not a fear trade but a rates trade. The ten-year yield rose to 4.802 percent and the dollar index firmed to 99.747, and rising real yields plus a firmer dollar are the two conditions under which the metal reliably underperforms regardless of the headlines. An energy-driven inflation impulse that pushes the policy path more hawkish is, counterintuitively, a near-term negative for gold, because it raises the opportunity cost of holding a non-yielding asset faster than it raises the haven bid.
The technical damage is now measurable rather than inferred, and gold is the one instrument in this package where a genuine downtrend can be read directly. The five-day change is negative 298.4 points, or negative 6.41 percent, with five separate new five-day lows inside those five sessions. The nine-day directional index reads 36.18 with the negative directional component at 29.87 against a positive component of 16.15, a trending market by any conventional threshold. The counterweight is that short-horizon oscillators are deeply compressed, with raw stochastics at 4.99 percent on both the nine-day and fourteen-day windows, and the fifty-day average at 4,282.0 sitting only 114.4 points beneath the settle as the last remaining average support. The overnight extension confirmed the tilt: the contract reopened at 4,377.2 at 6:00 PM ET, reached only 4,382.0, and fell to 4,333.9 before recovering near 4,355, so sellers took control immediately on the reopen.
A confirmed downtrend that a haven day could not reverse
The selling has done real structural damage. Against the 4,396.4 settle the reference averages read 4,485.3 on the five-day, 4,502.5 on the twenty-day, 4,282.0 on the fifty-day, 4,461.2 on the hundred-day and 4,641.5 on the two-hundred-day, with price beneath every average except the fifty-day. The two-hundred-day at 4,641.5 sitting 245.1 points overhead states how much the year has cost, and the fifty-day at 4,282.0, the last average still held, is the single most important level on the chart, 114.4 points beneath the settle and only 51.9 points beneath the overnight low. The August rally to 4,755.0, the one-month and thirteen-week high, has been fully retraced and then some, and the contract has broken beneath its own 38.2 percent retracement of the 52-week range at 4,516.8, a meaningful structural failure. The fifty-day sitting beneath the hundred-day and two-hundred-day is the signature of a market that fell steeply earlier in the year and has been basing since rather than one rolling over from a top.
Momentum points lower with conviction. Nine-day relative strength reads 35.30, the weakest short-horizon figure in the package and approaching but not yet at oversold territory, with the fourteen-day at 43.87 and the fifty-day at 48.24. Raw stochastics are severely compressed at 4.99 percent on both the nine-day and fourteen-day windows, the lowest across the four instruments reviewed. The distinguishing feature is trend strength: the directional index reads 36.18 on the nine-day, 28.42 on the fourteen-day and 22.47 on the twenty-day, all above the 20 threshold, with the nine-day well above the 25 level that marks a strong trend and the negative component dominating on every window. Gold is the only instrument in the package where the trend indicator confirms a directional move rather than a range, and the multi-indicator composite reads 24 percent sell, the most negative of the four.
The 4,382 to 4,400 band frames Wednesday
Two areas frame Wednesday. The immediate supply band runs 4,382 to 4,400, spanning the overnight high at 4,382.0, the September 1 settle at 4,396.4 and the eighteen-day average stall at 4,399.7, capped by the computed pivot at 4,425.5, the first genuine decision level. Above the pivot the references thicken between 4,485 and 4,518, where the five-day average at 4,485.3, the twenty-day at 4,502.5, the 38.2 percent retracement of the 52-week range at 4,516.8 and the one standard deviation resistance at 4,517.7 form the area where any recovery should fail on a first approach. Beneath price the first demand band is 4,333.9 to 4,340.6, pairing the overnight low, the 38.2 percent retracement from the four-week low at 4,334.1 and the computed first support, three references inside seven points. Then 4,315.3 marks the forty-day average and 4,318.5 the computed target price, and the decisive shelf is 4,282.0 to 4,284.7, where the fifty-day average meets the computed second support. Dealers on the proxy carry a configuration that amplifies upside and absorbs downside, so counter-trend rallies are likely to run sharp and fast rather than the decline accelerating in a straight line.
Sell the band, respect 4,428, size it down
The plan sells strength into the 4,382 to 4,400 supply band, where the overnight high, the settle and the eighteen-day average stall stack beneath the computed pivot, leaning on the only confirmed downtrend in the package and a failure to rally on a day of live military escalation rather than chasing a fresh low. The stop is 4,428, just above the 4,425.5 pivot, so it triggers only if acceptance there signals a genuine counter-trend reclaim, about 37 points from a 4,391 entry midpoint. Targets run to the 4,334 overnight low and first-support pair, then the 4,315 forty-day average and computed target price, then the 4,284 second-support and fifty-day band, for reward-to-risk near 1 to 1.5, 1 to 2.1 and 1 to 2.9. Two conditions govern the trade in real time. The 8:15 AM ET employment change survey, forecast at 45 thousand against a prior 44 thousand, is the session decisive rate-path input and gold main driver: a stronger reading reinforces the hawkish path and presses the metal, while a materially weaker reading is the clearest catalyst against the short. The macro override that reverses the setup is an escalation severe enough to threaten global growth rather than merely energy supply, in which case yields would fall, the haven channel and the rate channel would align for the first time, and the amplifying call-side gamma configuration would accelerate the resulting squeeze. Position at half size given that risk, the strong but oversold trend condition and Friday payroll report. Our published record lays out how we grade these calls.
The dominant driver was the rates channel, not the haven channel, as rising real yields and a firmer dollar overwhelmed a standing geopolitical bid and the metal fell 2.79 percent on the proxy during active military escalation. Gold is the only instrument in the package with a confirmed downtrend, at 36.18 on the nine-day directional index with the negative component dominating. Beneath the 4,428 line the tilt favors selling strength into the 4,382 to 4,400 band toward the 4,334 overnight low. Selling the rally that stalls, half size, is the trade.
A haven that falls hard on a day of active military conflict is a market telling its own story: the rates channel is in charge, and the trend indicator confirms it. The edge is selling strength into the 4,382 to 4,400 supply band, and a sustained reclaim of the 4,425.5 pivot is the line that flips the read from short to sidelined.
This is the read our members get every session, before the bell, with the levels drawn and the setup defined. See how the same dealer-positioning work turns into systematic signals.
View pricingThe complete data picture
Every number behind Wednesday’s plan, charted first; the full numeric reference follows underneath.
Full numeric reference, every remaining figure from the review
| Average | Value | Settle vs |
|---|---|---|
| 5-day | 4,485.3 | below by 88.9 |
| 20-day | 4,502.5 | below by 106.1 |
| 50-day | 4,282.0 | above by 114.4 |
| 100-day | 4,461.2 | below by 64.8 |
| 200-day | 4,641.5 | below by 245.1 |
| Level | Reference |
|---|---|
| 5,781.8 | 52-week high, set January 29, a distant reference |
| 4,755.0 | August rally high, the one-month and thirteen-week peak, now fully retraced |
| 4,697.7 | August 27 high, the top of the five-day window |
| 4,683.0 | year-to-date average, a distant overhead reference |
| 4,641.5 | 200-day average, 245.1 points overhead |
| 4,567.9 | two standard deviation resistance |
| 4,566.3 | computed second resistance |
| 4,560.3 | raw stochastic at 50 |
| 4,529.1 | eighteen-day average crossing |
| 4,517.7 | one standard deviation resistance |
| 4,516.8 | 38.2 percent retracement of the 52-week range, now broken |
| 4,502.5 | 20-day average |
| 4,494.9 | 38.2 percent retracement from the four-week high |
| 4,485.3 | 5-day average |
| 4,481.4 | computed first resistance |
| 4,472.5 | 38.2 percent retracement from the thirteen-week high |
| 4,461.2 | 100-day average, the nearest long-horizon average overhead |
| 4,444.8 | fourteen-day relative strength at 50 |
| 4,443.4 | fourteen-by-three raw stochastic at 20 |
| 4,425.5 | computed pivot point, the first decision level |
| 4,414.5 | 50 percent retracement of the four-week range |
| 4,399.7 | eighteen-day average stall, top of the fade band |
| 4,396.4 | December settle |
| 4,385.3 | 50 percent retracement of the thirteen-week range |
| 4,382 to 4,400 | supply band, the short entry, spanning the overnight high, the settle and the eighteen-day average stall |
| 4,382.0 | overnight high, base of the fade band |
| 4,340.6 | computed first support, top of the demand band, target 1 |
| 4,334.1 | 38.2 percent retracement from the four-week low |
| 4,333.9 | overnight low, the most recent lower low |
| 4,318.5 | computed target price |
| 4,315.3 | forty-day average crossing, target 2 |
| 4,298.1 | 38.2 percent retracement from the thirteen-week low |
| 4,284.7 | computed second support, target 3 |
| 4,282.0 | 50-day average, the last average still held |
| 4,000.0 | spot support, a structural objective |
| 3,734.9 | 52-week low, a distant reference |
| Metric | Reading |
|---|---|
| Gold-ETF proxy price | 397.03, down 2.79 percent from 408.44, the positioning reference for the metal |
| Call-side dealer gamma | about negative 342.56 million, the inverse of the usual arrangement |
| Put-side dealer gamma | about positive 137.04 million, the smaller leg |
| Net configuration | dealer hedging amplifies upside and partially absorbs downside, arguing for sharp counter-trend squeezes rather than an accelerating decline |
| One-day options-implied move | about 5.57 on the proxy, roughly 1.40 percent, mapping to about 62 gold points around the 4,396.4 settle |
| Implied-vol rank | about 24 percent, one-month implied volatility 21.61 percent against 27.78 percent realized, implied beneath realized by 6.17 points yet the highest of the four instruments |
| Skew rank | elevated near 73 percent, meaningful downside-protection demand |
| Put-to-call open interest | 0.49, call-heavy on an outright basis, with Tuesday volume near balanced at 1.02 puts per call, 201.92 thousand puts against 197.53 thousand calls |
| Top expiry concentration | both top gamma expiry and top delta expiry fall on September 18, 2026, monthly expiration about two weeks out, arguing for level adherence into that date |
| Volatility reference labels | the high reference at 415 and the low reference at 465 print inverted and are excluded from the level map as unreliable |
| Input | |
|---|---|
| Fed and policy | Jackson Hole commentary was read as signalling unfinished work on inflation, one investment-bank note observing that a rate increase by December is now fully priced, and a Federal Reserve official cautioned on August 28 that better summer inflation data should not be read as meaningful improvement |
| 10-year yield | rose to 4.802 percent with the associated index higher by 0.80 percent, lifting the real-yield cost of holding a non-yielding asset directly |
| Dollar | the dollar index firmed to 99.747, higher by 0.09 percent, the second condition under which the metal reliably underperforms |
| Inflation data | the most recent headline personal consumption expenditures price index printed 3.7 percent year over year against a 3.6 percent forecast, keeping the disinflation story stalled |
| Crude oil | the international benchmark settled at 94.65 dollars, higher by 4.16 dollars or 4.6 percent, with the domestic front contract above 90 dollars and European gas at its highest since 2023 |
| Geopolitics | an escalating United States and Iran military exchange ran through the New York afternoon, with strikes on airports, ports and radar and a Strait of Hormuz tightening statement, yet the metal fell 2.79 percent on the proxy, the haven channel subordinate to the rates channel |
| Metals complex | silver fell 1.34 percent, meaningfully less than gold proxy decline of 2.79 percent, gold underperforming silver on a risk-negative day, the signature of a gold-specific positioning unwind rather than a general metals liquidation |
| Equities and rotation | technology fell sharply, software down 4 percent, memory names 3 percent and semiconductors 2 percent, while healthcare gained 0.7 percent and energy 1.3 percent, capital rotating into energy and defensives rather than into precious metals |
| Volatility | the broad-market volatility index closed at 16.33, higher by 9.38 percent and its best close in a month, with the volatility-of-volatility measure up 5 points to 91 and closing at its high |
| Breadth and positioning | the NYSE advance-decline closed negative 1,028, a deterioration of 383, with proxy call gamma negative 342.56 million against put gamma positive 137.04 million, dealers set to amplify upside and partially absorb downside |
| When | Event |
|---|---|
| Wed Sep 2 | the employment change survey at 8:15 AM ET, 45 thousand consensus against a prior 44 thousand, with the Bank of Canada decision at 9:45 AM ET and factory orders at 10:00 AM ET, the employment survey the first-order read for gold through the real-yield path |
| Fri Sep 4 | the monthly employment report at 8:30 AM ET, 58 thousand consensus against a prior negative 23 thousand, the week decisive forward catalyst for the rate path |
| Thu Sep 11 | the consumer price index, the next major inflation print framing the balance of the month |
| Sep 16 to 18 | the policy meeting with updated projections on September 16 and monthly expiration on September 18, coinciding with top gamma and top delta expiry for this complex |
The economic releases referenced above are published on the official government calendars below. Price levels are derived from standard technical and statistical methods, and the market read is AlgoIndex's own analysis. How we grade these calls is set out in our performance methodology.
- US Bureau of Economic Analysis, Personal Income and Outlays (PCE)
- US Bureau of Economic Analysis, Gross Domestic Product
- US Bureau of Economic Analysis, release schedule
- US Census Bureau, Advance Durable Goods (M3) release schedule
- US Energy Information Administration, Weekly Petroleum Status Report
- US Department of the Treasury, auction schedule and results
- AlgoIndex performance methodology



