At 11:30 AM ET on Monday a 30-minute bar opened at 29,950.00 and carried the December Nasdaq-100 contract to 29,983.50. That was the session high. It sat 12.34 points above 29,971.16, the December equivalent of the modeled gamma-flip level. The bar closed at 29,931.00. Nothing traded higher. The low of 29,226.00 had printed in the very first bar, which opened at the Sunday 6:00 PM ET reopen.
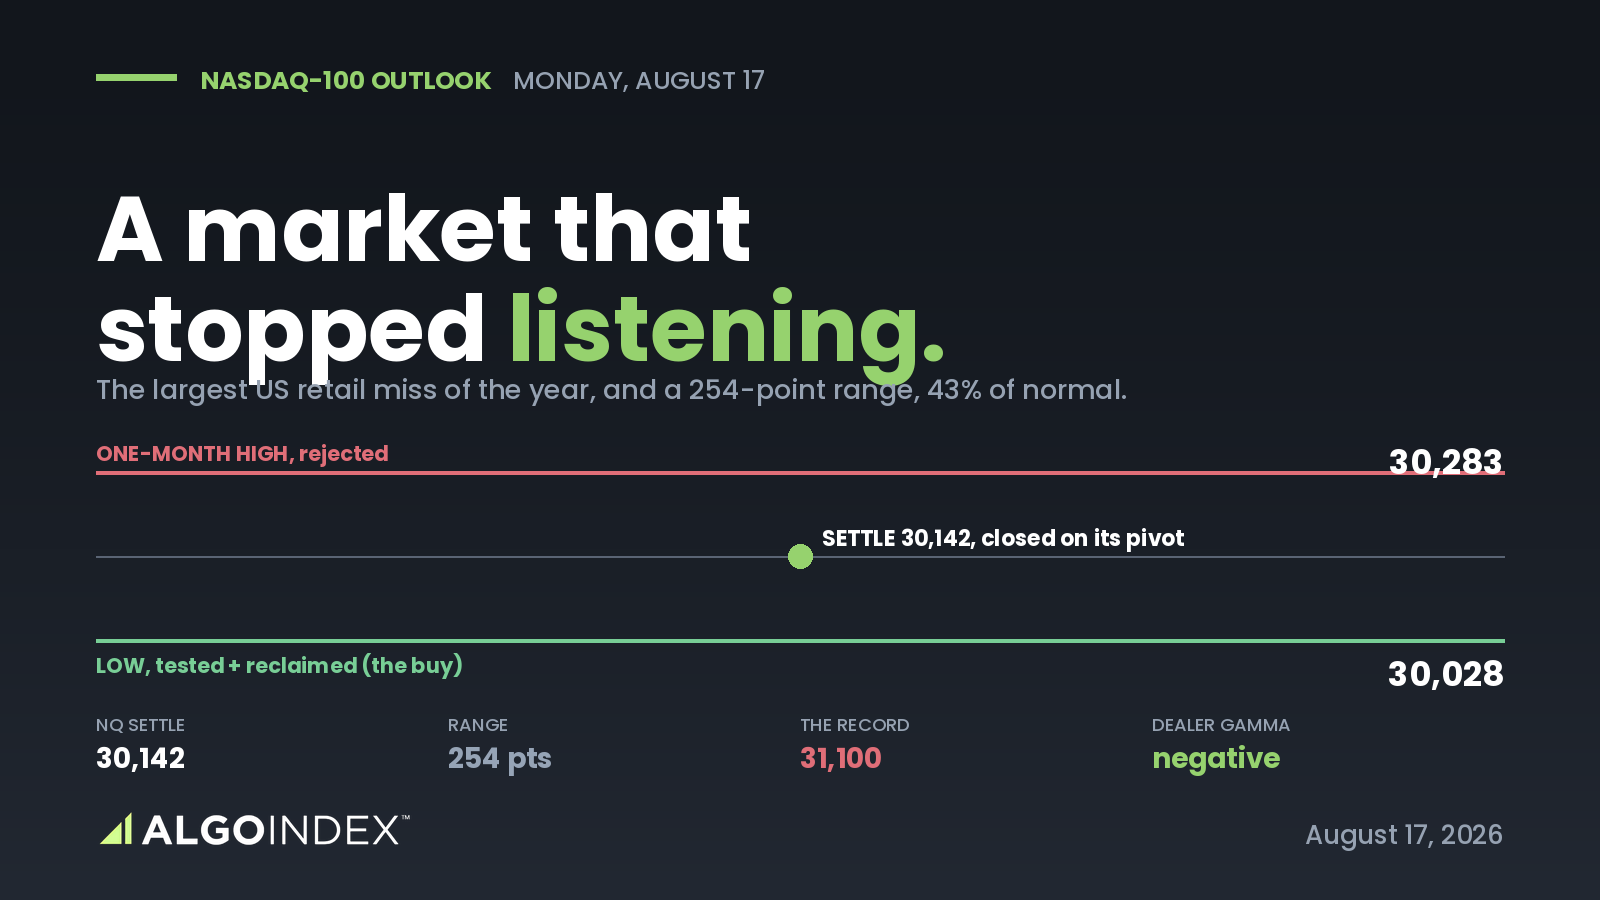
The climb ran from that first bar into late morning. The 11:00 PM ET bar closed at 29,773.75 and the 2:00 AM ET bar reached 29,813.50. The 10:00 AM ET bar dipped to 29,653.75 and then closed at 29,841.75. The afternoon gave ground. The contract settled at 29,722.50, up 331.00 points, or 1.13 percent, from Friday's 29,391.50. That was the largest gain since the 867.50 point rise of 09/21. It ended five consecutive lower settles. Monday still printed a lower high and a lower low against Friday, and the settle finished at 65.5 percent of a 757.50 point range, 261.00 points under the high.
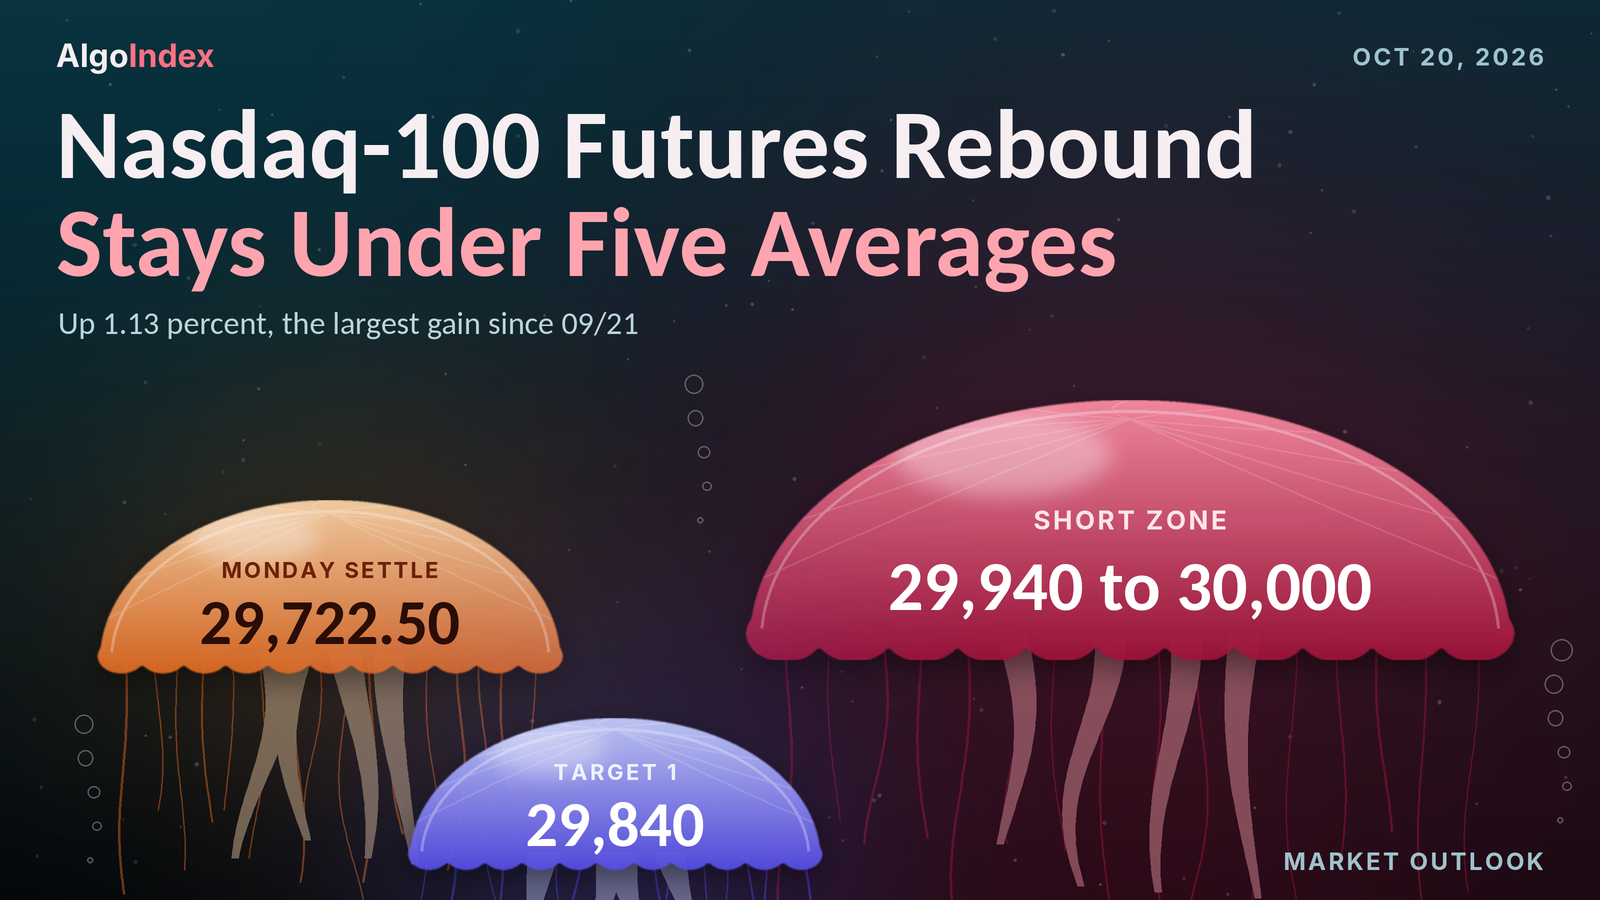
December Nasdaq-100 futures settled at 29,722.50, up 331.00 points, ending five lower settles after a session that finished at 65.5 percent of a 757.50 point range. The settle sits beneath every settlement average from the 5-day to the 100-day and 1,405.61 points above the 200-day. The primary setup is a short from 29,940 to 30,000, a band around 29,971.16, the December equivalent of the modeled gamma-flip level, stop 30,100 above Pivot R1 at 30,062.00, targets 29,840, 29,710 and an extended 29,580. The whole band sits 217.50 to 277.50 points above the settle. Target 2 sits 12.50 beneath it. A streaming company reports at 4:01 PM ET Tuesday, after the 4:00 PM ET settlement, as the calendar lists it.
Monday's short band traded in the second bar, and the 29,800 stop printed in the 1:30 AM ET bar
In Monday’s outlook we set a short from 29,600 to 29,660, stop 29,800. Its targets sat at 29,460, 29,290 and an extended 29,120. Monday's bar, from the review, opened at 29,227.00 at the Sunday 6:00 PM ET reopen, marked a high of 29,983.50 and a low of 29,226.00, and settled at 29,722.50. The band traded. So did the stop level. The settle finished 62.50 points above the band top and 77.50 beneath the stop, and the high ran 183.50 points past the stop.
The 30-minute record sets the order. The reopen bar opened 63.00 points beneath the 29,290 second target and 233.00 beneath the 29,460 first target, printed the session low of 29,226.00 and closed at 29,555.75. Its 29,559.75 high stopped 40.25 points under the band. Both targets had printed before the band ever traded. The extended 29,120 target never printed, and the low held 106.00 points above it. The 6:30 PM ET bar was the first to reach the band, trading up to 29,624.50. From that bar on, nothing traded beneath 29,552.25, 92.25 points above the first target. Prints made before the band traded score nothing.
The card's other lines were tested too. Its acceptance test needed two consecutive 30-minute closes above 29,660. The 9:00 PM ET bar closed at 29,674.00 and the 9:30 PM ET bar at 29,680.75, both on Sunday evening, and that met it. Every later close stayed above 29,660. The 1:30 AM ET bar traded to 29,804.25, the first print above the 29,800 stop, and the 2:00 AM ET bar reached 29,813.50. The band saw one more visit. The 10:00 AM ET bar dipped to 29,653.75, 6.25 points under its top. The invalidation needed a settle above Pivot R1 at 29,988.08. The settle finished 265.58 points beneath it, and the high stopped 4.58 short. No fill and no result is asserted.
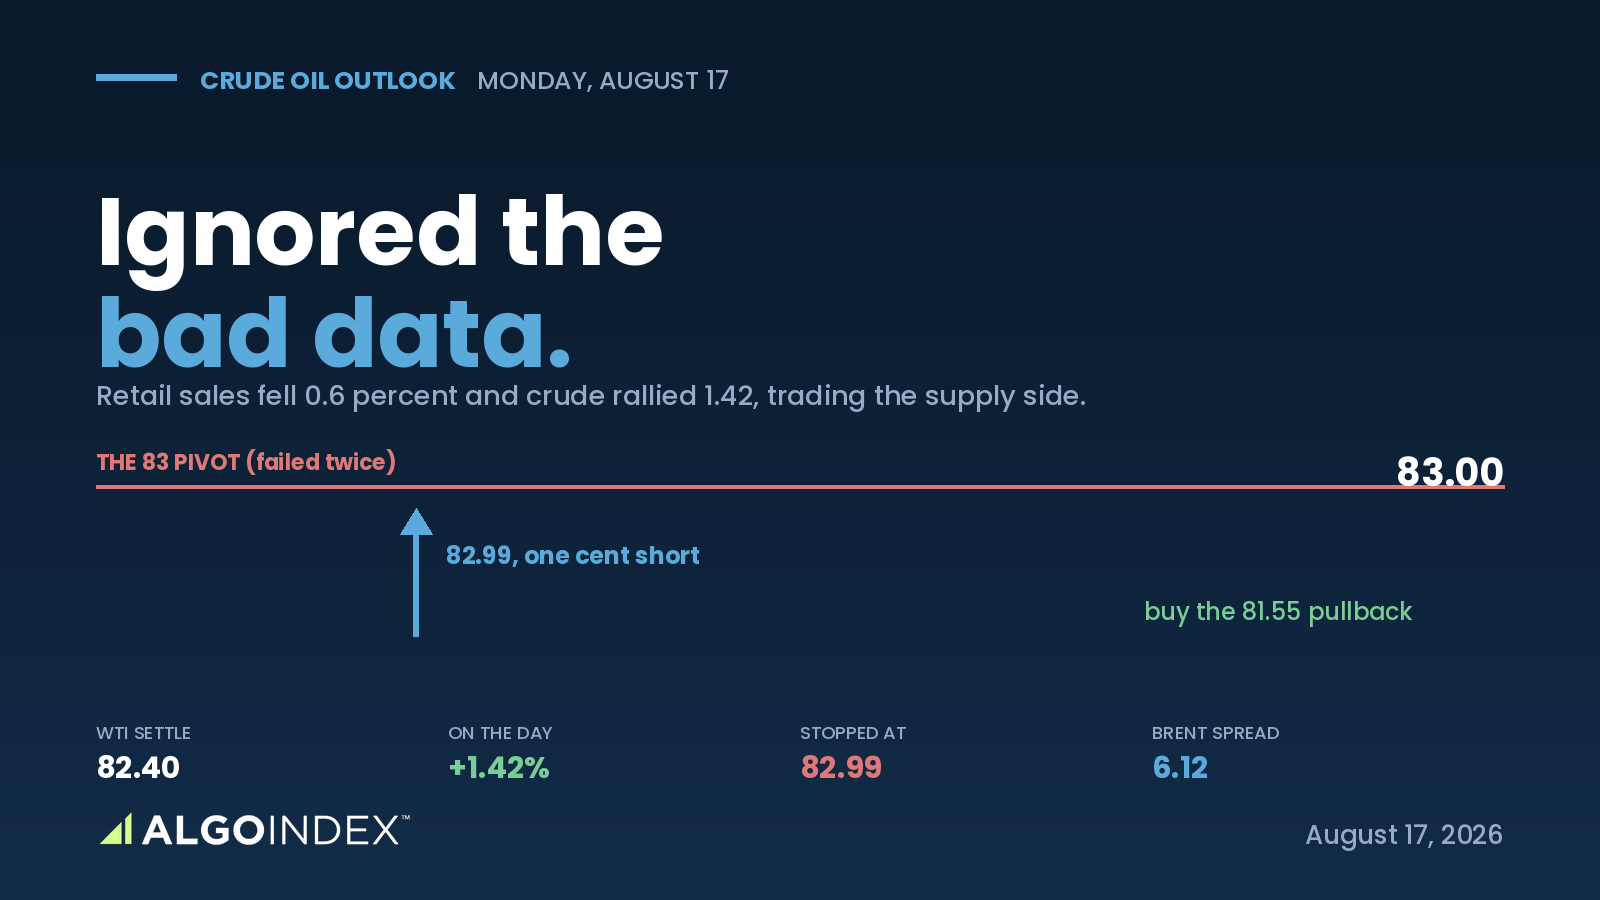
Its macro override named a weekend headline that eases the artificial-intelligence financing concerns, or a Gulf de-escalation that pulls crude lower. Crude rose. November WTI settled at 103.66, up 2.22 percent. The news feed's market wrap described chip stocks rebounding on artificial-intelligence optimism ahead of earnings, and at 6:38 AM ET the feed carried a press report that a de-escalation step between Washington and Tehran is expected this week. Those are statements carried by the news feed, and no causal link to the contract is asserted. The override's references were Pivot R1 at 29,988.08 and Thursday's 30,143.75 settle. The high reached neither. It stopped 160.25 points under the settle reference.
Our ranges broke higher. The night band of 29,050 to 29,700 gave way in the 9:30 PM ET bar, by 1.00 point, and the night bars through 2:30 AM ET reached 29,813.50, 113.50 above its top. London's 29,000 to 29,750 broke in the 3:00 AM ET bar, by 50.00. The morning band of 28,880 to 29,900 broke in the 11:00 AM ET bar and the afternoon band, the same, in the 12:00 PM ET bar, by 83.50 and 33.75 at their highs. No band broke lower. The low-range case of 29,050 to 29,700 broke by 283.50 points and the most likely case of 28,880 to 29,900 by 83.50. The high-range case of 28,540 to 30,250 held all session. The most probable path, an analyst judgment, kept the contract between one standard deviation support at 28,787.08 and one standard deviation resistance at 29,995.92. It held. The high stopped 12.42 beneath the upper line. Its weighting of a rally that fails beneath the 29,703.95 conversion did not hold: the high ran 279.55 points above that conversion, and the settle finished 18.55 above it. The alternative, a relief rally through Pivot R1 at 29,988.08 toward Thursday's 30,143.75 settle, fell 4.58 points short of its first line.
The 29,971.16 flip equivalent, the 29,940 to 30,000 band and Pivot R1 at 30,062.00
The basis narrowed to 193.16 points, the 29,722.50 settle less the 29,529.34 cash close, from 203.95 on Friday. Every December equivalent of a positioning level in this article uses it: 29,971.16 for the modeled gamma-flip level at NDX 29,778, 29,868.16 for the largest gamma concentration and primary call side ceiling at NDX 29,675, and 29,693.16 for the modeled volatility threshold at NDX 29,500. The conversions are the review's own. The desk note does not make them.
Resistance starts 145.66 points up, at the 29,868.16 concentration equivalent. Then the band. The 29,943.15 momentum projection level sits 3.15 points above its 29,940 bottom and the 29,971.16 flip equivalent 31.16 above it. Monday's 29,983.50 high sits 16.50 beneath its 30,000 top. A tight grouping follows. The 38.2 percent retracement from the 13-week high at 30,037.12, the 100-day average at 30,043.22, the 5-day average at 30,046.40 and Pivot R1 at 30,062.00 span 24.88 points. Then the stop, at 30,100. The 38.2 percent retracement from the four-week low at 30,139.17, Thursday's 30,143.75 settle, the 50-day average at 30,174.25, Friday's 30,225.00 high, the 40-day crossing price at 30,229.50 and one standard deviation resistance at 30,250.95 sit beyond it. The list keeps climbing. The 9-day crossing price at 30,401.06 and Pivot R2 at 30,401.50 sit 0.44 apart, with the 50 percent retracement of the four-week range at 30,421.25 just above. Two standard deviations resistance at 30,469.84, the 9-day average at 30,512.31, three standard deviations resistance at 30,637.81, the 18-day crossing price at 30,705.97, the 20-day average at 30,728.08 and Pivot R3 at 30,819.50 come next. The 31,289.25 high of 10/12 and the 31,616.50 52-week high of 10/06 cap the list.
Support starts 18.40 points down, at the 29,704.10 momentum projection level, with the 29,693.16 threshold equivalent 10.94 beneath it. The Pivot Point at 29,644.00 follows. The 50 percent retracement of the 13-week range at 29,549.25 and the published target price at 29,475.81 come next. Then a tight run. The 40-day average stall level at 29,394.75 sits 3.25 points above Friday's 29,391.50 settle. Pivot S1 at 29,304.50 sits 87.00 beneath that settle. Friday's 29,268.75 low, Monday's 29,227.00 open, Monday's 29,226.00 low, also the one-month low, and one standard deviation support at 29,194.05 span 74.70 points. Deeper levels follow. The 38.2 percent retracement from the 13-week low at 29,061.38, the 29,053.00 low of 09/16, two standard deviations support at 28,975.16, Pivot S2 at 28,886.50, three standard deviations support at 28,807.19 and Pivot S3 at 28,547.00 form the deeper band. The 200-day average at 28,316.89 and the 27,482.00 13-week low lie far below. The 52-week low sits at 23,429.00.
Every average from the 5-day to the 100-day sits overhead. The settle is 323.90 points beneath the 5-day, 789.81 beneath the 9-day, 1,005.58 beneath the 20-day, 451.75 beneath the 50-day and 320.72 beneath the 100-day. It is 1,405.61 above the 200-day. The 5-day fell 235.15 points from 30,281.55 as the 10/12 settle of 30,898.25 left the window and 29,722.50 replaced it. The 20-day fell 53.11 from 30,781.19 as the 09/21 settle of 30,784.75 dropped out. Older settlements sit lower. The 30 older ones in the 50-day window averaged 29,805.03, and the 50 older ones in the 100-day window 29,912.19. Tuesday's crossing prices are 30,401.06 for the 9-day, 30,705.97 for the 18-day and 30,229.50 for the 40-day.
Momentum stayed weak. Relative strength reads 34.34 on the 9-day, 40.13 on the 14-day and 44.07 on the 20-day. The raw stochastics read 21.63 percent on the 9-day and 20.77 percent on the 14-day, and the 14-day %K at 17.38 percent sits marginally beneath %D at 17.53 percent, near the bottom of the range. Sellers still lead. On the 9-day, negative direction at 32.88 tops positive at 8.75 by 24.13, with the ADX at 33.01; on the 14-day, 29.56 tops 12.82 by 16.74, with the ADX at 21.06. Historic volatility reads 16.53 percent and 16.82 percent. These readings are as published, read at 6:26 PM ET after the 6:00 PM ET reopen. They may include the first minutes of the Tuesday session.
A composite multi-indicator read published for Tuesday holds at 40 percent sell, unchanged from the prior session, with strength average and direction weakening. A week ago it read 48 percent buy. A month ago, 40 percent buy. The short-horizon group averages 60 percent sell, the medium 25 percent sell and the long hold, and the trend indicator reads sell.
Look at the bar's shape. Its body measures 495.50 points from the 29,227.00 open, its upper shadow 261.00 above the settle and its lower shadow 1.00 point beneath the open. The 14-day average true range stands at 529.65 points, shown as 1.78 percent on the provider's page, and the 14-day average daily range at 534.70; the 9-day figures are 563.45 and 580.75 and the 20-day figures 517.29 and 501.44. One average true range either side of the settle spans 29,192.85 to 30,252.15. The deviation bands, built from five settlements, run 29,194.05 to 30,250.95, 28,975.16 to 30,469.84 and 28,807.19 to 30,637.81, and describe settlement dispersion only. Earnings can open the market outside any of them. Eight sessions of daily ranges read 674.00, 313.50, 445.00, 314.75, 813.50, 574.25, 956.25 and 757.50 points. The six settles before Monday ran 31,108.75, 30,898.25, 30,791.50, 30,182.75, 30,143.75 and 29,391.50. The provider's overview puts the 31,616.50 52-week high 5.99 percent above the settle. From the two prices, the 1,894.00 point gap computes to 6.37 percent of the settle; 5.99 percent is its share of the high. The 13-week low of 27,482.00 and the 52-week low of 23,429.00 frame the lower side. No prior-quarter extremes were captured, so the 13-week extremes stand in.
A 1.61 percent chip rebound, a 5.14 percent ten-year yield and crude at 103.66
Chips led. The news feed's market wrap, headlined “Chip Stocks Rebound as AI Optimism Lifts Nasdaq Ahead of Earnings”, and provider commentary both described Monday's gain as led by chipmakers and artificial-intelligence infrastructure stocks after last week's selloff, with earnings optimism ahead of reports from a social-media group, an electric-vehicle maker and a streaming company. The desk note said the largest technology shares rose about 2 percent and attributed bullish single-stock options flow to them ahead of earnings. Those accounts are the sources'. No causal link to the contract is asserted here.
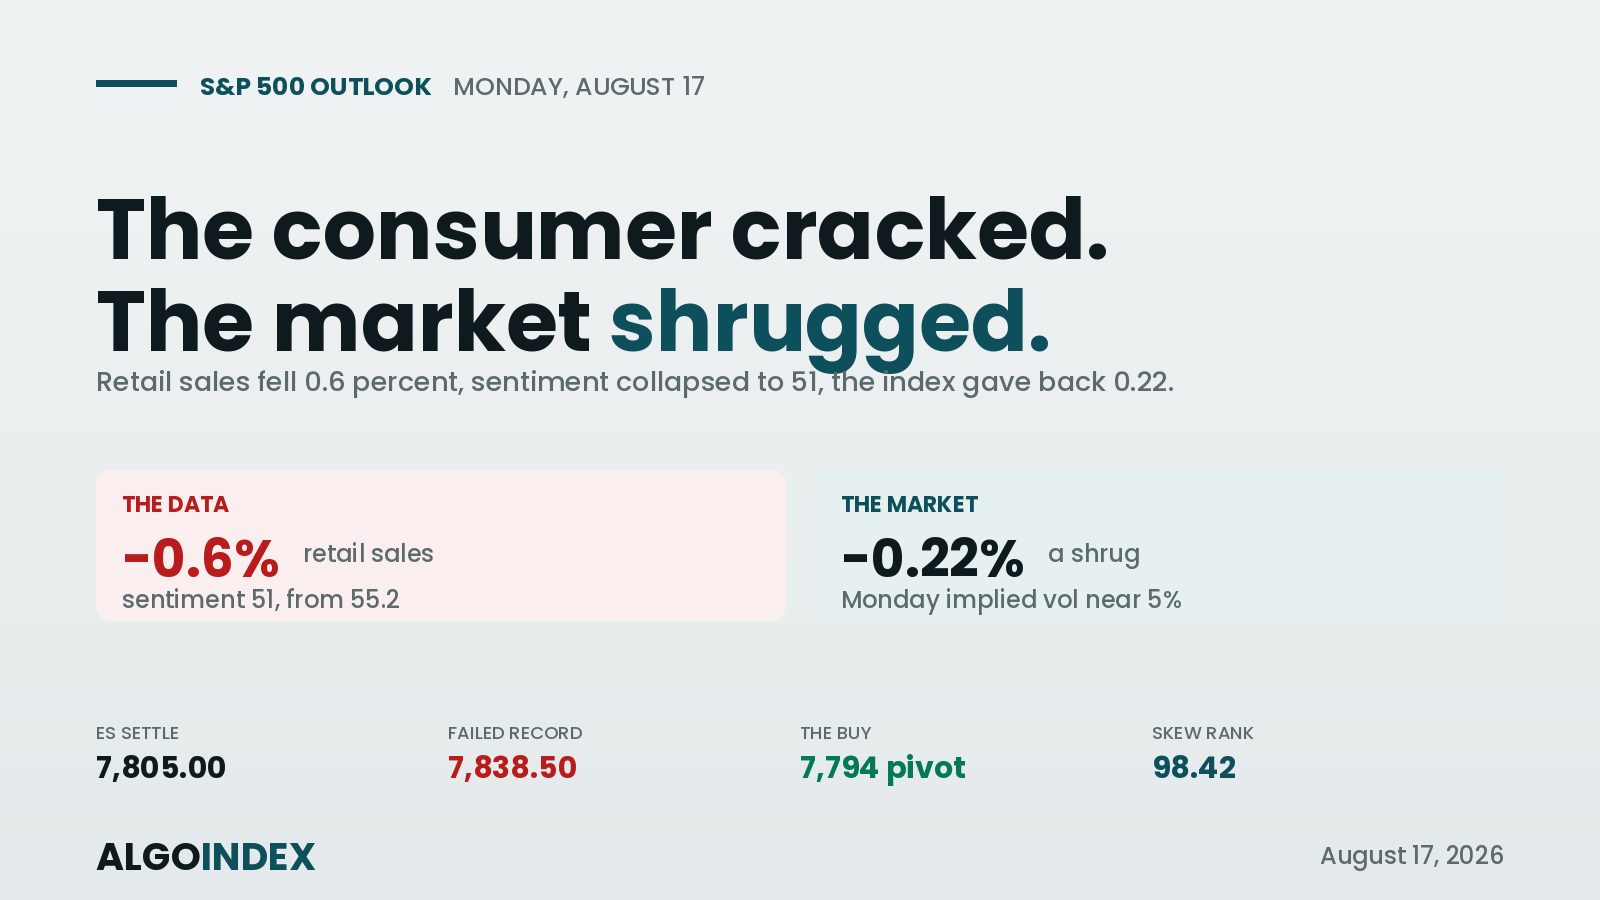
Semiconductors closed near their lows. The index finished at 11,316.34, up 1.61 percent from Friday's 11,137.29, after trading between 11,293.45 and 11,550.92, so it closed 22.89 points above its low. The desk note said the semiconductor fund rose about 2 percent and the Nasdaq-100 fund about 1 percent. The Nasdaq-100 cash index outperformed. It closed at 29,529.34, up 1.17 percent, against 0.41 percent for the S&P 500 cash index, while the Dow industrials slipped 0.07 percent.
Company items arrived through the afternoon. From 12:02 PM ET to 12:05 PM ET the feed carried press reports that a Chinese artificial-intelligence developer and a Chinese telecommunications equipment maker are working on chips. At 1:31 PM ET and 3:51 PM ET it carried items on the leading graphics-chip maker's investments in Germany. At 3:24 PM ET it carried a report that an artificial-intelligence cloud provider and an artificial-intelligence model developer are in talks on a 45 billion dollar cloud computing deal. The record sets those times beside the bars. It assigns no cause.
Earnings start Tuesday. A streaming company reports at 4:01 PM ET on Tuesday, October 20, 2026, as the calendar lists it, after the 4:00 PM ET settlement. The desk note cited an options-implied move of 8 percent for it. A social-media group, an electric-vehicle maker, an information-technology group and an analog chip maker report after the close on Wednesday, October 21, 2026, as the calendar lists them.
Yields rose. The ten-year yield index closed at 5.14 percent against 5.09 percent on Friday, and the thirty-year index at 5.47 percent against 5.43 percent. Provider commentary tied the rise in inflation expectations to higher crude. Canadian consumer prices printed at 8:30 AM ET at 3.1 percent year over year against a 3.2 percent forecast, per the news-feed calendar, and the homebuilder sentiment index printed 29 at 10:00 AM ET against a 31 forecast, per the news-feed calendar. The next policy statement is scheduled for 2:00 PM ET on October 28, 2026, as the calendar lists it. No inflation-protected yield series was captured. Real yields are not measured here.
Gulf headlines ran all day. The news feed carried Iranian statements on asserting control over the Strait of Hormuz, Houthi claims of attacks on Saudi energy sites, and at 2:22 PM ET an Iranian naval claim of a US attack that a US official described as inaccurate at 2:29 PM ET, via press reports. A press report carried at 6:38 AM ET said a de-escalation step between Washington and Tehran is expected this week, and the President described a good situation with respect to Iran at 3:19 PM ET. These are statements carried by the news feed rather than confirmed events. No causal link to the index is asserted.
Volatility eased. The Nasdaq-100 volatility index closed at 25.56 against 27.13 on Friday, and the volatility index at 18.44 against 19.99. The desk note said the volatility index fell 8 percent and the volatility-of-volatility index 3 percent to 107; from the 19.99 and 18.44 closes, the volatility index change computes to 7.75 percent. The dollar index closed at 101.98, up 0.14, and November WTI crude settled at 103.66, up 2.22 percent.
The cash close sits between two model lines. The desk note read is the 5:21 PM ET edition for Monday, read at 6:18 PM ET, and its reference prices are the prior session's closes: NDX 29,187 matches Friday's 29,187.55 cash close, and QQQ 709 matches the console's 709.93 previous-close field. The note runs a day behind. Against Monday's 29,529.34 close, the index sits 29.34 points above the 29,500 modeled volatility threshold, 145.66 beneath the 29,675 largest gamma concentration, which is also the primary call side ceiling, and 248.66 beneath the 29,778 modeled gamma-flip level. The primary put side support base sits at 28,000. The index model's gamma tilt reads 0.679 and its gamma notional minus 10.133 million dollars, both model outputs. The note lists 29,675, 29,000, 30,000 and 28,000 as key index strikes.
On the QQQ proxy the call-side ceiling sits at 760, the largest concentration and the put-side base both at 700, and the flip level and threshold both at 730. The fund's gamma tilt reads 0.483 and its gamma notional minus 1.165 billion dollars, proxy model outputs. Its console, read at 6:20 PM ET with a date of 2026-10-19, shows a current-price field of 718.83 and a change of plus 1.25 percent. Both gamma fields are negative. Call gamma reads minus 1.25 billion against put gamma of minus 2.58 billion. One-month implied volatility reads 22.55 percent against realised volatility of 18.55 percent, the implied-volatility rank 52.43 percent and the put-to-call open-interest ratio 1.39. In the review's interpretation, drawn from the index model and the QQQ fund proxy, a cash close beneath the flip level with negative gamma notional on both the index and the fund describes positioning that is less likely to dampen moves, which matters ahead of three days of large earnings releases. That is a damping read. It carries no direction. The flip level and threshold are model outputs.
Flow got a description too. The desk note characterised index options flow as bearish and single-stock flow as bullish, concentrated in the largest technology names ahead of earnings. Those characterisations are the note's. The console reports volume and modeled gamma without trade side, so no directional read is drawn from them here. The volatility index options expiration at 9:30 AM ET on Wednesday is listed by the desk note, unconfirmed.
Activity eased. Volume reached 618,989 contracts against Friday's 817,879, a figure revised from the 797,480 carried in Monday's outlook. Open interest read 280,923 on Friday's 2026-10-16 row, up from 274,603 on the 2026-10-15 row, and Monday's figure is not yet reported. No weekly positioning report was captured, so no managed-money or commercial figure is asserted.
The trade map for Tuesday
The primary setup is a short from 29,940 to 30,000. Monday's gain ended five lower settles, yet the settle sits beneath every average from the 5-day to the 100-day, negative direction leads on both windows and the composite holds at 40 percent sell. The band sits around the 29,971.16 flip equivalent, and Monday's high stalled 12.34 points above that line. It is a positioning reference. It casts no vote on direction. The stop at 30,100 sits 38.00 points above Pivot R1 at 30,062.00 and 62.88 above the 38.2 percent retracement at 30,037.12. All of the band sits above the settle. Reaching it takes a climb of at least 217.50 points, so the thesis is that rallies stall beneath the flip conversion. The targets sit at 29,840, 28.16 beneath the 29,868.16 concentration equivalent, 29,710, 12.50 beneath Monday's settle, and an extended 29,580, 30.75 above the 50 percent retracement at 29,549.25. Caveats remain. Monday's 331.00 point gain ended five lower settles and three days of earnings releases lie ahead, so the review calls the setup an analyst judgment with no measured edge behind it.
Now the arithmetic. From the 29,970 midpoint the risk to the stop is 130 points, 24.5 percent of the 14-day average true range of 529.65. The targets sit 130, 260 and 390 points beneath the midpoint. Exact multiples. The midpoint sits 1.16 points beneath the flip equivalent. The first target, 29,840, sits 100.00 points beneath the band bottom and 117.50 above the settle. The second sits just under the settle. The stop sits 377.50 points above it.
The scenario ranges are analyst judgment. The low-range case runs 29,500 to 29,990, the most likely 29,350 to 30,150 and the high-range case 29,190 to 30,400. Then the sessions. Globex reopened at 6:00 PM ET on Monday, and the review expects roughly 29,550 to 29,950 through the night session, with a neutral bias beneath the 29,971.16 flip conversion. The overview's first prints, 29,745.25 to 29,772.50, sit inside that band. A move above Monday's 29,983.50 high opens Pivot R1 at 30,062.00. A move beneath the Pivot Point at 29,644.00 opens the 29,549.25 retracement. London follows at 29,500 to 29,990, neutral to lower, with the 29,940 to 30,000 band the first meaningful resistance and the Pivot Point the first meaningful support. The morning band runs 29,400 to 30,100. Pivot R1 sits inside it, 38.00 points under its top, and the 29,475.81 target price 75.81 above its bottom. The afternoon band runs 29,350 to 30,150. Monday's 4:00 PM ET bar closed at 29,735.75 and the 4:30 PM ET bar at 29,743.75; those post-settlement quotes are not used as the settlement anywhere here.
Tuesday's calendar started Monday evening. The President is listed to speak at 7:00 PM ET and China's loan prime rates at 9:00 PM ET, both per the news-feed calendar and unconfirmed. The UK labour report and German producer prices are listed at 2:00 AM ET Tuesday and the German sentiment survey at 5:00 AM ET, all per the news-feed calendar and unconfirmed. Then the data. Housing starts and building permits print at 8:30 AM ET on Tuesday, October 20, 2026, as the calendar lists them, with forecasts of 1.3 million and 1.385 million on the news-feed calendar. The cash open is at 9:30 AM ET. Pending home sales are listed at 10:00 AM ET, per the news-feed calendar and unconfirmed. Equity index futures settle at 4:00 PM ET. The streaming company reports at 4:01 PM ET, as the calendar lists it, so the earnings reaction belongs to the evening session. A space-launch company's quarterly report is listed at 4:15 PM ET, per the news-feed calendar and unconfirmed. Globex reopens at 6:00 PM ET on Tuesday with the streaming result in hand.
One path is weighted. In the review's analyst judgment the most probable path holds the contract between Pivot S1 at 29,304.50 and Pivot R1 at 30,062.00, with a rally toward the 29,940 to 30,000 band that fails beneath Pivot R1 weighted above a sustained recovery. No measured frequency backs it. The alternative is a continuation of Monday's chip-led rebound into the earnings releases, carrying the contract through Pivot R1 toward the 40-day crossing price at 30,229.50. Monday's 331.00 point gain ended five lower settles, and the settle sits 1,405.61 points above the 200-day average. That keeps the alternative live. In the review's judgment the first-order event for the Nasdaq-100 is the streaming company at 4:01 PM ET on Tuesday, October 20, 2026, as the calendar lists it, the first of three days of large earnings releases.
The 29,983.50 high that capped Monday now sits inside Tuesday's short band, 16.50 points under its top.
The complete data picture
Every number behind Tuesday’s plan, charted first, then the full level lists, then the complete numeric reference underneath.
Full numeric reference, every remaining figure from the session review
1. Executive Summary
The December Nasdaq-100 contract settled at 29,722.50 on Monday, up 331.00 or 1.13 percent from Friday's settle of 29,391.50, after trading between 29,983.50 and 29,226.00, a 757.50 point daily range. The settle finished at 65.5 percent of the range, and the 757.50 point range was 1.42 times the published 14-day average daily range of 534.70 points. Monday printed a lower high and a lower low against Friday, and the higher settle ended a run of five consecutive lower settles.
The 331.00 point gain was the largest since 09/21. The Nasdaq-100 cash index closed at 29,529.34, up 1.17 percent, and the semiconductor index rose 1.61 percent to 11,316.34; the news feed's market wrap described chip stocks rebounding on artificial-intelligence optimism ahead of earnings. The session low of 29,226.00 printed in the first bar after the Sunday 6:00 PM ET reopen, and the session high of 29,983.50 printed in the 11:30 AM ET bar of the 30-minute series.
The settle sits beneath the 5-day, 9-day, 20-day, 50-day and 100-day settlement averages and above the 200-day. The cash close sits 248.66 points beneath the modeled gamma-flip level at NDX 29,778 and 29.34 points above the modeled volatility threshold at NDX 29,500 in the desk note's Monday edition, and the measured closing basis narrowed to 193.16 points from 203.95 on Friday. The composite snapshot reads 40 percent sell, unchanged from the prior session.
The published 14-day average true range is 529.65 points, shown as 1.78 percent on the provider's page. A streaming company reports at 4:01 PM ET on Tuesday, October 20, 2026, as the calendar lists it, and a social-media group and an electric-vehicle maker report after the close on Wednesday, October 21, 2026, as the calendar lists them. The Primary Setup below is a short from the 29,940 to 30,000 band around the 29,971.16 conversion of the modeled gamma-flip level, stopped at 30,100 above Pivot R1 at 30,062.00, with objectives at 29,840, 29,710 and an extended 29,580.
2. Price Action & Technical Structure
2.1 Intraday and Session Review
The Monday session opened at 29,227.00 at the Sunday 6:00 PM ET reopen, 164.50 points beneath Friday's settle, marked a daily high of 29,983.50 and a daily low of 29,226.00, and settled at 29,722.50. The 30-minute series for the session places the session low of 29,226.00 in the Sunday 6:00 PM ET bar, which traded up to 29,559.75 and closed at 29,555.75, and the session high of 29,983.50 in the 11:30 AM ET bar, which closed at 29,931.00.
The contract rose through the Asian hours: the 10:00 PM ET bar closed at 29,707.25, the 11:00 PM ET bar at 29,773.75 and the 2:00 AM ET bar traded up to 29,813.50. The 3:30 AM ET bar closed at 29,719.50, the 5:00 AM ET bar traded down to 29,669.00 and the 7:30 AM ET bar traded down to 29,665.50 before closing at 29,722.00.
The 9:30 AM ET bar traded between 29,683.25 and 29,807.00 and closed at 29,711.50, and the 10:00 AM ET bar traded down to 29,653.75 before closing at 29,841.75. The 11:00 AM ET bar closed at 29,950.00 and the 11:30 AM ET bar marked the high. The 12:00 PM ET bar closed at 29,855.75, the 12:30 PM ET bar traded down to 29,788.00, the 2:00 PM ET bar traded down to 29,705.25, the 3:00 PM ET bar traded up to 29,842.50 and the 3:30 PM ET bar traded between 29,709.00 and 29,838.25 and closed at 29,721.75. The 4:00 PM ET bar closed at 29,735.75 and the 4:30 PM ET bar at 29,743.75; those post-settlement quotes are not used as the settlement anywhere in this review.
Globex reopened at 6:00 PM ET on Monday for the Tuesday session, so the open, high and low shown on the provider's overview, 29,745.50, 29,772.50 and 29,745.25, belong to the new Tuesday session even though the page header carries Monday's date, and they are not Monday's range. Monday's completed-session extremes are taken from the settlement row and the preserved series, and they are also the completed-session inputs behind the published pivot ladder rather than an independently read bar. Pivot R3 at 30,819.50 minus Pivot S3 at 28,547.00, divided by three, returns 757.50, and Pivot R2 at 30,401.50 minus Pivot S2 at 28,886.50, divided by two, returns the same 757.50. Three times the Pivot Point of 29,644.00 less the 29,722.50 settle gives a high plus low sum of 59,209.50, which the pair of 29,983.50 and 29,226.00 reproduces exactly, and that pair reproduces all seven published rungs.
Independent corroboration: the provider's settlement row, the chart's completed daily bar and the extremes of the 30-minute series carry the same 29,983.50 high and 29,226.00 low, and the provider's one-month low of 29,226.00 equals Monday's low.
2.2 Daily Structure
Monday printed a lower high and a lower low against Friday: the 29,983.50 high sits 241.50 points beneath Friday's 30,225.00, and the 29,226.00 low sits 42.75 points beneath Friday's 29,268.75. The settle above the 29,227.00 open leaves a body of 495.50 points, an upper shadow of 261.00 points above the settle and a lower shadow of 1.00 point beneath the open.
Settlements over the last six sessions ran 31,108.75, 30,898.25, 30,791.50, 30,182.75, 30,143.75 and 29,391.50 before Monday's 29,722.50, so Monday ended a run of five consecutive lower settles. The low of 29,226.00 is the lowest since the 29,053.00 low of 09/16, and the 331.00 point gain the largest since 09/21.
The 52-week high of 31,616.50, set on 10/06, sits 5.99 percent above the settle on the provider's overview; from the two prices the 1,894.00 point gap computes to 6.37 percent of the settle, and 5.99 percent is its share of the high. The 13-week low of 27,482.00 and the 52-week low of 23,429.00 frame the lower side. No prior-quarter high or low was captured, so the 13-week extremes serve as the available quarterly reference.
2.3 4-Hour and Swing Structure
Daily ranges for the last eight sessions ran 674.00, 313.50, 445.00, 314.75, 813.50, 574.25, 956.25 and 757.50. The settlement changes over the same eight sessions read minus 432.75, plus 139.25, minus 210.50, minus 106.75, minus 608.75, minus 39.00, minus 752.25 and plus 331.00.
The retracement grid published for Tuesday places the 38.2 percent retracement from the 13-week high at 30,037.12, the 38.2 percent retracement from the four-week low at 30,139.17 and the 50 percent retracement of the four-week range at 30,421.25. Beneath, the 50 percent retracement of the 13-week range sits at 29,549.25 and the 38.2 percent retracement from the 13-week low at 29,061.38. No four-hour series was captured, so swing structure here rests on daily bars and the preserved 30-minute session.
2.4 Moving Averages
The averages cited in this subsection were computed from the provider's daily settlement series for the December contract, which holds 259 completed sessions through Monday; the partial Tuesday row returned after the 6:00 PM ET reopen was dropped before counting. The 5-day average stands at 30,046.40, the 9-day at 30,512.31, the 20-day at 30,728.08, the 50-day at 30,174.25, the 100-day at 30,043.22 and the 200-day at 28,316.89.
The 29,722.50 settle sits 323.90 points beneath the 5-day average, 320.72 points beneath the 100-day, 451.75 points beneath the 50-day, 789.81 points beneath the 9-day and 1,005.58 points beneath the 20-day, and 1,405.61 points above the 200-day. The 5-day average fell 235.15 from Friday's 30,281.55, because the 10/12 settle of 30,898.25 left the window and was replaced by 29,722.50. The 20-day fell 53.11 from 30,781.19, because the 09/21 settle of 30,784.75 left that window.
The 20-day average sits above the 50-day because the last 20 settlements averaged 30,728.08 against 30,174.25 for the full 50, which means the 30 older settlements in the 50-day window averaged lower, at 29,805.03. The 50-day sits above the 100-day because the 50 older settlements in the 100-day window averaged lower, at 29,912.19. The projection grid gives the prices at which each average would be crossed on Tuesday: 30,401.06 for the 9-day, 30,705.97 for the 18-day and 30,229.50 for the 40-day.
2.5 Oscillator and Trend Readings
The oscillator figures below are as published on the provider's technical page, read at 6:26 PM ET after the 6:00 PM ET reopen, so they may include the first minutes of the Tuesday session rather than the settle alone; they are the provider's published readings and were not computed here. The 9-day relative strength reads 34.34, the 14-day relative strength 40.13 and the 20-day relative strength 44.07.
The 9-day raw stochastic reads 21.63 percent and the 14-day raw stochastic 20.77 percent, while the 14-day stochastic %K reads 17.38 percent and the 14-day stochastic %D 17.53 percent, so %K sits marginally beneath %D near the bottom of the range.
The 9-day directional index ADX reads 33.01 with the 9-day +DI at 8.75 and the 9-day -DI at 32.88; the 14-day directional index ADX reads 21.06 with the 14-day +DI at 12.82 and the 14-day -DI at 29.56, so negative direction leads on both. The 9-day historic volatility reads 16.53 percent and the 14-day historic volatility 16.82 percent.
The composite multi-indicator read published for the Tuesday session is 40 percent sell, unchanged from the prior session's snapshot of 40 percent sell, with signal strength described as average and direction as weakening. The snapshot history reads 48 percent buy a week ago and 40 percent buy a month ago. The short-horizon group averages 60 percent sell, the medium-horizon group 25 percent sell and the long-horizon group hold, and the composite trend indicator reads sell.
2.6 Volatility and Expected Range
The published 14-day average true range stands at 529.65 points and the 14-day average daily range at 534.70 points; the 9-day average true range is 563.45 with a 9-day average daily range of 580.75, and the 20-day average true range is 517.29 with a 20-day average daily range of 501.44. Monday's 757.50 point range was 1.42 times the 14-day average daily range.
Adding and subtracting the 14-day average true range of 529.65 points from the 29,722.50 settle frames Tuesday between 29,192.85 and 30,252.15. The published standard-deviation bands are built from five settlements: one deviation spans 29,194.05 to 30,250.95, two spans 28,975.16 to 30,469.84 and three spans 28,807.19 to 30,637.81. These bands describe settlement dispersion, not intraday reach, and the Tuesday and Wednesday earnings releases can open the market outside any of them.
3. Key Levels
3.1 Resistance
Above the 29,722.50 settle, the 29,868.16 conversion of the largest gamma concentration and primary call side ceiling at NDX 29,675 and the 29,943.15 momentum projection level come first, followed by the 29,971.16 conversion of the modeled gamma-flip level at NDX 29,778 and Monday's 29,983.50 high. The 38.2 percent retracement from the 13-week high at 30,037.12 and Pivot R1 at 30,062.00 come next, then the 38.2 percent retracement from the four-week low at 30,139.17, the 40-day average crossing price at 30,229.50 and one standard deviation resistance at 30,250.95. The 9-day average crossing price at 30,401.06 and Pivot R2 at 30,401.50 form the extended band, with the 50 percent retracement of the four-week range at 30,421.25 beyond.
3.2 Support
Beneath the settle sits the 29,704.10 momentum projection level, then the 29,693.16 conversion of the modeled volatility threshold at NDX 29,500 and the Pivot Point at 29,644.00. The 50 percent retracement of the 13-week range at 29,549.25 and the published target price at 29,475.81 follow, then the 40-day average stall level at 29,394.75, Friday's 29,391.50 settle and Pivot S1 at 29,304.50. Monday's 29,226.00 low, which is also the one-month low, one standard deviation support at 29,194.05 and the 38.2 percent retracement from the 13-week low at 29,061.38 form the deeper band, with Pivot S2 at 28,886.50 the extended reference.
4. Macro Drivers
4.1 Mag7 Earnings and AI Capex Cycle
The news feed's market wrap, "Chip Stocks Rebound as AI Optimism Lifts Nasdaq Ahead of Earnings", and provider commentary both described Monday's gain as led by chipmakers and artificial-intelligence infrastructure stocks after last week's selloff, with earnings optimism ahead of reports from a social-media group, an electric-vehicle maker and a streaming company. The desk note said the largest technology shares rose about 2 percent and attributed bullish single-stock options flow to them ahead of earnings.
The feed carried at 3:24 PM ET a report that an artificial-intelligence cloud provider and an artificial-intelligence model developer are in talks on a 45 billion dollar cloud computing deal, at 1:31 PM ET and 3:51 PM ET items on the leading graphics-chip maker's investments in Germany, and at 12:02 PM ET to 12:05 PM ET press reports that a Chinese artificial-intelligence developer and a Chinese telecommunications equipment maker are working on chips. A streaming company reports at 4:01 PM ET on Tuesday, October 20, 2026, as the calendar lists it, and a social-media group, an electric-vehicle maker, an information-technology group and an analog chip maker report after the close on Wednesday, October 21, 2026, as the calendar lists them. The desk note cited an options-implied move of 8 percent for the streaming company.
4.2 Semiconductor Cycle and Tech Sector Rotation
The semiconductor index closed at 11,316.34, up 1.61 percent from Friday's 11,137.29, after trading between 11,293.45 and 11,550.92, so it settled near the low of its range. The desk note said the semiconductor fund rose about 2 percent and the Nasdaq-100 fund about 1 percent. The Nasdaq-100 cash index outperformed the S&P 500 cash index, 1.17 percent against 0.41 percent, while the Dow industrials slipped 0.07 percent.
4.3 Fed Policy and Real Yields (Duration Sensitivity)
The ten-year yield index closed at 5.14 percent against 5.09 percent on Friday, and the thirty-year index at 5.47 percent against 5.43 percent; provider commentary tied the rise in inflation expectations to higher crude. The homebuilder sentiment index printed 29 at 10:00 AM ET against a 31 forecast, per the news-feed calendar. The next policy statement is scheduled for 2:00 PM ET on October 28, 2026, as the calendar lists it. No inflation-protected yield series was captured, so real yields are not measured here.
4.4 Geopolitical Backdrop
The news feed carried Gulf headlines through the day, including Iranian statements on asserting control over the Strait of Hormuz, Houthi claims of attacks on Saudi energy sites, and at 2:22 PM ET an Iranian naval claim of a US attack that a US official described as inaccurate at 2:29 PM ET, via press reports. A press report carried at 6:38 AM ET said a de-escalation step between Washington and Tehran is expected this week, and the President described a good situation with respect to Iran at 3:19 PM ET. These are statements carried by the news feed rather than confirmed events.
4.5 Cross-Asset and Volatility
The Nasdaq-100 volatility index closed at 25.56 against 27.13 on Friday, and the volatility index at 18.44 against 19.99. The desk note said the volatility index fell 8 percent and the volatility-of-volatility index 3 percent to 107. The dollar index closed at 101.98, up 0.14, and November WTI crude settled at 103.66, up 2.22 percent.
4.6 Institutional Positioning
No weekly positioning report was captured. Open interest on the December contract stood at 280,923 for Friday, on the 2026-10-16 row of the provider's settlement record, and Monday's open interest had not been reported at the time of capture; Monday's volume was 618,989 contracts against 817,879 on Friday, the 2026-10-16 row, revised from the 797,480 carried in Monday's outlook. The measured closing basis was 193.16 points, the December settlement of 29,722.50 less the 29,529.34 cash close from the same provider's daily record, against 203.95 on Friday.
5. QQQ Options Flow Context (Proxy)
This review uses the QQQ fund as the proxy for the positioning data available, alongside the index levels published in the same desk note. The desk note read for this section is the 5:21 PM ET edition for Monday, read at 6:18 PM ET. Its reference prices are the prior session's closes, not Monday's: NDX 29,187 matches Friday's 29,187.55 cash close and QQQ 709 matches the console's 709.93 previous-close field. Every index level below is read against Monday's 29,529.34 cash close.
On the Nasdaq-100 index the modeled volatility threshold sits at NDX 29,500, the largest gamma concentration and the primary call side ceiling both at NDX 29,675, the modeled gamma-flip level at NDX 29,778 and the primary put side support base at NDX 28,000. The cash close sits 29.34 points above the threshold, 145.66 points beneath the concentration and 248.66 points beneath the flip level. Gamma tilt reads 0.679 and gamma notional minus 10.133 million dollars, both model outputs. The note's key index strikes are 29,675, 29,000, 30,000 and 28,000.
On the QQQ proxy the primary call side ceiling sits at 760, the largest gamma concentration and the primary put side support base both at 700, and the modeled gamma-flip level and modeled volatility threshold both at 730. The fund's gamma tilt reads 0.483 and gamma notional minus 1.165 billion dollars, proxy model outputs. The QQQ console, read at 6:20 PM ET with a Date of 2026-10-19, shows a current-price field of 718.83, a change of plus 1.25 percent, call gamma of minus 1.25 billion against put gamma of minus 2.58 billion, one-month implied volatility of 22.55 percent against realised volatility of 18.55 percent, an implied-volatility rank of 52.43 percent and a put-to-call open-interest ratio of 1.39.
At the measured closing basis of 193.16 points the modeled volatility threshold at NDX 29,500 corresponds to 29,693.16 on the December contract, the concentration and call side ceiling at NDX 29,675 to 29,868.16 and the modeled gamma-flip level at NDX 29,778 to 29,971.16. These conversions are this review's, not the source's. Monday's 29,983.50 high printed 12.34 points above the 29,971.16 conversion of the flip level.
The desk note characterised index options flow as bearish and single-stock flow as bullish and concentrated in the largest technology names ahead of earnings; those characterisations are the note's, and the console reports volume and modeled gamma without trade side, so no directional read is drawn from them here. The volatility index options expiration at 9:30 AM ET on Wednesday is listed by the desk note, unconfirmed. In this review's interpretation, drawn from the index model and the QQQ fund proxy, both model outputs, a cash close beneath the flip level with negative gamma notional on both the index and the fund describes positioning that is less likely to dampen moves, a damping read with no direction, which matters ahead of three days of large earnings releases.
6. Forecast
6.1 Night Session (6:00 PM ET Monday to 3:00 AM ET Tuesday, Globex and Asia)
Globex reopened at 6:00 PM ET on Monday. The President is listed to speak at 7:00 PM ET and China's loan prime rates at 9:00 PM ET, both per the news-feed calendar and unconfirmed. A move above Monday's 29,983.50 high opens Pivot R1 at 30,062.00, while a move beneath the Pivot Point at 29,644.00 opens the 29,549.25 retracement. Bias neutral beneath the 29,971.16 flip conversion, expected Globex band roughly 29,550 to 29,950.
6.2 London Session (3:00 AM to 8:00 AM ET Tuesday)
The UK labour report and German producer prices are listed at 2:00 AM ET and the German sentiment survey at 5:00 AM ET, all per the news-feed calendar and unconfirmed. Bias neutral to lower, expected band roughly 29,500 to 29,990, with the 29,940 to 30,000 band the first meaningful resistance and the Pivot Point at 29,644.00 the first meaningful support.
6.3 Morning Session (9:30 AM to 12:00 PM ET Tuesday, RTH Open)
Housing starts and building permits print at 8:30 AM ET on Tuesday, October 20, 2026, as the calendar lists them, and pending home sales are listed at 10:00 AM ET, per the news-feed calendar and unconfirmed, around the cash open at 9:30 AM ET. Expected band roughly 29,400 to 30,100, with Pivot R1 at 30,062.00 above and the 29,475.81 target price beneath.
6.4 Afternoon Session (12:00 PM to 4:00 PM ET Tuesday)
Equity index futures settle at 4:00 PM ET, and a streaming company reports at 4:01 PM ET on Tuesday, October 20, 2026, as the calendar lists it, so the earnings reaction belongs to the evening session. Expected band roughly 29,350 to 30,150.
6.5 Night Session Forward (6:00 PM ET Tuesday)
Globex reopens at 6:00 PM ET on Tuesday with the streaming company's result in hand, and a social-media group and an electric-vehicle maker report after the close on Wednesday, October 21, 2026, as the calendar lists them.
6.6 Expected Range (Tuesday Full Session)
Low-range scenario: 29,500 to 29,990; Mid-range scenario (most likely): 29,350 to 30,150; High-range scenario: 29,190 to 30,400.
6.7 Most Likely Path
In this review's analyst judgment the most probable path holds the contract between Pivot S1 at 29,304.50 and Pivot R1 at 30,062.00, with a rally toward the 29,940 to 30,000 band that fails beneath Pivot R1 at 30,062.00 weighted above a sustained recovery. The settle sits beneath the 5-day, 9-day, 20-day, 50-day and 100-day settlement averages, negative direction leads on both directional systems, the composite holds at 40 percent sell, and Monday's high stalled 12.34 points above the conversion of the modeled gamma-flip level before the contract settled 248.66 points beneath it.
The alternative that would invalidate this reading is a continuation of Monday's chip-led rebound into the earnings releases, carrying the contract through Pivot R1 at 30,062.00 toward the 40-day crossing price at 30,229.50. Monday's 331.00 point gain ended five consecutive lower settles and the settle sits 1,405.61 points above the 200-day average, which keeps that alternative live.
7. Tuesday Economic Calendar
Monday's releases are complete. Canadian consumer prices printed at 8:30 AM ET on Monday, per the news-feed calendar, at 3.1 percent year over year against a 3.2 percent forecast, and the homebuilder sentiment index printed at 10:00 AM ET on Monday, per the news-feed calendar, at 29 against a 31 forecast. Equity index futures settled at 4:00 PM ET.
On Monday evening the President is listed to speak at 7:00 PM ET and China's loan prime rates at 9:00 PM ET, both per the news-feed calendar and unconfirmed. On Tuesday the UK labour report and German producer prices are listed at 2:00 AM ET and the German sentiment survey at 5:00 AM ET, all per the news-feed calendar and unconfirmed. Housing starts and building permits print at 8:30 AM ET on Tuesday, October 20, 2026, as the calendar lists them, with forecasts of 1.3 million and 1.385 million on the news-feed calendar. The cash open is at 9:30 AM ET. Pending home sales are listed at 10:00 AM ET on Tuesday, per the news-feed calendar and unconfirmed. Equity index futures settle at 4:00 PM ET. A streaming company reports at 4:01 PM ET on Tuesday, October 20, 2026, as the calendar lists it, and a space-launch company's quarterly report is listed at 4:15 PM ET on Tuesday, per the news-feed calendar and unconfirmed.
Later in the week, a social-media group, an electric-vehicle maker, an information-technology group and an analog chip maker report after the close on Wednesday, October 21, 2026, as the calendar lists them, and the next policy statement is scheduled for 2:00 PM ET on October 28, 2026, as the calendar lists it. In this review's judgment the first-order event for the Nasdaq-100 is the streaming company at 4:01 PM ET on Tuesday, October 20, 2026, as the calendar lists it, the first of three days of large earnings releases.
8. Primary Trade Setup
Direction: Short
Rationale: The settle sits beneath the 5-day, 9-day, 20-day, 50-day and 100-day settlement averages, negative direction leads on the 9-day and 14-day directional systems, the composite holds at 40 percent sell, and the cash close sits beneath the modeled gamma-flip level at NDX 29,778 with negative gamma notional on the index model and the QQQ fund proxy (model outputs, read as a damping lens with no direction); a rally into the 29,971.16 conversion of the flip level, where Monday's high stalled, offers a short with a defined risk point above Pivot R1 at 30,062.00. Monday's 331.00 point gain ended five lower settles and three days of earnings releases lie ahead, so the setup is an analyst judgment that rallies stall beneath the flip conversion, not a measured edge.
Entry Zone: 29,940 to 30,000
Stop Loss: 30,100 (above Pivot R1 at 30,062.00 and the 38.2 percent retracement at 30,037.12)
Target 1 (T1): 29,840 (28.16 beneath the 29,868.16 conversion of the concentration)
Target 2 (T2): 29,710 (12.50 beneath Monday's 29,722.50 settle)
Target 3 (T3, extended): 29,580 (30.75 above the 50 percent retracement at 29,549.25)
Risk-to-Reward: Approximately 1:1 to T1, 1:2 to T2, 1:3 to T3
Invalidation: A settle above Pivot R1 at 30,062.00 negates the thesis. Short of that, the edge is removed by acceptance above the entry band and not by a touch, defined as two consecutive 30-minute closes above 30,000.
Macro override: A continuation of the chip-led rebound, a confirmed de-escalation in the Gulf that pulls crude and yields lower, or a strong reaction to the streaming company's report in the evening session would support a further rally. In that scenario a move through the 30,100 stop removes the setup, and the 38.2 percent retracement at 30,139.17 and the 40-day crossing price at 30,229.50 become the references within one 14-day average true range of 529.65 points.
Sources and methodology
This outlook is built from our session review of the December E-mini Nasdaq-100 contract, the December ’26 contract, prepared after Monday's close on October 19, 2026 for the Tuesday, October 20, 2026 session. Monday's open, high, low and settle come from the provider's daily settlement record for the December contract, the 2026-10-19 row, and match the chart's completed daily bar. Monday's completed extremes are also the inputs behind the published pivot ladder: Pivot R3 at 30,819.50 less Pivot S3 at 28,547.00, divided by three, and Pivot R2 at 30,401.50 less Pivot S2 at 28,886.50, divided by two, both return 757.50, and three times the 29,644.00 Pivot Point less the settle gives 59,209.50, which the pair of 29,983.50 and 29,226.00 reproduces exactly. The chart's 30-minute bars for the session, from the 6:00 PM ET Sunday bar through the 4:30 PM ET Monday bar, reproduce the same extremes; they place the low in the 6:00 PM ET Sunday bar and the high in the 11:30 AM ET bar, and every timed statement about Monday in this article rests on them. Only those figures and the review's statements are used to grade Monday's card. Monday's session opened at the Sunday 6:00 PM ET reopen. Globex reopened at 6:00 PM ET Monday, so the open, high and low on the provider's overview belong to the Tuesday session and are not Monday's range.
The moving averages were computed from the provider's 259-session daily settlement series for the December contract, with the partial Tuesday row dropped; the oscillators are cited as published, read at 6:26 PM ET after the reopen. Volume and open interest come from the provider's daily record: the 2026-10-19 row reads 618,989 contracts with open interest not yet reported, and the 2026-10-16 row now reads 817,879 contracts and open interest of 280,923, where Monday's outlook carried 797,480 for Friday and no open interest. The 2026-10-15 row reads open interest of 274,603. The desk note used is the 5:21 PM ET Monday edition, read at 6:18 PM ET, with Friday's closes in its reference column; every Nasdaq futures equivalent is the review's conversion at the 193.16 point measured basis, the December settlement less the cash close from the same provider's daily record, and Friday's 203.95 basis is the figure carried in Monday's outlook. The QQQ fund is a proxy read alongside the index levels. The reading that positioning is less likely to dampen moves is the review's interpretation from the index model and that proxy, both model outputs, and it is a damping read with no direction; the fund console, dated 2026-10-19, was read at 6:20 PM ET. The 52-week high's distance is shown as the provider's overview gives it, 5.99 percent, beside the 6.37 percent computed from the two prices. The dollar index percentage, the volatility index change, the open-interest change, the size of the 09/21 gain and the cash-close distances to the 28,000, 29,000 and 30,000 strikes are computed. Scenario ranges are analyst judgment, and items marked unconfirmed come from the news-feed calendar or the desk note.
Monday’s outlook for this contract is here, and the S&P 500 contract’s Monday outlook covers the index that rose 0.41 percent in cash on Monday. Outlooks for ES, NQ, GC and CL are collected on the market outlook page, and our forward trading record is on the performance statement.