
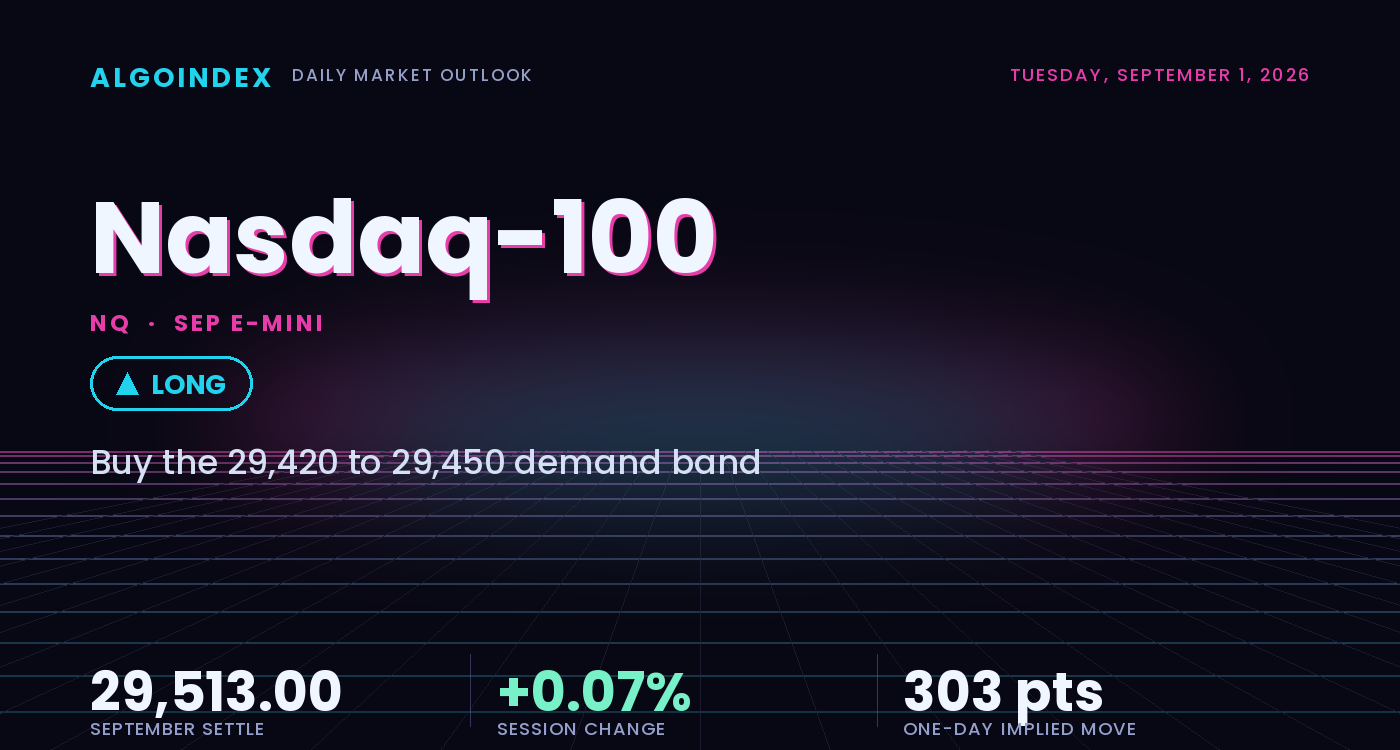
The September Nasdaq-100 settled Monday at 29,513.00, up 21.25 points or 0.07 percent, on 456,650 contracts. The headline understates the work the session required. Price opened the Sunday reopen at 29,540.00, a 48.25-point gap above Friday’s 29,491.75 close, then traded 266.50 points down to 29,273.50 before recovering 239.50 points into the settle, closing at 87.81 percent of the range in the upper eighth of the day. The low undercut Friday’s 29,436.25 low by 162.75 points before being reclaimed in full, a failed downside break that is the single most constructive fact on the chart. It is also the only one that survived intact. Advancing versus declining issues finished at negative 647 and net volume at negative 772.4 million shares, so the index closed green on a session in which decliners and down-volume both dominated, the Nasdaq-100 cash index up 0.08 percent to 29,456.97 while the Dow fell 0.70 percent and the S&P 500 fell 0.33 percent.
The green print was carried by a very small number of very large names. Of roughly 2.8 billion dollars of net delta bought across large-cap equities on the day, about 2.6 billion came from a single mega-cap automaker whose longer-dated call buying pushed it through two dealer hedging thresholds ahead of a Thursday product launch. Strip that one position out and the day’s institutional demand is close to nothing. The macro backdrop turned harder over the weekend. United States and Iran military exchanges lifted West Texas Intermediate crude 2.83 percent to an 85.76 dollar settle, and the 10-year Treasury yield pushed to 4.771 percent, its highest since January 2025, which matters more for this long-duration index than for any other benchmark. A central-bank chair arguing that inflation is the problem and rate increases the fix, against a 3.7 percent headline inflation print, leaves the contract compressed between its 20-day average above and its 50-day average below, and the setup that follows is a tactical long into the 29,413 to 29,444 support confluence rather than a directional position.
A failed downside break inside a compression band
The structural read starts with location. At 29,513.00 the contract sits above its 5-day average at 29,453.35, its 50-day at 29,413.04, its 100-day at 29,132.05 and its 200-day at 27,360.17, and below only its 20-day at 29,630.18. Monday settled 117.18 points beneath that 20-day and 99.96 points above the 50-day, so the entire session took place inside a 217.14-point compression band bounded by those two averages, and neither boundary was resolved. The single most informative fact of the day is that the 29,273.50 low absorbed a 266.50-point decline, undercut Friday’s low by 162.75 points, and then produced a 239.50-point reversal that closed the contract 27.00 points below its own open and only 33.25 points below the session high. A closing-range position of 87.81 percent on a day whose low broke the prior session low is the signature of a stop-run followed by genuine demand rather than of a drift-back rally.
Momentum is neutral to the point of being uninformative, which is itself the finding. The 14-day relative-strength reading is 51.25, essentially at the midline, with the 9-day at 51.51 and the 20-day at 51.12, so no timeframe is oversold or overbought. The stochastics are mixed, the 14-day raw at 40.56 percent below the 9-day raw at 65.48 percent and the 50-day and 100-day materially higher at 61.37 and 73.32 percent. Trend strength is where the picture becomes decisive: the directional index reads 14.74 on the 14-day window and 13.25 on the 20-day, both far beneath the twenty threshold, with the negative directional indicator above the positive on every period measured. That is a market with no trend and a persistent mild downward lean inside the absence, the environment in which range strategies outperform and break-out strategies bleed.
The 29,600 to 29,630 ceiling frames Tuesday
Two structures frame the session. Overhead, the band from 29,601.61 to 29,630.18 stacks the 23.6 percent retracement of the July-to-August advance, the first computed resistance at 29,615.00 and the 20-day moving average inside thirty points, the most consequential resistance on the board. Acceptance above it restores the short-term uptrend; rejection keeps the contract range-bound. Above sits the 29,750 to 29,800 traded-volume node, which carries 34 percent of recent intraday volume and is capped by Friday’s 29,811.50 high, the strongest confluence in the review. Beneath price, the 29,413 to 29,444 shelf pairs the 50-day average with the computed pivot, and a break there opens 29,342, then the 29,273.50 reversal low, then 29,171.50. Tuesday turns on the 10:00 AM ET release block, and within it the manufacturing prices-paid sub-index at a 70.5 consensus, the number that connects Monday’s crude move to the rate path that sets this index’s discount rate.
Buy the pullback, cap it at the ceiling, size it down
The plan buys a pullback into the 29,420 to 29,450 support confluence, where the 50-day average at 29,413.04 meets the computed pivot at 29,444.25, taken only on a hold of the zone rather than on first touch, leaning on a failed downside break that reversed 239.50 points to close at 87.81 percent of the range while holding above the 50-day. The stop is 29,325, beneath the 50 percent retracement of the four-week range at 29,328.25 and the first computed support at 29,342.25, about 110 points from the 29,435 entry midpoint. Targets run to 29,546 at Monday’s session high, then 29,615 at the first computed resistance and lower edge of the 29,600 to 29,630 ceiling band, then 29,717 at the second computed resistance only on acceptance above the 20-day average with expanding volume and improving participation, for approximately 1 to 1.0, 1 to 1.6 and 1 to 2.6. The first target is close to a one-to-one and does not on its own justify the trade; the case rests on reaching the second, and the first should be treated as a partial. Size stays at half. Two items override the technical structure. A manufacturing prices-paid print materially above the 70.5 consensus would confirm the crude impulse is reaching input costs, push the 10-year beyond its 4.771 percent high and hit this index hardest through duration, so stand aside on that outcome regardless of where price sits; a fresh Strait of Hormuz supply disruption carries the same effect. In the opposite direction, a soft job-openings print alongside benign prices paid argues for holding through the second target toward the third. The alternate is a short of a failed test of the 29,600 to 29,630 band, entry 29,600 to 29,625 on rejection with breadth still negative, stop 29,660, targets 29,546, 29,444 and 29,342, the higher-probability side if the morning data runs hot and the one that aligns with the dealer and commercial net short positioning. Our published record lays out how we grade these calls.
A failed downside break that undercut Friday’s low by 162.75 points and reversed 239.50 to close at 87.81 percent of the range, the contract compressed between the 20-day average above and the 50-day below with no trend on any lookback. The 29,600 to 29,630 ceiling is the referee: a held pullback into the 29,420 to 29,450 shelf works toward it, while a sustained loss of 29,273.50 negates everything constructive about Monday.
A failed downside break inside a compression band is a pullback to buy at the 50-day shelf, not a level to chase. The edge is a held retest of 29,420 to 29,450, and the invalidation is sustained trade beneath 29,273.50.
This is the read our members get every session, before the bell, with the levels drawn and the setup defined. See how the same dealer-positioning work turns into systematic signals.
View pricingThe complete data picture
Every number behind Tuesday’s plan, charted first; the full numeric reference follows underneath.
Full numeric reference, every remaining figure from the review
| Average | Value | Settle vs |
|---|---|---|
| 5-day | 29,453.35 | settle above by 59.65, 0.20 percent |
| 20-day | 29,630.18 | settle below by 117.18, 0.40 percent, the level that defines the structure |
| 50-day | 29,413.04 | settle above by 99.96, 0.34 percent, the lower compression boundary |
| 100-day | 29,132.05 | settle above by 380.95, 1.31 percent |
| 200-day | 27,360.17 | settle above by 2,152.83, 7.87 percent |
| Year-to-date | 27,638.87 | settle above by 1,874.13, 6.78 percent |
| Level | Reference |
|---|---|
| 31,100.00 | 52-week and 13-week high, set June 3 |
| 30,343.00 | one-month high (NDX 30,287), set August 17, 830.00 points above the settle |
| 30,063.75 | upper momentum projection, the level a sustained multi-session advance would need to reach |
| 29,887.75 | third computed resistance (NDX 29,832), near the three-standard-deviation projection at 29,815.27 |
| 29,811.50 | prior-week high (NDX 29,756), Friday’s high, 298.50 points above the settle |
| 29,750.00 to 29,800.00 | heaviest traded-volume node (NDX 29,694 to 29,744), 34 percent of recent intraday volume, capped by Friday’s high |
| 29,717.00 | second computed resistance (NDX 29,661), the one-standard-deviation resistance projection at 29,687.52 just beneath, target three |
| 29,630.18 | 20-day moving average (NDX 29,574), the most consequential single level, with the 23.6 percent retracement at 29,601.61 just below |
| 29,615.00 | first computed resistance (NDX 29,559), the lower edge of the ceiling band and target two |
| 29,546.25 | session high (NDX 29,490), the first mechanical hurdle and target one, 33.25 points above the settle |
| 29,513.00 | September settle, cash close 29,456.97, the reference point for the session |
| 29,453.35 | 5-day moving average (NDX 29,397), 59.65 points beneath the settle |
| 29,444.25 | computed pivot (NDX 29,388), the session equilibrium and top of the entry confluence, 14-day momentum midline at 29,433.75 just beneath |
| 29,413.04 | 50-day moving average (NDX 29,357), the lower compression boundary and base of the entry confluence |
| 29,342.25 | first computed support (NDX 29,286), effectively coincident with the one-standard-deviation support at 29,338.48 |
| 29,328.25 | 50 percent retracement of the four-week range (NDX 29,272), the shelf above the stop |
| 29,273.50 | session low (NDX 29,217), the pivot of the near-term thesis, two-standard-deviation support at 29,266.20 seven points beneath |
| 29,171.50 | second computed support (NDX 29,115), the first reference below the reversal low |
| 29,142.95 | 38.2 percent retracement of the July-to-August advance (NDX 29,087), a sustained break puts the recovery in question |
| 29,132.05 | 100-day moving average, 380.95 points beneath the settle |
| 29,069.50 | third computed support (NDX 29,013), the outer edge of a statistically normal downside session |
| 29,017.00 | last week swing low (NDX 28,961), 496.00 points beneath the settle |
| Metric | Reading |
|---|---|
| September options surface | 17 days to the September 17 expiry, implied volatility 16.32 percent, a 20 dollar point value |
| Implied one-day move | about 303 points, 80 percent of the 9-day average daily range, 78 percent of the 14-day average daily range and 63 percent of the 14-day average true range |
| Implied against realized | 16.32 percent implied sits 5.33 volatility points above the 10.99 percent 9-day realized and 3.51 above the 12.81 percent 14-day realized, but 0.45 beneath the 16.77 percent 20-day realized, rich to the last two weeks and near parity with the month |
| Fund-proxy conversion ratio | about 41.2, measured from the 29,513.00 settle against the 716.76 proxy close, a same-day conversion convenience rather than a fixed basis |
| Proxy fund options | put open interest exceeds call at a 1.26 ratio, 30-day implied volatility of 16.75 percent sits 1.38 points beneath 30-day realized of 18.13 percent, with an implied volatility ranking of 12.58 percent and a skew ranking of 72.33 percent |
| Dealer gamma (proxy) | call gamma negative 684.92 million and put gamma negative 2.12 billion for a net near negative 2.80 billion, so hedging flows amplify direction rather than damp it, and the largest stabilising bucket expired at Monday’s close |
| Cohort | Weekly change |
|---|---|
| Non-commercial | net long 10,039 contracts overall going into the weekend |
| Leveraged funds | cut shorts by 14,188 to 93,073 and added 6,351 longs to 51,841, covering into the August advance |
| Asset managers | added 3,614 longs to reach 109,400 against 36,184 shorts, a 73,216 net long |
| Dealers and intermediaries | raised shorts by 25,041 to 122,503 and cut longs by 3,165 to 59,255, a 63,248 net short |
| Commercials | raised shorts by 22,886 to 193,184 against 156,048 longs, a 37,136 net short |
| Survey date | August 25, before the weekend macro shift, so it describes the position going in; open interest 295,279 |
| Input | |
|---|---|
| Federal Reserve policy | the central-bank chair used the symposium to argue inflation is the problem and rate increases the instrument, against a 3.7 percent headline yearly inflation print, and market pricing now carries a higher probability of a September increase |
| Mega-cap flow | roughly 2.8 billion dollars of net delta was bought across large-cap equities, about 93 percent from a single electric-vehicle manufacturer whose longer-dated call demand pushed it through two dealer hedging thresholds ahead of a Thursday product launch |
| Semiconductor and cloud | the two largest public-cloud operators announced a multi-cloud interconnect, while an antitrust action was reported as imminent against the largest e-commerce operator and the largest index constituent moved to expedite a trade-secret action |
| Sector rotation | rotation ran hard from technology toward energy, oil-services and refining names up between 1.2 and 4.9 percent while airlines fell 2.3 to 2.4 percent and homebuilders 1.9 to 2.8 percent on the yield move |
| AI capex financing | an artificial-intelligence infrastructure developer closed about three billion dollars of data-centre financing, up to 1.85 billion in investment-grade facilities, evidence the buildout is funded by conventional credit |
| Geopolitical | the United States and Iran exchanged military strikes for the first time in about a month, lifting crude 2.83 percent to an 85.76 dollar settle, with afternoon presidential remarks on the Strait of Hormuz on balance de-escalatory |
| Cross-asset | the 10-year yield rose to 4.771 percent, the highest since January 2025, while the dollar index fell 0.26 percent to 99.413, an inflation-premium pattern, and the volatility gauge closed 14.93 with advance-decline negative 647 on negative 772.4 million net volume |
| Institutional positioning | a 38,000-lot bearish risk reversal in the proxy fund bought December downside against short upside calls, insuring the index from near current levels while surrendering gains beyond about three percent |
| When | Event |
|---|---|
| Mon Aug 31 | the reviewed session, a 21.25-point gain masking negative breadth, with the Asian manufacturing surveys overnight headlined by the Chinese print at 9:45 PM ET, 51.0 consensus against a 50.9 prior |
| Tue Sep 1 | the 10:00 AM ET release block, the manufacturing index at 55.2 against 55.6 prior, job openings at 7.313 million against 7.359 million, and the prices-paid sub-index at 70.5 against 71.1, the single first-order number |
| Wed Sep 2 | private payrolls at 8:15 AM ET, 47,000 against a 44,000 prior, a Bank of Canada decision expected to hold at 2.25 percent, factory orders and crude inventories |
| Thu Sep 3 | the trade balance and initial claims at 8:30 AM ET, claims forecast at 205,000, and the services survey at 10:00 AM ET with its own prices-paid component near 70.0 |
| Fri Sep 4 | the monthly employment report at 8:30 AM ET, 55,000 nonfarm payrolls forecast against a negative 23,000 prior with unemployment held at 4.1 percent, the largest single uncertainty of the week |
The economic releases referenced above are published on the official government calendars below. Price levels are derived from standard technical and statistical methods, and the market read is AlgoIndex's own analysis. How we grade these calls is set out in our performance methodology.
- US Bureau of Economic Analysis, Personal Income and Outlays (PCE)
- US Bureau of Economic Analysis, Gross Domestic Product
- US Bureau of Economic Analysis, release schedule
- US Census Bureau, Advance Durable Goods (M3) release schedule
- US Energy Information Administration, Weekly Petroleum Status Report
- US Department of the Treasury, auction schedule and results
- AlgoIndex performance methodology



