
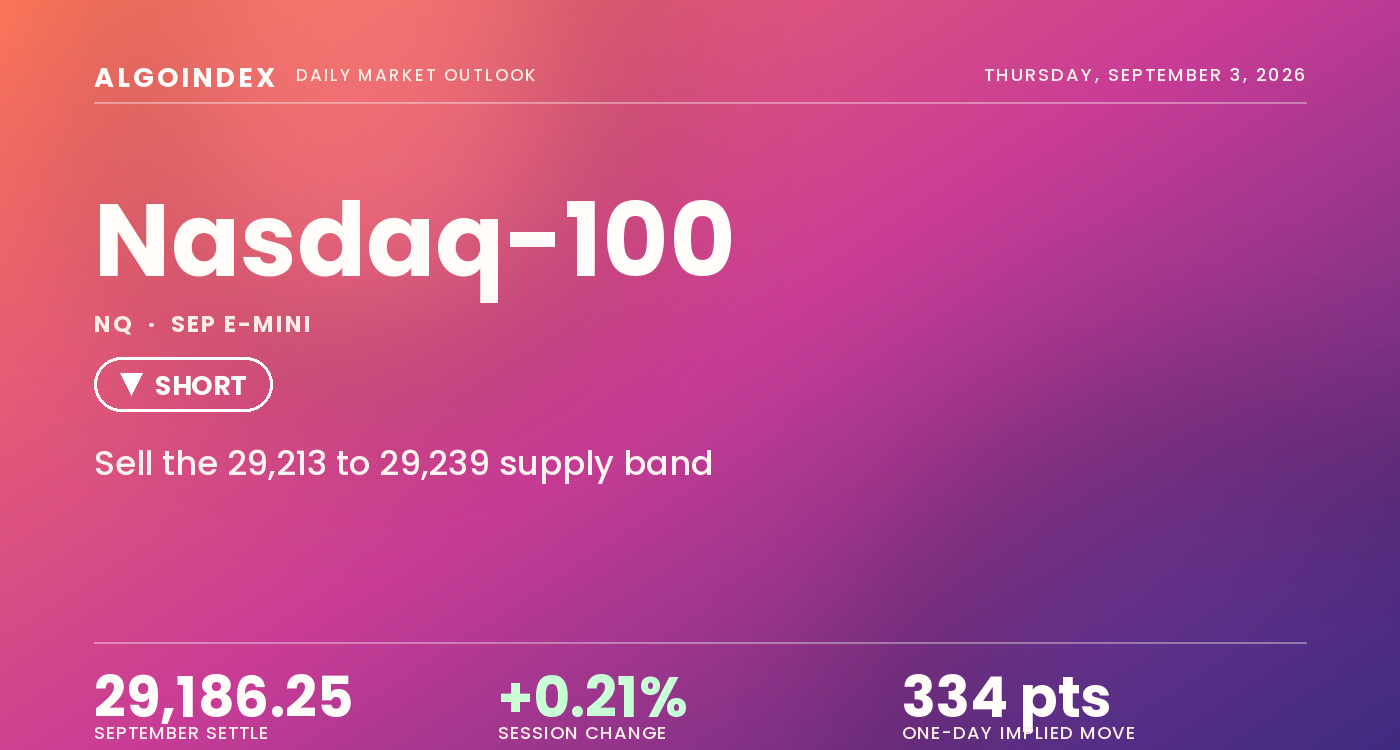
The September Nasdaq-100 settled Wednesday at 29,186.25, up 60.75 points or 0.21 percent, after a session that opened at 29,136.50, broke to 28,927.25 and finished within 26.75 points of its high in the upper decile of the day’s range. The recovery shape stands in direct contrast to Tuesday’s 387.50-point decline. The Nasdaq-100 cash index closed at 29,143.33, up 0.23 percent, trailing a 0.46 percent broad-market gain and a 0.56 percent advance in the large-cap industrials. Technology led on the way down Tuesday and lagged on the way back Wednesday, the single most important relative-strength observation into Thursday. The session’s driver was stabilisation in Treasury yields: the 10-year finished little changed near 4.79 percent after a weaker-than-expected August private-payrolls survey trimmed the odds of a September policy tightening, with a senior Federal Reserve official describing inflation as continuing to trend lower. July factory orders exceeded expectations, leaving the day’s data mixed rather than uniformly supportive.
The structural contradiction into Thursday is sharp. Price now sits beneath the 5-day, 20-day, 50-day and 100-day moving averages while holding well above the 200-day, and the multi-indicator composite reads 16 percent sell with minimum strength and a weakening direction. Against that, momentum oscillators are deeply washed out, with the 14-day raw stochastic at 15.70 percent, implied volatility sits near the low end of its three-month range, and index-level dealer positioning in the Nasdaq-100 options complex is close to neutral in notional terms while the broad-market and proxy equivalents remain meaningfully negative. Gamma notional at the index level reads positive 1.31 million dollars against negative 216.692 million for the broad market and negative 671.515 million for the tracking proxy, so dealer hedging in the index itself is not currently a strong amplifier of downside movement. A market that is technically damaged, positionally light and cheaply hedged into a heavy data run can travel in either direction quickly, and the setup that follows sells a failed retest of the 29,213 to 29,239 confluence rather than chasing weakness lower.
A broken average stack on a neutral-gamma index
The structural read starts with location, and it is decisively weak. At 29,186.25 the contract sits beneath its 5-day average at 29,293.20, its 20-day at 29,554.90, its 50-day at 29,365.59 and its 100-day at 29,239.02, holding only the 200-day at 27,411.63 some 1,774.62 points below. Price is beneath four of five averages, and the failure to hold the 50-day is the meaningful break that separates this contract from a market still trading above its own. The most instructive feature of the session was a rejection: Wednesday’s high at 29,213.00 matched the overnight high to the tick and turned away twice in under twelve hours, with the 100-day average at 29,239.02 sitting just 26 points overhead. That pairing of a rejected swing high and a major average forms the tightest overhead barrier on the board, and it is the level the short is worked from.
Momentum is soft without being extreme, which is itself the finding. Relative strength reads 42.73 on the 9-day window, 46.09 on the 14-day, 47.79 on the 20-day and 51.13 on the 50-day, neutral-to-soft rather than oversold. Raw stochastics tell a more stretched story, the 9-day at 25.13 percent and both the 14-day and 20-day at 15.70 percent, readings in the mid-teens consistent with a downside move that has extended far enough to invite mean reversion and aligned with Wednesday’s recovery shape. Trend strength is absent by the conventional measure, the directional index reading 21.15 on the 9-day, 15.95 on the 14-day and 13.82 on the 20-day, with the negative directional indicator exceeding the positive on every window, so direction is down but the move lacks the persistence of a durable trend. The multi-indicator composite reads 16 percent sell overall with strength at minimum and direction weakening, yet the composite trend signal and three separate moving-average crossover studies read buy, an internal disagreement that is genuine rather than cosmetic.
The 29,005 to 29,046 confluence decides Thursday
Two structures frame the session. Beneath the market, the band from 29,005 to 29,046 pairs the first pivot support and a mapped combination strike at cash 28,961 with the dealer gamma flip equivalent and the computed target price at 29,029, four independent references inside a 41-point span and the most defensible support on the board. Below 29,046 dealer hedging tends to amplify rather than dampen movement, the single most important mechanical distinction on the downside. Overhead, the swing structure is capped by the 29,213 to 29,239 band and then by the second gate at 29,290 to 29,293, where the first pivot resistance and the 5-day average sit 2.78 points apart. The first line that matters on any pullback is 29,133, the volatility inflection equivalent and overnight low, which coincide within 0.17 points on the 42.92-point basis, with the pivot at 29,109 just beneath it. Thursday turns on the institute services survey at 10:00 AM ET, whose employment component feeds directly into Friday’s payroll expectations.
Sell the failed retest, cover at the confluence, size it down
The plan sells a failed retest of the 29,213 to 29,239 band, immediately beneath the 100-day average at 29,239.02 and above the pivot at 29,109, leaning on a settle beneath four of five moving averages, a 16 percent sell composite and a negative directional index on every measured window. The stop is 29,296, above the first pivot resistance at 29,290.42 and the 5-day average at 29,293.20, roughly 70 points from the 29,226 entry midpoint. Targets run to 29,133 at the volatility inflection equivalent and overnight low, then 29,046 at the dealer gamma flip equivalent where hedging shifts from dampening to amplifying, then 29,005 at the first pivot support and mapped combination strike, for approximately 1 to 1.3, 1 to 2.6 and 1 to 3.2. The extended third target is worked only if momentum carries through the second on expanding volume, and the dense 29,005 to 29,046 confluence should attract responsive buying on first contact. Two items override the technical structure. An upside surprise in the institute services survey at 10:00 AM ET, particularly an employment component printing above 50 against the 48.7 consensus, would reprice payroll expectations and likely carry the index through the 29,290 to 29,293 gate regardless of structure. In the opposite direction, escalatory export-control headlines following Wednesday’s late-afternoon commentary would accelerate the downside case and argue for holding a runner beyond the third target. Size stays reduced given the 8:30 AM ET claims block, the 10:00 AM ET survey, two Federal Reserve speakers into the close and Friday’s payroll release. An alternate presents on acceptance above 29,239 confirmed by a sustained hold above 29,213 on a pullback, stop 29,168, targeting 29,290 first and 29,318 second. Our published record lays out how we grade these calls.
A settle beneath four of five moving averages with the session high rejected twice at the 100-day average, yet index-level dealer gamma close to neutral rather than amplifying. The 29,005 to 29,046 confluence is the referee: a failed retest of the 29,213 to 29,239 band works toward it, while sustained acceptance above 29,296 neutralises everything bearish about Wednesday’s recovery.
A damaged average stack with washed-out momentum is a failed retest to sell beneath the 100-day, not weakness to chase. The edge is a rejection of 29,213 to 29,239, and the invalidation is sustained acceptance above 29,296.
This is the read our members get every session, before the bell, with the levels drawn and the setup defined. See how the same dealer-positioning work turns into systematic signals.
View pricingThe complete data picture
Every number behind Thursday’s plan, charted first; the full numeric reference follows underneath.
Full numeric reference, every remaining figure from the review
| Average | Value | Settle vs |
|---|---|---|
| 5-day | 29,293.20 | settle below by 106.95, 0.37 percent |
| 20-day | 29,554.90 | settle below by 368.65, 1.26 percent, the widest gap in the stack |
| 50-day | 29,365.59 | settle below by 179.34, 0.61 percent, the intermediate-trend break |
| 100-day | 29,239.02 | settle below by 52.77, 0.18 percent, the nearest reclaim objective and top of the sell band |
| 200-day | 27,411.63 | settle above by 1,774.62, 6.08 percent, the only average still held |
| Year-to-date | 27,665.60 | settle above by 1,520.65, 5.21 percent |
| Level | Reference |
|---|---|
| 31,100.00 | 52-week high, a structural rather than tactical reference |
| 30,343.00 | one-month high, set August 17, the origin of the current lower-high sequence |
| 29,811.50 | prior-week high, set August 28, the top of the five-day window |
| 29,695.75 | Thursday August 27 close, the last major up-bar before the decline |
| 29,576.00 | third pivot resistance, cash 29,533 |
| 29,571.25 | current-week high to date, the level that would establish a higher high |
| 29,554.90 | 20-day moving average, 368.65 points above the settle, cash 29,512 |
| 29,543.00 | next mapped upside gamma reference at the round index level, cash 29,500 |
| 29,539.05 | 30-minute extension objective |
| 29,395.00 | second pivot resistance, the top of the high-range scenario, cash 29,352 |
| 29,365.59 | 50-day moving average, the first intermediate-trend reference to reclaim, cash 29,323 |
| 29,318.00 | primary gamma concentration strike, the upper bound of a mean-reversion advance, cash 29,275 |
| 29,293.20 | 5-day moving average |
| 29,290.42 | first pivot resistance, the second overhead gate with the 5-day, cash 29,247 |
| 29,265.35 | 30-minute extension objective |
| 29,239.02 | 100-day moving average, the nearest reclaim objective 52.77 points above the settle and top of the 29,213 to 29,239 sell band, cash 29,196 |
| 29,233.15 | 30-minute extension objective inside the decision zone |
| 29,213.00 | session high and overnight high, the twice-rejected ceiling, cash 29,170 |
| 29,186.25 | September settle, the reference point for the session |
| 29,133.00 | volatility inflection equivalent and overnight low, target one, cash 29,090 |
| 29,109.00 | computed pivot from Wednesday’s high, low and settle, cash 29,066 |
| 29,046.00 | dealer gamma flip equivalent, target two, where hedging shifts from dampening to amplifying, cash 29,003 |
| 29,029.00 | computed target price from the pivot study, cash 28,986 |
| 29,005.00 | first pivot support and mapped combination strike, target three, the base of the dense 29,005 to 29,046 confluence, cash 28,962 |
| 28,946.75 | prior-week low |
| 28,927.25 | session low and week low to date, the level that invalidates the recovery formation, cash 28,884 |
| 28,831.75 | one-month low, just above the second pivot support, cash 28,789 |
| 28,800.00 | lowest mapped combination strike, with meaningful open interest behind it, cash 28,757 |
| 28,719.00 | third pivot support, the deepest single-session reference, cash 28,676 |
| 28,070.93 | 61.8 percent retracement of the 52-week range, relevant only on a sustained breakdown |
| 27,411.63 | 200-day moving average, 1,774.62 points beneath the settle, the only average still held |
| Metric | Reading |
|---|---|
| Index options surface | implied volatility rank 22.15 percent with a 27.90 percent volatility-forecast rank and a 28.17 percent skew rank, all three in the lower third of their ranges, and one-month implied volatility of 18.15 percent about 5 points above one-month realized of 13.15 percent |
| Implied one-day move | about 334 points, 1.15 percent on the tracking proxy, roughly 5 percent inside the 352.64-point 9-day average daily range and 25 percent inside the 444.27-point 14-day average true range |
| Dealer gamma, index | gamma tilt 1.029 and notional positive 1.31 million dollars, essentially flat, against a broad-market notional of negative 216.692 million and a proxy notional of negative 671.515 million, so index dealer hedging is not a strong downside amplifier |
| Dealer gamma, proxy | call gamma negative 462.74 million against put gamma negative 2.58 billion, put-side gamma 5.58 times the call side, a materially more negative surface than the index itself |
| Options volume skew | proxy puts 1.496 million against calls 1.048 million, with put open interest 7.058 million against call open interest 5.237 million for a 1.35 ratio and a published put-call open-interest ratio of 1.33 |
| Index gamma references | volatility inflection 29,090, dealer gamma flip 29,003, primary gamma concentration 29,275 and downside concentration 28,000, with combination strikes at 29,281, 28,961, 28,757 and 28,350 |
| Expiry and basis | top gamma expiry September 18, 2026, the quarterly expiration and the September futures expiration sixteen days out, with the futures at a 42.92-point premium to the cash index on the measured basis |
| Cohort | Weekly change |
|---|---|
| Dealers and intermediaries | 59,255 long against 122,503 short as of August 25, with the short side increased by 25,041 contracts |
| Commercial participants | 156,048 long against 193,184 short, with shorts up 22,886 |
| Leveraged funds | 51,841 long against 93,073 short, having cut shorts by 14,188 |
| Asset managers | 109,400 long against 36,184 short, having added 3,614 to the long side |
| Open interest and alpha | open interest 294,945 contracts, weighted alpha positive 17.58 and relative strength 46.09 |
| Index options open interest | call open interest 86,947 against put open interest 106,218 for a 1.22 ratio, with call volume 14,352 against put volume 12,564 |
| Input | |
|---|---|
| Federal Reserve policy | tightening-biased following the central-banking symposium, with a governor noting summer inflation came in better than expected while cautioning underlying trends had not improved, against July core consumer prices up 0.2 percent month-over-month and a 3.7 percent personal consumption expenditures print versus a 3.6 percent consensus; three Federal Reserve speakers follow Thursday |
| Wednesday data | the August private-payrolls survey came in below expectations and trimmed tightening odds, remarks from the New York Federal Reserve president describing inflation as continuing to trend lower accelerated the advance, and July factory orders exceeded expectations |
| Rates and dollar | the 10-year Treasury yield finished little changed near 4.79 percent and the dollar fell 0.4 percent in August, a second consecutive monthly decline, the primary transmission channel for a long-duration index |
| Single-stock leadership | an enterprise hardware and infrastructure name gained 16 percent to close at 492 with the largest single-stock hedging flow in thirty days, while the dominant AI accelerator designer added roughly 1.4 billion dollars of directional delta and closed 3 percent higher at 224, aggregate single-stock hedging flow finishing near positive 2 billion dollars |
| Rotation | a database software name fell 13.54 percent while a developer-tools name gained 9.98 percent, a dispersion pattern that held the index gain to 0.23 percent against a 0.46 percent broad-market advance |
| Export controls | the Commerce Secretary stated at 4:47 PM ET that relaxing technology export controls for China is not necessary, after a 4:30 PM ET note of unanimous G20 agreement on technology principles, commentary that landed after the cash close and is the most likely source of a gap at Thursday’s open |
| Geopolitical | United States and Iran hostilities pushed crude to a six-week high before afternoon remarks that the campaign would not continue much longer and that oil prices should decline, with crude quoted at 91.34 dollars, up 0.23 percent |
| Cross-asset and volatility | the volatility index closed 15.19, down 7 percent, and the volatility-of-volatility measure 86.25, down 6 percent, both a round trip to Monday’s levels, with gold at 4,410.31, up 0.44 percent, and fixed-strike volatilities lower across the board |
| When | Event |
|---|---|
| Wed Sep 2 | the reviewed session, a 0.21 percent recovery close after a break to 28,927.25, the first up-close since the decline began and a stabilisation in Treasury yields near 4.79 percent |
| Thu Sep 3 | the outlook session, weekly jobless claims and the trade balance at 8:30 AM ET, the institute services survey at 10:00 AM ET with employment forecast at 48.7 against 47.4, and two Federal Reserve speakers at 3:00 and 3:55 PM ET |
| Fri Sep 4 | the August payroll report at 8:30 AM ET, 55 thousand forecast against a negative 23 thousand prior with the unemployment rate held at 4.1 percent, the largest single uncertainty ahead |
| Beyond | a holiday-shortened week from September 7, consumer prices on September 11, a technology summit on September 8 and a device launch on September 9 |
| Sep 16 to 18 | the policy decision with updated projections on September 16 and quarterly expiration on September 18, which is also the September futures expiration and the top gamma expiry for this index |
The economic releases referenced above are published on the official government calendars below. Price levels are derived from standard technical and statistical methods, and the market read is AlgoIndex's own analysis. How we grade these calls is set out in our performance methodology.
- US Bureau of Economic Analysis, Personal Income and Outlays (PCE)
- US Bureau of Economic Analysis, Gross Domestic Product
- US Bureau of Economic Analysis, release schedule
- US Census Bureau, Advance Durable Goods (M3) release schedule
- US Energy Information Administration, Weekly Petroleum Status Report
- US Department of the Treasury, auction schedule and results
- AlgoIndex performance methodology



