
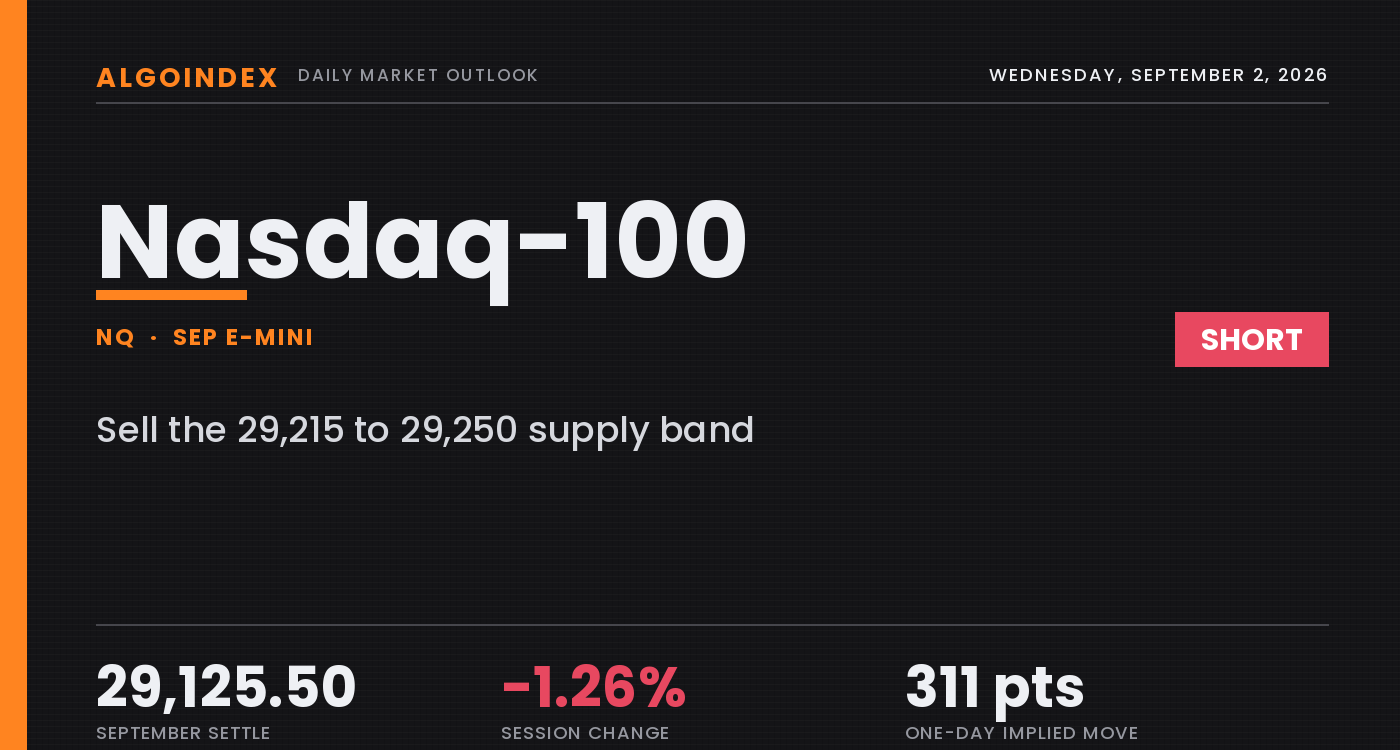
The September Nasdaq-100 settled Tuesday at 29,125.50 on the first session of September, a technology-led decline that ran well ahead of the broad market. The exchange-traded index proxy closed at 707.85, down 1.26 percent from a prior 716.86, while a broad-market proxy fell only 0.69 percent, so technology underperformed by 57 basis points in a single session. This was not a broad de-risking but a targeted unwind of the most crowded, highest-multiple part of the market. The sector detail is severe: software fell 4 percent at the sector-proxy level, memory names 3 percent and semiconductors 2 percent, three to six times the size of the headline index move. The proximate cause was external, an escalating military exchange between the United States and Iran that lifted crude sharply, pushed the 10-year yield to 4.802 percent and firmed the dollar to 99.747. Long-duration technology equity is the most rate-sensitive asset in the index complex, and a rates-led shock hits it hardest.
The structural contradiction runs the opposite way here from the broad market. Where the S&P surface remains net long gamma and therefore self-damping, the Nasdaq proxy surface is net short gamma, with call gamma at negative 417.59 million and put gamma at negative 2.43 billion, an arrangement that amplifies directional moves rather than absorbing them. The contract also sits beneath its 5-day, 20-day, 50-day and 100-day moving averages, holding only the 200-day, a materially weaker technical position than the S&P contract, which still holds its 50-day. Policy expectations have turned hawkish, with commentary from the Jackson Hole symposium read as signalling unfinished work on inflation and one investment-bank note observing that a December rate increase is now fully priced against a 3.7 percent headline personal consumption expenditures print. An energy-driven inflation impulse arriving on top of already-hawkish pricing is the specific hazard for an index whose earnings are weighted toward long-duration cash flows, and the setup that follows sells a rally into the computed pivot rather than chasing weakness lower.
A broken average stack on a short-gamma surface
The structural read starts with location, and it is decisively weak. At 29,125.50 the contract sits beneath its 5-day average at 29,379.75, its 20-day at 29,566.16, its 50-day at 29,370.62 and its 100-day at 29,204.14, holding only the 200-day at 27,393.20 some 1,732.30 points below. Price is beneath four of five averages, and the failure to hold the 50-day is the meaningful break that distinguishes this contract from the broad market, which still trades above its own 50-day. The most instructive mechanical event of the session was a rejection: the cash index turned away from the 29,600 primary put side support base and the 29,500 primary gamma concentration strike and failed to reclaim either. On a short-gamma surface a failed reclaim of a major concentration strike removes the strongest candidate for stabilising flow, and the underperformance that followed was the direct consequence.
Momentum is soft without being extreme, which is itself the finding. Relative strength reads 40.62 on the 9-day window, 44.93 on the 14-day, 47.06 on the 20-day and 50.88 on the 50-day, marginally weaker than the broad market across every window. Raw stochastics are compressed at 14.57 percent on the 9-day and 9.02 percent on both the 14-day and 20-day, with the smoothed 14-day at 20.79 percent, the divergence between mid-forties relative strength and single-digit raw stochastics marking a market at the bottom of its recent range rather than one in freefall. Trend strength is absent by the conventional measure, the directional index reading 19.74 on the 9-day, 15.36 on the 14-day and 13.54 on the 20-day, all beneath twenty, with the negative directional indicator at 24.76 above the positive at 14.68 on the 9-day, a 10.08 spread wider than the broad market. The multi-indicator composite reads 16 percent sell overall against a 16 percent buy for the broad market, and that sign difference between two highly correlated products is the cleanest summary of relative weakness available.
The 29,002 to 29,013 shelf decides Wednesday
Two structures frame the session. Beneath the market, the band from 29,002.00 to 29,013.11 pairs Tuesday’s session low with the three-by-ten day moving-average crossover stall and the computed target price at 29,002.53, three references inside eleven points and the most important near-term support on the board. Holding it keeps the contract inside its recent base; losing it opens a considerably emptier area toward the computed first support at 28,894.58 and the one standard deviation support at 28,856.68. Overhead, the swing structure is capped by the computed pivot at 29,232.92 and then by the 29,360.72 nine-day moving-average crossing and the 29,370.62 fifty-day, ten points apart and forming the most important reclaim band on the chart. The gap between the 29,170.00 overnight high and the 29,232.92 pivot is the first genuine test of whether sellers remain in control, and Wednesday turns on the 8:15 AM ET employment change survey, the only scheduled release that speaks to the rate path now driving this index.
Sell the rally, cover at the shelf, size it down
The plan sells a rally into the 29,215 to 29,250 band immediately beneath the computed pivot at 29,232.92 and above the 100-day average at 29,204.14, leaning on a settle beneath four of five moving averages, a 16 percent sell composite and a net short-gamma surface that amplifies rather than absorbs downside continuation. The stop is 29,398, above the one standard deviation resistance at 29,394.32 and above the 29,360.72 to 29,370.62 nine-day and fifty-day band, roughly 165 points from the 29,232.50 entry midpoint. Targets run to 29,045 at the overnight session low, then 29,002 at Tuesday’s session low reinforced by the computed target price at 29,002.53 and the crossover stall at 29,013.11, then 28,857 at the one standard deviation support just beneath the computed first support at 28,894.58, for approximately 1 to 1.1, 1 to 1.4 and 1 to 2.3. The extended third target is worked only if momentum carries through the second on expanding volume, and given the short-gamma configuration any break beneath the 29,002 shelf is likely to extend faster than the average daily range would suggest. Two items override the technical structure. A credible de-escalation headline out of the Gulf would collapse the crude premium, relieve the rates channel and produce a disproportionate rally in long-duration technology, since this index absorbed the discount-rate cost without any energy offset. In the opposite direction, a confirming energy inventory draw at 10:30 AM ET alongside further escalation would accelerate the decline, and the short-gamma configuration argues for holding through the second target rather than covering early. Size stays at half given the 8:15 AM ET employment survey, the 10:30 AM ET inventory report, the unresolved reaction to three after-close earnings reports and Friday’s payroll release. A reclaim of 29,232.92 that holds for a full hour without rejection weakens the read before the stop is reached and is grounds for reducing. Our published record lays out how we grade these calls.
A settle beneath four of five moving averages on a net short-gamma surface, with the cash index rejected at both the 29,600 support base and the 29,500 concentration strike. The 29,002 to 29,013 shelf is the referee: a rejection of the 29,215 to 29,250 sell band works toward it, while sustained acceptance above 29,398 neutralises everything bearish about Tuesday.
A broken average stack on a short-gamma surface is a rally to sell beneath the pivot, not weakness to chase. The edge is a rejection of 29,215 to 29,250, and the invalidation is sustained acceptance above 29,398.
This is the read our members get every session, before the bell, with the levels drawn and the setup defined. See how the same dealer-positioning work turns into systematic signals.
View pricingThe complete data picture
Every number behind Wednesday’s plan, charted first; the full numeric reference follows underneath.
Full numeric reference, every remaining figure from the review
| Average | Value | Settle vs |
|---|---|---|
| 5-day | 29,379.75 | settle below by 254.25, 0.87 percent |
| 20-day | 29,566.16 | settle below by 440.66, 1.51 percent, the widest gap in the stack |
| 50-day | 29,370.62 | settle below by 245.12, 0.84 percent, the meaningful structural break |
| 100-day | 29,204.14 | settle below by 78.64, 0.27 percent, the nearest reclaim objective |
| 200-day | 27,393.20 | settle above by 1,732.30, 6.32 percent, the only average still held |
| Year-to-date | 27,656.15 | settle above by 1,469.35, 5.31 percent |
| Level | Reference |
|---|---|
| 31,100.00 | 52-week and 13-week high, set June 3, a structural rather than tactical reference |
| 30,343.00 | one-month high, set August 17 |
| 30,033.08 | third computed resistance |
| 29,811.50 | prior-week high, set August 28, the top of the five-day window |
| 29,802.17 | second computed resistance |
| 29,610.77 | 38.2 percent retracement from the thirteen-week high |
| 29,591.10 | three standard deviation resistance |
| 29,583.97 | eighteen-day moving average crossing |
| 29,567.73 | 38.2 percent retracement from the four-week high |
| 29,566.16 | 20-day moving average, settle below by 440.66 points |
| 29,505.66 | two standard deviation resistance |
| 29,468.50 | forty-day moving average stall |
| 29,463.83 | first computed resistance |
| 29,411.73 | the level where the fourteen-day relative strength reaches 50 |
| 29,394.32 | one standard deviation resistance, the base of the stop zone |
| 29,379.75 | 5-day moving average, settle below by 254.25 points |
| 29,370.62 | 50-day moving average, ten points from the nine-day crossing and the top of the reclaim band |
| 29,360.72 | nine-day moving average crossing, the lower edge of the reclaim band |
| 29,328.25 | 50 percent retracement of the four-week range |
| 29,300.50 | nine-day moving average stall |
| 29,277.52 | forty-day moving average crossing |
| 29,232.92 | computed pivot, the first genuine decision level and top of the 29,215 to 29,250 sell confluence |
| 29,204.14 | 100-day moving average, the nearest reclaim objective 78.64 points above the settle |
| 29,170.00 | overnight high, the first overhead reference above the late-evening price |
| 29,125.50 | September settle, the reference point for the session |
| 29,088.77 | 38.2 percent retracement from the four-week low |
| 29,044.50 | overnight low, target one |
| 29,013.11 | three-by-ten day moving average crossover stall, the top of the decisive shelf |
| 29,002.53 | computed target price, inside the decisive shelf |
| 29,002.00 | session low, target two, the level that decides Wednesday’s character |
| 28,894.58 | first computed support, the first reference beneath the shelf |
| 28,856.68 | one standard deviation support, target three, thirty-eight points beneath the first support |
| 28,745.34 | two standard deviation support |
| 28,070.93 | 61.8 percent retracement of the 52-week range, relevant only on a sustained breakdown |
| 27,393.20 | 200-day moving average, 1,732.30 points beneath the settle, the only average still held |
| Metric | Reading |
|---|---|
| September options surface | implied volatility rank 12.33 percent, one-month implied volatility 16.71 percent sitting beneath one-month realized of 17.20 percent, priced below recent realized outcomes |
| Implied one-day move | about 311 points, 1.068 percent on the proxy, 50 points inside the 361.36-point 9-day average daily range and 65 inside the 376.50-point 14-day average daily range |
| Dealer gamma | call gamma negative 417.59 million and put gamma negative 2.43 billion, a net short-gamma surface, with the cash-index gamma tilt 1.303 and notional positive 11.582 million dollars against a fund tilt of 0.857 and notional negative 117.205 million dollars |
| Options volume skew | fund puts 991.07 thousand against 737.12 thousand calls for a 1.35 ratio and a 1.31 put-call open interest ratio, with cash puts 11.604 thousand against 6.83 thousand calls for a 1.70 ratio and a 25-delta risk reversal of negative 0.045 on the cash index and negative 0.034 on the fund |
| Aggregate hedging flow | negative 5 billion dollars of delta on the day from call selling and put buying, which monetises upside rather than purely hedging downside and caps rally potential mechanically |
| Rank and skew | implied volatility rank 12.33 percent and skew rank 57.37 percent, a higher absolute volatility rank than the broad market yet materially less downside skew premium |
| Expiry and basis | top gamma expiry September 18, 2026, which is monthly expiration, and top delta expiry June 17, 2027, with the futures trading at an approximate 88-point premium to the cash index on the evening reading |
| Cohort | Weekly change |
|---|---|
| Aggregate hedging flow | negative 5 billion dollars of delta on the day, driven by a combination of call selling and put buying |
| Dealer gamma | call gamma negative 417.59 million and put gamma negative 2.43 billion, a net short-gamma surface that amplifies direction |
| Cash-index gamma | tilt 1.303 with gamma notional positive 11.582 million dollars |
| Fund gamma | tilt 0.857 with gamma notional negative 117.205 million dollars |
| Options volume skew | 991.07 thousand fund puts against 737.12 thousand calls for a 1.35 ratio, with the published put-call open-interest ratio at 1.31 |
| Volatility ranks | implied volatility rank 12.33 percent and skew rank 57.37 percent, both configured with less downside premium than the broad market |
| Input | |
|---|---|
| Federal Reserve policy | Jackson Hole commentary was read as signalling unfinished work on inflation, with one investment-bank note observing that a December rate increase is now fully priced, against a 3.7 percent headline personal consumption expenditures print versus a 3.6 percent forecast and an August 28 caution against mistaking summer data for underlying improvement |
| Rates and dollar | the 10-year yield rose to 4.802 percent and the dollar index firmed to 99.747, up 0.09 percent, the single most important transmission channel for a long-duration index |
| Large-cap leadership | software fell 4 percent at the sector-proxy level, memory 3 percent and semiconductors 2 percent against a 1.26 percent index-proxy decline, so the index was cushioned by its smaller and more defensive constituents |
| After-close earnings | a large hardware vendor rose 8.5 percent in line with its implied move, a security software name traded flat inside its move, and a database name fell 13 percent in line, wide dispersion within priced expectations |
| Geopolitical | an escalating military exchange between the United States and Iran developed through the New York afternoon, with a 3:19 PM ET statement asserting the Strait of Hormuz would tighten, felt by this index through the rates and dollar channel rather than directly |
| Cross-asset | Brent settled 94.65 dollars, up 4.6 percent, with the domestic front contract above 90 dollars and energy equities up 1.27 percent, while gold fell with the December contract at 4,396.4 and the proxy down 2.86 percent as rising real yields overwhelmed the haven bid |
| Volatility and breadth | the broad-market volatility index closed 16.33, up 9.38 percent, its best close in a month, with the volatility-of-volatility measure up 5 points to 91; the NYSE advance-decline closed negative 1,028, the volume-weighted measure near negative 1.21 billion shares and the short-term trading index 0.750 |
| Institutional positioning | the best-performing flagged options position was an approximately 10,000-lot November 530 strike semiconductor put that gained 19 percent, a direct expression of the same sector weakness |
| When | Event |
|---|---|
| Tue Sep 1 | the reviewed session, a technology-led decline with the index proxy down 1.26 percent, driven by a United States and Iran military exchange that lifted crude and pushed the 10-year yield to 4.802 percent |
| Wed Sep 2 | the employment change survey at 8:15 AM ET, 45 thousand against a 44 thousand prior, a Bank of Canada decision expected to hold at 2.25 percent, factory orders at 10:00 AM ET and the weekly energy inventory report at 10:30 AM ET |
| Thu Sep 3 | the services survey, the next first-order read into Friday’s payroll after Wednesday’s employment change print |
| Fri Sep 4 | the monthly payroll report, 58 thousand forecast against a negative 23 thousand prior with the unemployment rate held at 4.1 percent, the largest single uncertainty of the week |
| Beyond | consumer price data on September 11 and the policy meeting with updated projections on September 16, with monthly expiration on September 18 coinciding with the top gamma expiry for this index |
The economic releases referenced above are published on the official government calendars below. Price levels are derived from standard technical and statistical methods, and the market read is AlgoIndex's own analysis. How we grade these calls is set out in our performance methodology.
- US Bureau of Economic Analysis, Personal Income and Outlays (PCE)
- US Bureau of Economic Analysis, Gross Domestic Product
- US Bureau of Economic Analysis, release schedule
- US Census Bureau, Advance Durable Goods (M3) release schedule
- US Energy Information Administration, Weekly Petroleum Status Report
- US Department of the Treasury, auction schedule and results
- AlgoIndex performance methodology



