
By the closing bell on Friday the Nasdaq-100 had done something subtly telling. It finished at 92 percent of its range, 33 points off the high, with sellers nowhere in sight.
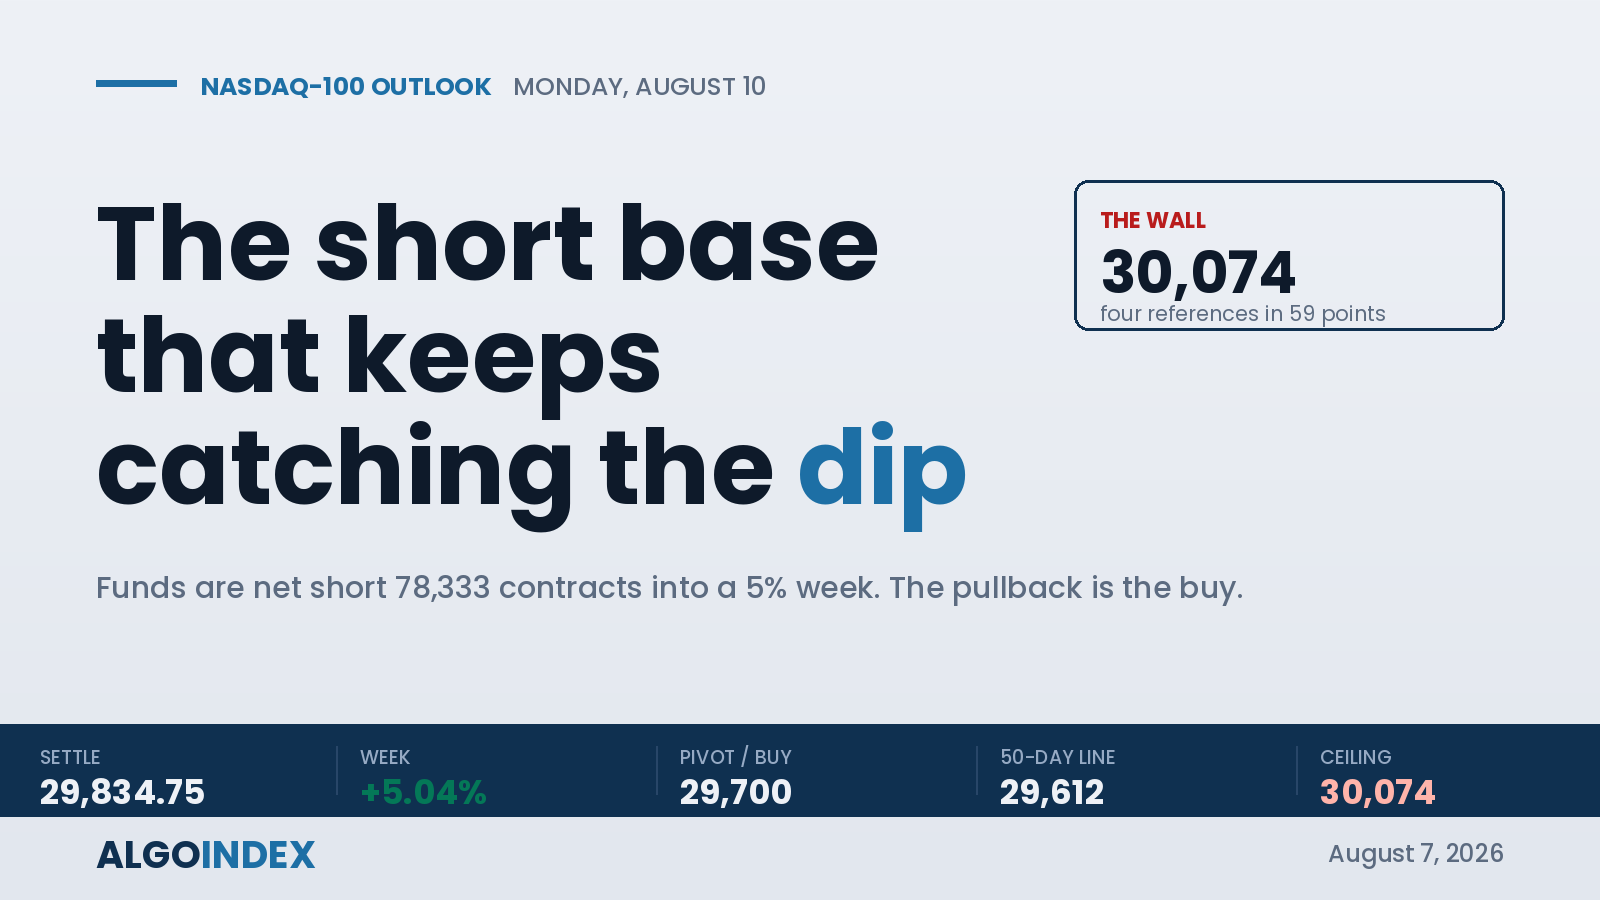
The September E-mini settled at 29,834.75, up 346 points, and it got there on a soft jobs report that pulled the odds of a September rate hike down to 44 percent from 58 percent. Long-duration growth is the most rate-sensitive corner of the market, which is exactly why the Nasdaq-100 beat the broad index by 57 basis points on the day. But the number that matters into Monday isn't the gain. It's that speculative funds are still net short 78,333 contracts and kept adding to that short into a week the index rose more than 5 percent. This recovery has a mechanical engine, and it hasn't run out of fuel.
A rate trade wearing a technology costume
Don't mistake this for broad risk appetite that happened to lift technology. The bid was concentrated in the cohort most sensitive to the front end of the yield curve, and it followed a week in which enterprise software delivered upside guidance, one vendor jumping more than 36 percent. The volatility surface tells the same story a different way: one-month implied on the Nasdaq proxy sits at 21.37 percent against realized of 25.71 percent, so options are priced below what the index has actually been delivering. At-the-money implied for Monday runs near 7 percent against 14 percent realized. The market is set up for a quiet session, and it may be underpricing it.
The averages have not caught up to the price
Price sits above all six major moving averages, which sounds like a clean uptrend until you check the order underneath. The 20-day at 28,946.32 is still below the 50-day at 29,612.06. Price has recovered faster than the averages can follow, so a bullish price-to-average read is layered on an average-to-average structure that hasn't repaired from July. Short-window stochastics are pinned in the mid-80s while relative strength reads a comfortable 56 on the 14-day. That gap is the fingerprint of a market climbing out of a drawdown, not extending a mature trend, and it usually resolves sideways rather than through a sharp reversal.
The line that matters on a pullback is 29,570 to 29,612, where the first computed support, the 38.2 percent retracement, and the 50-day average all converge. Hold there and the seven-session advance stays intact. Lose it on a closing basis and it doesn't.
The short base is the story
Here is what has made every dip so shallow. As fast money sold, the natural hedging community bought. Commercials covered 21,883 shorts and dealers covered 19,372 while adding longs, in the same week the index ran 5 percent. A large, recently-added short base held into a rally is the mechanical precondition for continued upside pressure, independent of the fundamentals. It also explains why we keep buying the pullback instead of the breakout. The favorable entry is the dip the pivot zone should attract, at 29,700 to 29,730, where the computed pivot, the 18-day crossing, and the translated 720 strike all land inside 26 points.
As fast money sold the recovery, the natural hedgers bought it, and that is why every dip so far has been shallow.
The ceiling that defines the week
Overhead, the 30,074 to 30,133 zone is the whole ballgame. It stacks the weekly high, the one-month high from July 10, the second computed resistance, and the translated call-side boundary where dealer hedging flips from supportive to resistive, four references inside 59 points. The index probed 30,074 this week and closed 239 points below it. Until that zone goes on a closing basis, this is a recovery, not a breakout. Skew ranking at the 97.63 percentile says the market is already paying up for upside that hasn't been delivered, which is why we run only a runner into that band and take the majority at 29,983. Our long thesis rests on the pivot holding, and you can see how we grade these calls in our performance methodology.
Seventy-eight thousand short contracts don't cover themselves quietly, and the pivot is where they get their chance.
This is the read our members get every session, before the bell, with the levels drawn and the setup defined. See how the same dealer-positioning work turns into systematic signals.
View pricingThe complete data picture
Every number behind Friday’s plan, charted first; the full numeric reference follows underneath.
Full numeric reference , every remaining figure from the review
| Average | Value | Spot vs |
|---|---|---|
| 5-day | 29,538.65 | +296.10 |
| 20-day | 28,946.32 | +888.43 (below 50-day) |
| 50-day | 29,612.06 | +222.69 (the pullback line) |
| 100-day | 28,298.08 | +1,536.67 |
| 200-day | 27,101.63 | +2,733.12 |
| YTD | 27,429.73 | +2,405.02 |
| Proxy level | Futures equiv |
|---|---|
| Call-side boundary 730 | about 30,116 |
| High-vol point 726 | about 29,952 |
| Vol inflection 715 | about 29,500 |
| Gamma flip 707 | about 29,171 |
| Primary concentration 700 | about 28,879 |
| Put-side boundary 660 | about 27,239 |
| Metric | Reading |
|---|---|
| One-month implied / realized | 21.37% / 25.71% |
| Implied-vol rank | 44.41% |
| Skew rank | 97.63% |
| Options-implied move | about 398 futures pts (1.33%) |
| Call gamma / put gamma | -704.65M / -1.45B |
| Put-to-call OI | 1.19 (put selling) |
| Real-time hedging delta | +2B index, +465M single-stock (30-day high) |
| ATM IV Monday | about 7% vs 14% realized |
| Cohort | Net |
|---|---|
| Leveraged funds | short 78,333 (+15,899 shorts) |
| Asset managers | long 64,359 |
| Commercials | long 15,442 (covered 21,883 shorts) |
| Dealers | long 8,749 (covered 19,372) |
| Non-commercials | short 14,639 |
| Broad-index spec net short | 319,577 (+32,299) |
| Input | |
|---|---|
| Nonfarm payrolls | -23,000 vs +80,000 |
| Avg hourly earnings | +0.1% m/m, 3.2% y/y |
| Unemployment | 4.1% from 4.2% |
| 10-year yield | 4.65%, -3 bps |
| Sept hike odds | 44% from 58% |
| Enterprise-software leader | +36% on guidance |
| When | Event |
|---|---|
| Sat 21:30 | China CPI 0.8% / PPI 3.9% |
| Sun 19:50 | Bank of Japan minutes |
| Mon 04:30 | Eurozone Sentix -0.5 |
| Tue 16:05 | AI server maker earnings (0.69 / 11.62B) |
| Wed 08:30 | US CPI 0.1% m/m, 3.4% y/y |
| Wed 16:05 | Networking major earnings (1.17 / 16.83B) |



