
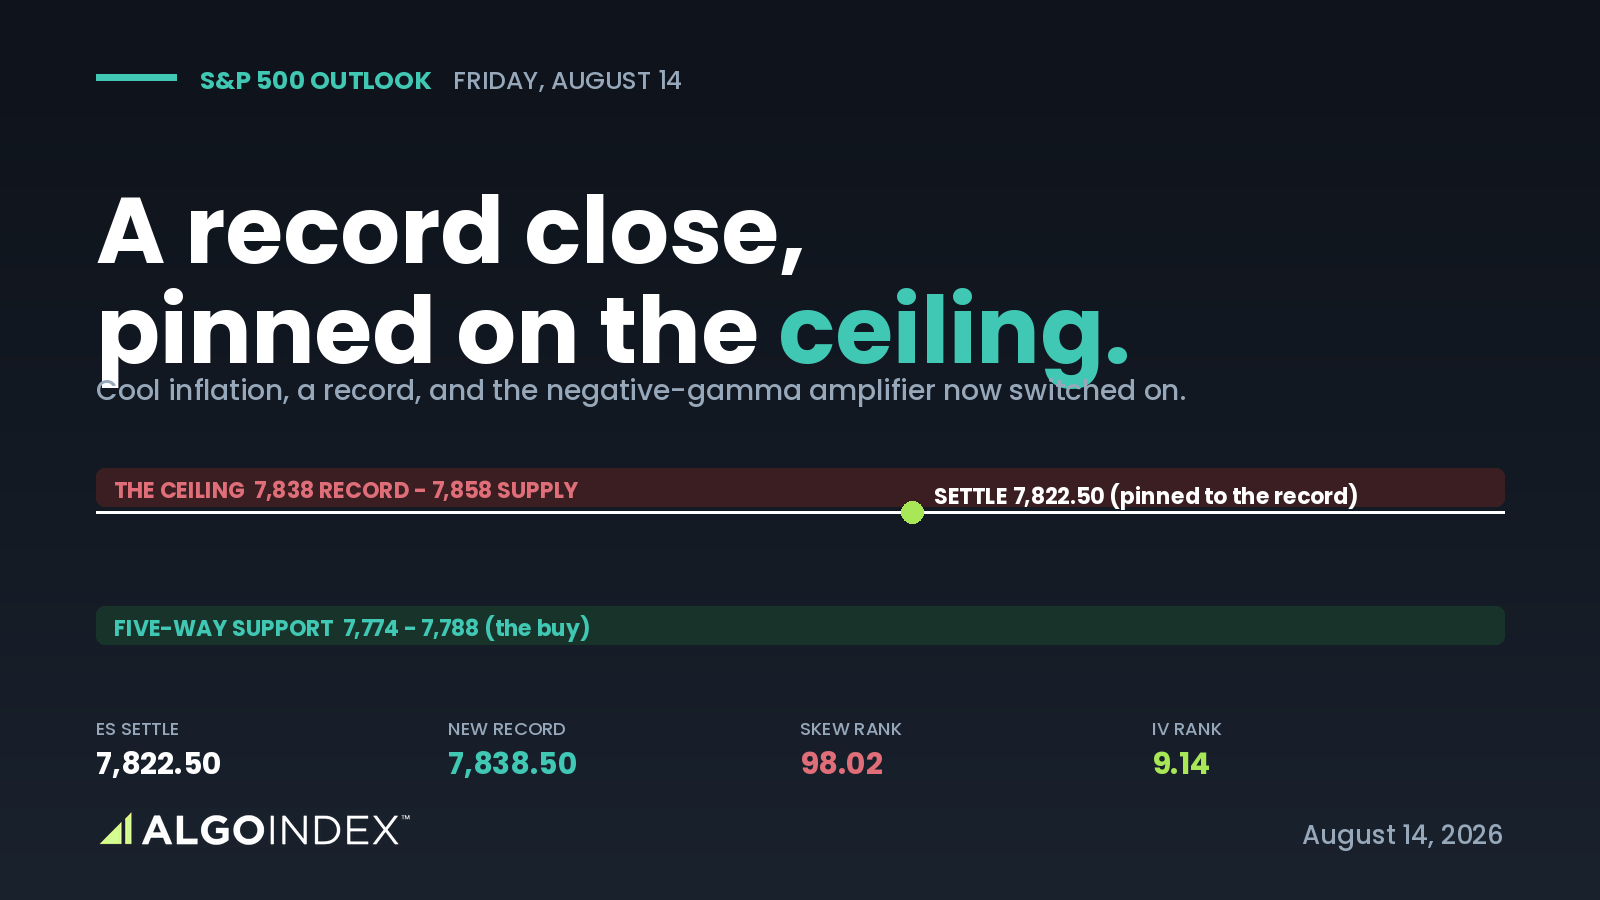
The July producer inflation report came in cooler than forecast on Thursday morning, and the index did the cleanest thing it has done in two weeks: it went up, and it stayed up. The September E-mini settled at 7,822.50, higher by 0.68 percent, after printing a fresh record at 7,838.50 during the cash session, and the S&P 500 itself closed at an all-time high. What makes Friday hard isn't the trend. The trend isn't in question at all. What makes it hard is where the market chose to close.
It closed pinned directly on its call-side dealer ceiling, at the 99th percentile of its 52-week range, with implied volatility near the cheapest reading of the year. And it did something else that matters more: the cool print pushed the market into negative dealer positioning, where hedging amplifies a move instead of absorbing it. That's the mechanism that manufactured the day's thrust, and it is now armed on the downside just as cleanly. Then, an hour after the close, two headlines out of the Strait of Hormuz crossed that weren't in the price at the settle. So the setup into Friday isn't a call on direction. It's whether a record close can hold the exact level where supply is heaviest, with the amplifier running and a geopolitical premium that hasn't been tested.
The rally that armed its own downside
For most of the summer, dealer positioning has been the market's shock absorber. In that state, when price rose the hedging flow sold into it and when price fell the flow bought, and the result was a slow grind that wore out both sides. Thursday broke that. The producer print pushed the market across the line into the negative zone, and the same flow that used to dampen the move started to extend it. The clearest evidence sat in a single option: the contract struck at the record-high level and expiring Friday went from about seven dollars to about thirty within the opening hour, a gain of more than three hundred percent, as dealers chased the move higher.
The problem is that the mechanism doesn't care about direction. In the negative zone a decline gets amplified with exactly the same efficiency the advance did. That's why a record close here isn't the all-clear it looks like. It's a market that has switched on its own volatility right at the level where the most supply sits, which is the configuration most likely to produce either a decisive break or a sharp rejection, with very little quiet in between.
A narrow advance, and a crack after the bell
The leadership was entirely a technology story and it came from offshore, where memory names rose more than five percent overnight and carried the semiconductor complex into the US session. That's what opened the full percentage-point gap between the Nasdaq 100 and the Dow. But the advance was narrower than the record prints suggest, and after the close the first real crack appeared: a large networking name fell roughly eight percent on disappointing guidance, even while projecting billions in artificial-intelligence revenue. When a stock can't hold a credible multi-year growth story, the market is telling you it now wants delivery, not roadmaps. That's a subtle shift in what has been carrying this index, and it is worth watching on Friday's open.
Buy the pullback, respect the ceiling
The plan doesn't chase the record. It buys the pullback into the 7,774 to 7,788 support, the tightest confluence on the board, where three separate methods stack inside a few points and where a routine mean reversion toward the five-day average would carry price anyway. The stop sits below 7,758, beneath the dominant volume shelf, and the targets run to the 7,808 pivot, then the 7,838 record, then the 7,856 supply grouping. Speculative funds added to shorts into a record high, which is fuel if the advance continues. But this is a data-day plan: retail sales land before the bell and five-year inflation expectations at ten, and an upside surprise on that second number is the most direct threat to the whole disinflation read. Half size, no entries before 9:45, and if crude gaps higher on the Gulf story, stand down entirely. How we grade these calls afterward is in our performance methodology.
The market got its bullish number, made a record, and closed pinned on the one level where dealer supply is heaviest, with the amplifier now switched on.
A record is a headline. A record close pinned on the ceiling, in a market that just switched on its own amplifier, with a Gulf premium that hasn't been priced, is a question the next number answers.
This is the read our members get every session, before the bell, with the levels drawn and the setup defined. See how the same dealer-positioning work turns into systematic signals.
View pricingThe complete data picture
Every number behind Thursday’s plan, charted first; the full numeric reference follows underneath.
Full numeric reference , every remaining figure from the review
| Average | Value | Settle vs |
|---|---|---|
| 5-day | 7,788.25 | +34.25 (mean-revert magnet) |
| 20-day | 7,615.91 | +206.59 (4.35%) |
| 50-day | 7,560.51 | +262 (8.7%) |
| 100-day | 7,383.43 | +439 |
| 200-day | 7,179.41 | +643 (9.0%) |
| YTD | 7,236.34 | +586 |
| Level | Reference |
|---|---|
| 7,734.17 | second pivot support (expected-range low) |
| 7,741.20 | volatility inflection level |
| 7,704.08 | third pivot support (near 7,680 risk pivot) |
| 7,666.20 | dealer gamma flip level |
| 7,521.20 | put-side dealer base |
| 156.30 pts | room to the gamma flip |
| Metric | Reading |
|---|---|
| Standing state | NEGATIVE gamma (amplifies both ways) |
| Call / put gamma | 1.87B / -283.11M |
| One-month implied / realized | 11.76% / 14.00% |
| IV rank / skew rank | 9.14% / 98.02% |
| Options-implied move | 57.53 index points |
| Real-time flow | +3B to -5B to -1.5B, net flat |
| Put-to-call OI | 1.29 |
| Largest delta expiry | August 21 (next Friday) |
| Cohort | Net |
|---|---|
| Asset managers | long about 937,000 (real money long) |
| Leveraged funds | short about 330,000 (+82,598 shorts) |
| Dealers | short about 717,000 (+70,074 longs) |
| Read | fast money short into a record |
| Small-cap gamma | NEGATIVE -136M (amplifies) vs large-cap positive |
| Open interest | 2,060,284 |
| Input | |
|---|---|
| PPI headline y/y | cooler than the 4.9% forecast (was 5.5%) |
| Sept hike odds | 35% from 40% |
| 10-year yield | 4.646%, fell four basis points |
| 30-year auction | highest rate in 25 years |
| Leadership | semis; memory +5%, SMCI +14%, Tesla +4% |
| Cisco | -8% on guidance, first crack |
| When | Event |
|---|---|
| Fri 02:45 | French consumer inflation |
| Fri 05:00 | Euro-area GDP flash |
| Fri 08:30 | US retail sales (core +0.2% vs -0.2%) |
| Fri 10:00 | Michigan sentiment + inflation expectations |
| Aug 21 | monthly options expiration (largest delta) |
| Aug 26 | core deflator + marquee chip earnings |



