
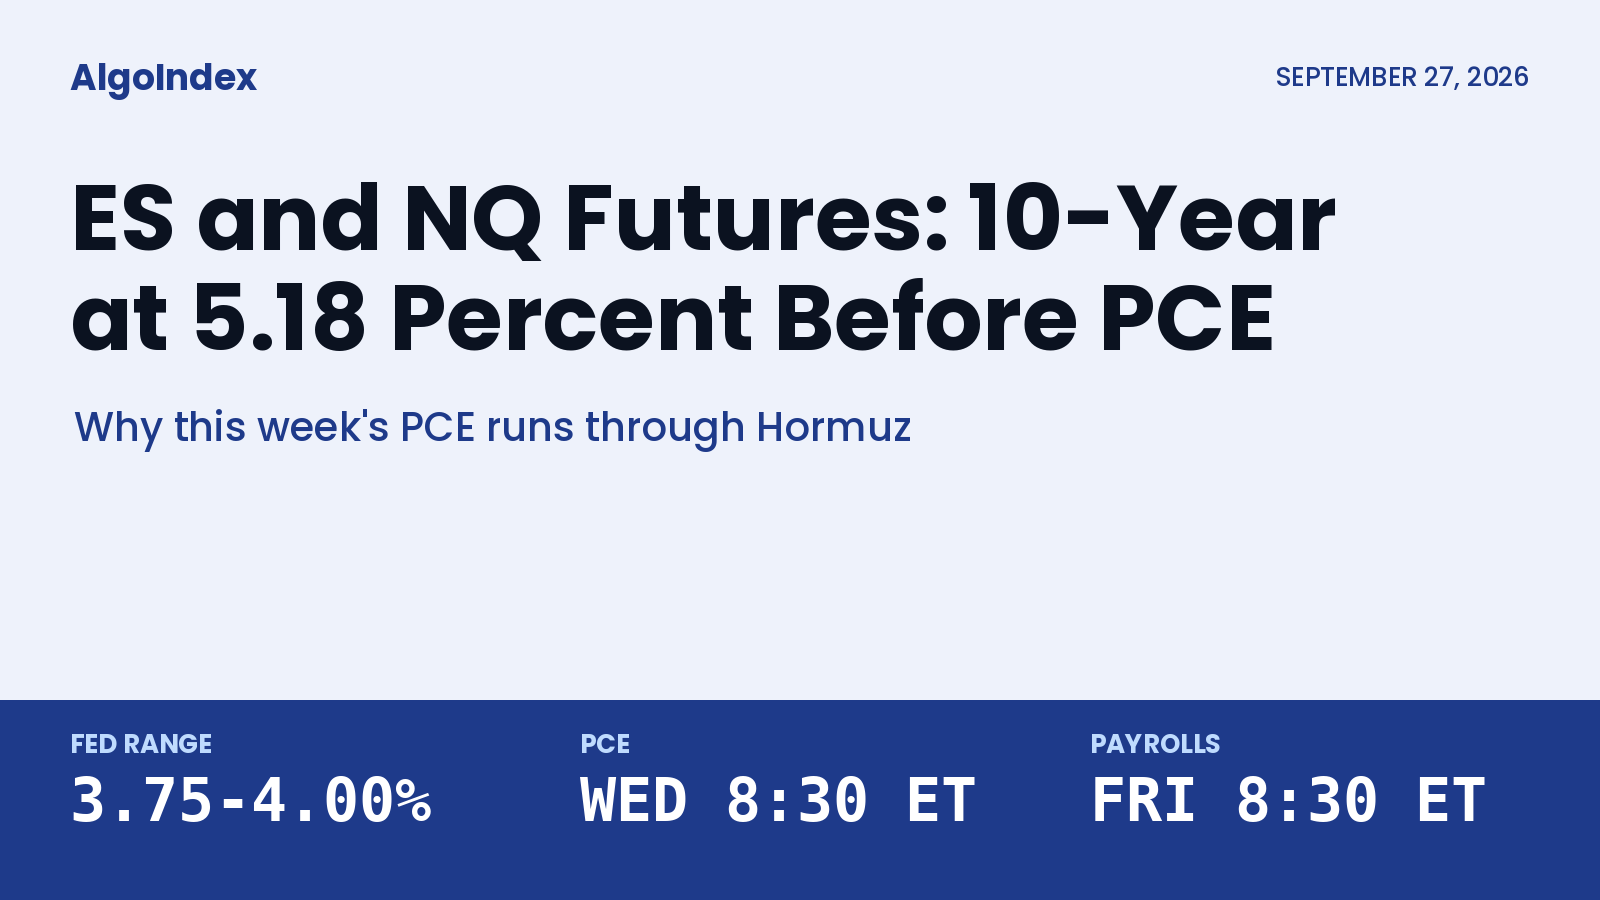
Kevin Warsh did not spend long on nuance on September 16. "Inflation is too high and has been for too long," the Fed chair told reporters after the central bank raised its target range by a quarter point to 3.75 to 4 percent. It was the first hike since 2023, and the vote was unanimous. Ten days later the bond market is still taking him at his word. The 10-year Treasury yield ended Friday at 5.18 percent, its highest close in almost two decades.
Now comes the test. The August personal consumption expenditures report, the Fed's preferred inflation gauge, lands on Wednesday, September 30, at 8:30 AM ET. September payrolls follow on Friday, October 2, at 8:30 AM ET. Both will be read through a barrel of oil sitting near 92 dollars and a Strait of Hormuz that stayed shut after the President rejected Iran's reopening plan on Saturday.
An oil shock becomes a rates problem in four steps: energy lifts headline inflation, higher inflation keeps the Fed tightening, tighter policy pushes yields up, and higher yields lower what investors will pay for future earnings. ES feels the last step through valuations. NQ feels it harder, because more of the Nasdaq-100's value rests on profits far in the future. Wednesday's PCE print is the week's first hard read on how far the first step has travelled.
Friday’s short lean against a 5.18 percent 10-year
Our S&P 500 futures outlook for Friday was built with the 10-year at 5.16 percent, and it named a pull in that yield back toward 5.10 percent as one of the developments that would override its short lean. Yields went the other way. The 10-year finished the week at 5.18 percent. The Friday ES outlook walks through those levels.
From a 113 peak to a 3.4 percent core forecast
Start with the pump. WTI began the year near 57 dollars and peaked at 113 in April, according to a bank research summary of the Fed decision. Energy runs straight into headline inflation within a month or two. It then leaks into everything that moves by truck or plane, a slower pass that shows up in core prices.
The consensus for Wednesday reflects both. Headline PCE is expected to rise 0.4 percent in August after 0.2 percent in July, leaving the annual rate at 3.7 percent. Core PCE, which strips out food and energy, is expected at 0.3 percent for the month, lifting the annual rate to 3.4 percent from 3.3.
Those are far from the Fed's 2 percent target. They also feed the second link. The Fed's own median projection now shows one more hike this year, and futures pricing has put the odds of an October move at roughly two-thirds or higher through the past week.
The third link is the one equity traders watch on their screens. When the market expects more hikes, shorter-dated yields rise, and the 10-year follows when investors also demand more to hold long bonds through an inflation scare. Nearly every benchmark maturity traded near or above 5 percent last week.
Why ES and NQ hear 5.18 percent differently
A stock is a claim on future profits, discounted back at some rate. Raise the rate and the present value falls. The effect is small for a profit due next year and large for one due in ten.
That is the reason the Nasdaq-100 and the S&P 500 do not react to yields by the same amount. The S&P 500 carries banks, energy producers and industrials, some of which benefit from higher oil or higher rates. The Nasdaq-100 leans on software and semiconductors, where a larger share of value sits in distant years. Our guide to NQ futures covers that composition in more detail.
Last week showed the tension in real time. Stocks rose on Friday, with the S&P 500 up 0.51 percent to 7,743.41 and the Nasdaq Composite up 0.48 percent, even as the 10-year sat at 5.18 percent. Falling oil and enthusiasm around artificial intelligence did the lifting. The rate pressure was simply outweighed for a day.
Hormuz, the swing factor inside Wednesday’s PCE
Here is the uncomfortable part for the rates market. The August PCE data is backward looking. It measures prices from a month when crude was higher than it is now. A hot print on Wednesday would tell the Fed what it already fears. A soft print would help, yet oil can undo it by Friday.
That is why the Saturday rejection matters for bonds as much as for crude. On Friday the oil market had begun to price a phased deal to reopen the strait, and WTI settled 2.20 dollars lower at 92.41. Front-month WTI also finished 7.89 dollars below the prior Friday, though that comparison spans the roll from the October to the November contract, and the incoming November contract traded well below the expiring October, so it overstates the same-contract decline. A deal would have taken pressure off the first link in the chain. The rejection puts it back on the table, and the size of the Sunday reopen in crude will feed straight into Monday's yield open. Our look at how weekend headlines gap crude covers that reopen in detail.
Payrolls: about 100,000 expected after 162,000
The consensus for Friday's September jobs report is a gain of about 100,000 after 162,000 in August, with unemployment rising to 4.2 percent from 4.1. Business surveys point the other way. The composite purchasing managers' index jumped to 58.4 in September, its highest since 2022.
A softer labor print would give the Fed a reason to pause. A firm one, arriving two days after a hot PCE, would leave October's decision close to settled. The University of Michigan's final September reading already showed consumer sentiment at a four-month low, with gasoline prices among the complaints. Households are feeling the first link directly.
Two weeks later, on Wednesday, October 14, at 8:30 AM ET, the September consumer price index arrives, so this week sets the tone for that print.
The reading order for the week
Four readings will tell most of the story before Wednesday.
Crude on Sunday night, because it sets the inflation tone for the week. The 10-year yield against 5.18 percent, because a push above the recent high would say bonds are pricing the rejection. The two-year yield, because it tracks the October meeting most closely. And the spread between ES and NQ, because a Nasdaq that lags on a day of rising yields is the chain working as described.
None of those readings is a signal on its own. Together they describe how much of Saturday's headline has reached the Fed's side of the table. Wednesday at 8:30 AM ET, a single inflation number will be asked to carry the weight of a strait that is still closed.
The complete data picture
Every number cited above, charted in one place: the policy, yield and crude readings, the five-step transmission chain, and the week’s calendar.
Sources and methodology
Event dates and times come from the official schedules: the Bureau of Labor Statistics September and October release calendars for JOLTS, payrolls and the consumer price index, the Bureau of Economic Analysis schedule for PCE and GDP, and the Institute for Supply Management, which posts its manufacturing report after 10:00 AM ET on the first business day of each month. The Micron entry is the earnings-call time from the company announcement, which gives 2:30 PM Mountain time for the call and does not state a release time for the results.
The Fed decision, the chair's remarks and this year's path in crude come from a bank research summary of the decision and a report on the yield move. Friday's index and yield closes come from a same-day market wrap and a weekly market review; some reports put the 10-year close at 5.17 percent, and this article uses the 5.18 percent in the wrap. Consensus figures for PCE and payrolls come from a weekly calendar preview and a second weekly preview; they are forecasts, not results.
Crude settlements come from a same-day energy report, which notes that the weekly WTI change spans the roll from the October to the November contract. The 10-year figures in the first-hand paragraph are the ones published in our September 25 ES outlook before the session. References to earlier AlgoIndex outlooks describe what those outlooks published before the session. This article does not grade any trade outcome.
Friday’s S&P 500 futures outlook is here, and our look at how weekend headlines gap crude is here. Outlooks for the equity index, technology index, gold and crude contracts are collected on the market outlook page, and our forward trading record is on the performance statement.



