
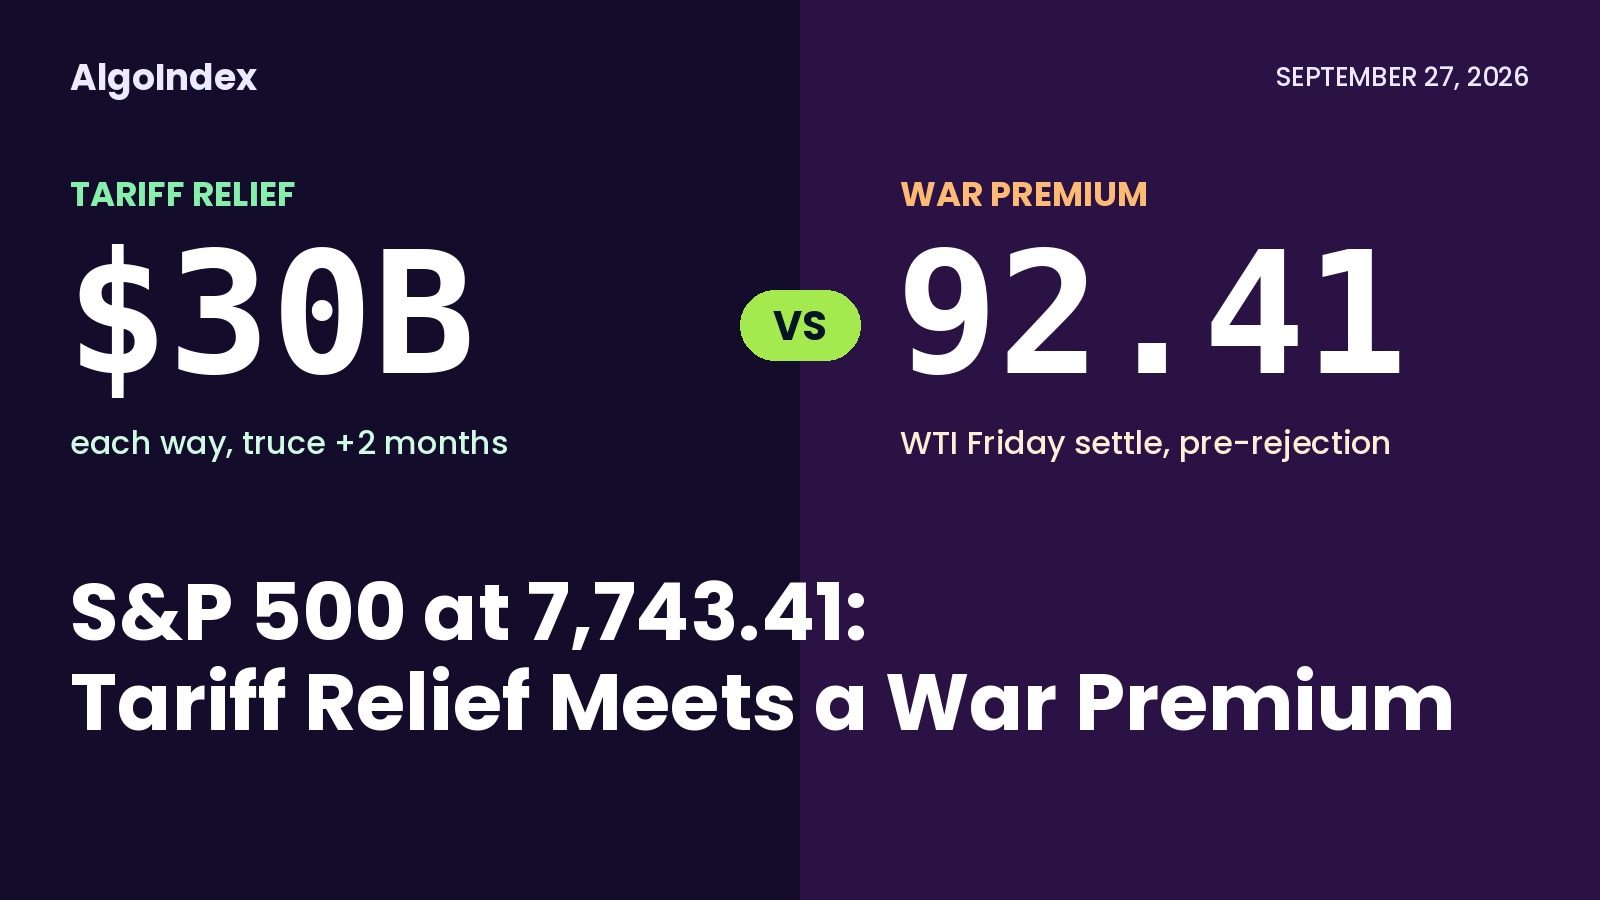
Saturday delivered two headlines that pulled in opposite directions.
The first came from Beijing, where China's foreign ministry confirmed the trade package from the Trump and Xi talks: tariff cuts on about 30 billion dollars of goods in each direction, which a White House statement had set out on Friday. The two-month extension of the trade truce past its November 10 expiry was older news, announced on Wednesday. The second came from the White House on Saturday, where the President told reporters that Iran's plan to reopen the Strait of Hormuz "would not be acceptable."
One headline lowers costs for importers and exporters. The other keeps a war premium in energy. Stock index futures reopen at 6:00 PM ET on Sunday with both on the table.
When headlines disagree, the one with the most direct route to prices tends to lead first. The tariff deal is modest in size and mostly helps sentiment around growth. The Hormuz rejection works through oil, inflation and rates, which are channels the market is already pricing hard with the 10-year at 5.18 percent. Crude, gold and the 10-year yield are the three gauges that usually show which story is winning, often before stocks settle on a direction.
Friday’s conditional gold short and its 4,324 to 4,336 band
Our gold outlook for Friday was a conditional short, built with the 10-year at 5.16 percent on the view that yields were the heavier force. It looked for a retracement into the 4,324 to 4,336 band before any entry. The Friday gold outlook carries the full level map and the conditions that would have voided the setup.
Sizing 30 billion dollars against a closed strait
Start with the trade deal, because its details matter. The cuts cover goods both sides call non-sensitive. American exports on the list include farm goods, wood and cosmetics, while American imports include small appliances, toys and decorations. The two sides also set up a trade council and agreed to hold a dialogue on artificial intelligence, with the next round due in November.
That is real relief for specific sectors. Retailers who import holiday decorations and farm states that sell to China both gain. For the index as a whole, the bigger piece is the truce extension. It removes a November cliff that would otherwise have hung over fourth-quarter guidance. Because the extension was public on Wednesday and the tariff package on Friday, much of this relief was already available before Friday's close. Saturday's confirmation mainly removed doubt.
Now the war premium. The Iranian plan, laid out on Friday at the United Nations, asked for released funds, lifted oil sanctions and an end to the naval blockade, with the strait reopening by day seven. Oil had already started to price it. WTI fell 2.20 dollars on Friday to settle at 92.41. The rejection takes that assumption off the table, at least for now.
The two stories are unequal in one important way. Tariffs on 30 billion dollars of consumer goods move a few sectors. A closed strait moves the cost of energy for everyone, and energy feeds the inflation numbers the Federal Reserve has just raised rates to fight.
A 0.51 percent Friday gain and the first hour
History offers a loose rule. Headlines with a direct price channel lead early. Headlines that change the outlook slowly get their turn later in the week, once analysts rework their numbers.
By that rule, crude speaks first. If oil reopens sharply higher on Sunday evening, the market is saying the rejection matters more than Friday's selling assumed. If it opens flat, the market may be reading the rejection as a negotiating stance, since Iran said it was still waiting for the mediators' formal answer.
Stocks tend to follow the second-order read. Friday's session showed what happens when the two forces meet. The S&P 500 rose 0.51 percent to 7,743.41 and the Dow gained 0.93 percent, helped by falling oil and a rally in artificial intelligence names, while the 10-year yield climbed to 5.18 percent. Lower oil offset higher rates for a day. On Monday, the order could flip.
Three gauges: crude 92.41, gold 4,280, the 10-year at 5.18 percent
Crude. The direct channel. Our look at how weekend headlines gap crude sets out the two reference prices for the reopen, the 92.41 Friday settle and the 94.61 Thursday settle. A move back toward the Thursday price would say the war premium is returning.
Gold. The fear gauge with a catch. Gold normally benefits from geopolitical stress, yet by Friday morning it was tracking a weekly loss of more than 2 percent as the dollar climbed to a two-month high and yields rose. Spot gold traded near 4,280 dollars an ounce on Friday morning, before the 10:00 AM ET sentiment release. If gold rises alongside oil after the reopen, the market is paying for safety. If gold falls while oil rises, the rates channel is dominating, and that tends to be the harder mix for stocks.
The 10-year yield. The link between oil and stock valuations. It closed Friday at 5.18 percent, near a two-decade high. A reopen in crude that lifts yields through that level would weigh on the Nasdaq-100 more than on the S&P 500, because long-dated earnings are more sensitive to the discount rate. A tariff-driven growth bid with steady yields would be the friendlier combination.
The calendar decides the tiebreak
Neither headline arrives alone. Personal consumption expenditures data for August lands on Wednesday, September 30, at 8:30 AM ET, with core expected up 0.3 percent on the month. Micron reports fiscal fourth-quarter results the same day and holds its earnings call at 4:30 PM ET, a key read on the artificial intelligence trade that lifted Friday's session. September payrolls follow on Friday, October 2, at 8:30 AM ET.
Those scheduled numbers will settle the argument more firmly than either weekend headline. Our ES futures guide explains how index futures absorb events like these outside cash hours, and the market internals guide covers the breadth readings that show whether a first-hour move has participation behind it.
When two headlines disagree, the market rarely splits the difference. It picks the one it can price fastest, and then waits for the data to confirm or reverse the choice. This week, the fastest price is a barrel of oil.
The complete data picture
Every number cited above, charted in one place: the trade and market figures, the three cross-asset gauges, and the week’s calendar.
Sources and methodology
Event dates and times come from the official schedules: the Bureau of Labor Statistics September and October release calendars for JOLTS, payrolls and the consumer price index, the Bureau of Economic Analysis schedule for PCE and GDP, and the Institute for Supply Management, which posts its manufacturing report after 10:00 AM ET on the first business day of each month. The Micron entry is the earnings-call time from the company announcement, which gives 2:30 PM Mountain time for the call and does not state a release time for the results.
The trade timeline comes from a wire report on the Beijing confirmation, which dates the White House statement to Friday and the truce extension announcement to Wednesday, and from a regional business report on the goods covered. The Hormuz rejection and the Iranian plan come from a news report on the White House remarks. Crude settlements come from a same-day energy report, and the S&P 500 and Dow figures from a same-day market wrap.
The gold figure is a spot quote from a precious metals report published Friday morning, before the 10:00 AM ET sentiment release; it is not a settlement, and the weekly loss it describes was tracked at that time. The Micron and PCE consensus figures come from a weekly calendar preview. The first-hand paragraph describes the entry condition published in our September 25 gold outlook. References to earlier AlgoIndex outlooks describe what those outlooks published before the session. This article does not grade any trade outcome.
Friday’s gold outlook is here, and our look at how weekend headlines gap crude is here. Outlooks for the equity index, technology index, gold and crude contracts are collected on the market outlook page, and our forward trading record is on the performance statement.



