
At 3:50 PM ET on the last trading day of a quarter, a column of numbers starts updating that most chart watchers never see. The exchanges begin publishing closing-auction imbalances, the difference between shares that must be bought and sold at the 4:00 PM ET close. On an ordinary day the imbalances are modest. On quarter end they can be large enough to move the S&P 500 in the final ten minutes, and E-mini futures move with it.
This quarter ends on Wednesday, September 30. The same day brings the August personal consumption expenditures report and the final estimate of second-quarter growth, both at 8:30 AM ET, and Micron's fiscal fourth-quarter results, with the company's earnings call at 4:30 PM ET. Payrolls follow on Friday, October 2. It is a crowded week, and some of the busiest orders in it have nothing to do with the news.
Month-end and quarter-end flows are orders driven by the calendar. The largest come from pension funds and balanced funds restoring target mixes of stocks and bonds, from index funds matching their benchmarks at the close, and from managers tidying portfolios before reports go out. They concentrate in the final days of the quarter and the last hour of trading. Once the new month begins, they can fade fast.
What our June 30 outlook flagged: the collar and the close
Options add a layer of their own. A large options-based equity fund resets a quarterly collar, a combination of bought puts and sold calls on the S&P 500, on the last trading day of each quarter. The old position is closed and a new one is opened at fresh strikes, and dealers who took the other side adjust their hedges around it.
Our June 30 quarter-end outlook flagged exactly this pair of forces. It named the quarterly collar roll, expected to print large hedging trades around 1:00 PM ET, and quarter-end rebalancing into the close as flows that could override the technical map for stretches of the day. The June 30 outlook is still on the site, and the dealer positioning guide explains why hedging flows can dampen or amplify moves near large strikes.
Rebalancing: the arithmetic of a fixed mix
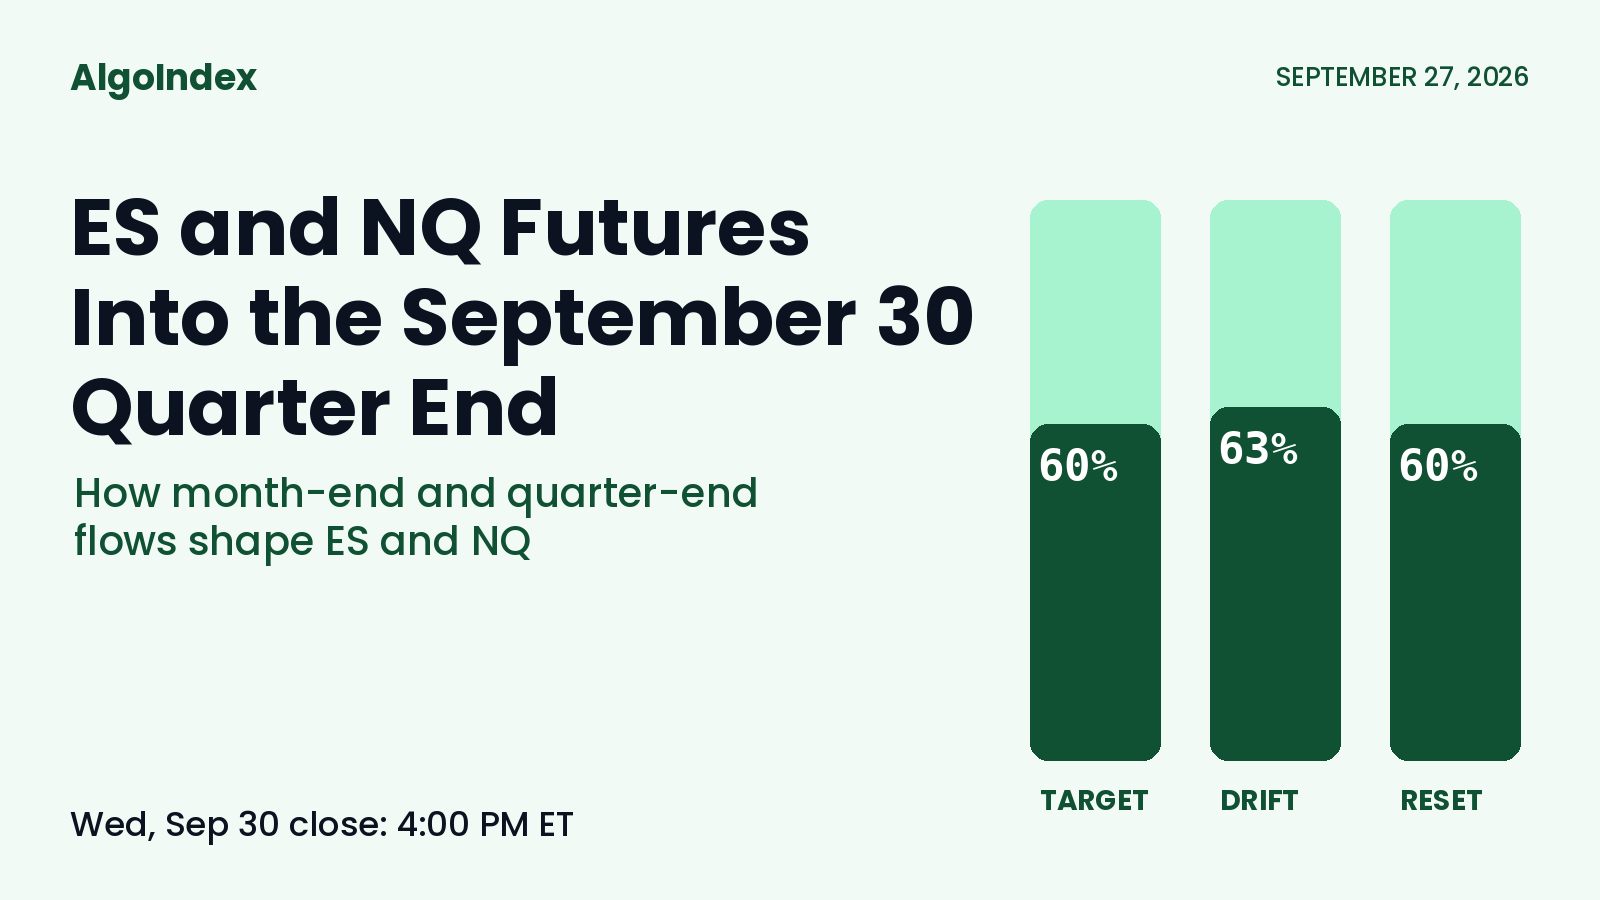
A pension fund with a 60 percent stock and 40 percent bond target does not hold that mix for long. If stocks rally and bonds fall over a quarter, the fund drifts toward, say, 63 and 37. At the end of the period many funds sell some of the winner and buy some of the laggard to return to target. The trade is mechanical. It happens whatever the managers think of the outlook.
This quarter's arithmetic points in a clear direction. The S&P 500 closed Friday at 7,743.41. At the end of June, the cash index was trading in a range of roughly 7,300 to 7,500, according to our June 30 outlook. Over the same stretch, the 10-year Treasury yield climbed to 5.18 percent, near a two-decade high, which means bond prices fell. Stocks up, bonds down. On that math, fixed-mix funds would lean toward selling equities and buying bonds into September 30.
Estimates of the size vary widely each quarter, and the timing is spread out. Some funds rebalance over several days, some on thresholds, some only at the close. That is why quarter-end selling pressure, when it appears, often shows up as a heavy final hour.
3:50 PM ET: closing auctions and the index funds
The second flow is bigger, and it runs every single day. Index funds and many exchange-traded funds must trade at the closing price to match their benchmarks. Their orders flow into the 4:00 PM ET closing auction. On quarter end, those orders combine with rebalancing trades and with any index changes that take effect at the close.
The imbalance data released from 3:50 PM ET shows which way the pile leans. A large buy imbalance can lift the cash index into the bell. A sell imbalance can do the reverse. Because ES and NQ futures trade against the cash indexes, the futures tend to track those final-minute moves closely, and then settle into the evening session when cash markets are shut.
Traders who study market internals watch the same window through breadth readings. Our guide to market internals explains how cumulative tick and volume measures help separate a broad move from a few heavy names being pushed around at the close.
Window dressing and the Nasdaq-100
Window dressing is the habit of adding recent winners and trimming losers before a quarterly report shows what a fund held. Evidence on how much it moves prices is mixed. The pattern still shows up often enough that the strongest names of a quarter can find late support, and the weakest can see late selling.
That matters more for NQ than for ES. The Nasdaq-100 is heavier in the large technology and semiconductor names that have led this year's gains, so any quarter-end trimming or topping-up of those names moves the index more. This week adds a twist. Micron reports on quarter end itself and holds its earnings call at 4:30 PM ET, so semiconductor positioning faces both calendar flows and a live earnings number within hours of each other. Our NQ futures guide covers why the index reacts so strongly to a handful of names.
October 1: new-month money after the bell
Calendar flows do not stop on September 30. The first trading days of a month often bring fresh money from retirement contributions and fund inflows, which is one reason researchers have documented a turn-of-the-month effect in stock returns. This year the new month opens on Thursday, October 1, with the ISM manufacturing survey at 10:00 AM ET, then runs straight into Friday's payrolls report.
So the week has two halves. Through Wednesday's close, mechanical orders tied to the old quarter compete with the PCE and Micron news. From Thursday, the new quarter's money meets the jobs data, with oil and the Strait of Hormuz hanging over both after the weekend rejection of Iran's reopening plan.
None of these flows is a forecast. They are known pressures with known timing, and their size is only visible as they happen. The value of mapping them in advance is simple: when the final ten minutes of Wednesday's session move sharply, it helps to know that part of the move was scheduled weeks ago.
The complete data picture
Every number cited above, charted in one place: the quarter-end times, the illustrative fixed-mix drift, and the week’s calendar.
Sources and methodology
Event dates and times come from the official schedules: the Bureau of Labor Statistics September and October release calendars for JOLTS, payrolls and the consumer price index, the Bureau of Economic Analysis schedule for PCE and GDP, and the Institute for Supply Management, which posts its manufacturing report after 10:00 AM ET on the first business day of each month. The Micron entry is the earnings-call time from the company announcement, which gives 2:30 PM Mountain time for the call and does not state a release time for the results.
Friday's S&P 500 close comes from a same-day market wrap, and the week's release list was cross-checked against a weekly calendar preview. The June quarter-end context, including the 7,300 to 7,500 cash range, is quoted from our published June 30 outlook; that range is a trading range from that outlook, not a single closing mark.
The rebalancing arithmetic is an illustration built from the direction of the quarter's moves in stocks and bonds, not an estimate of flow size. The descriptions of closing-auction imbalance data, index-fund closing trades, the quarterly collar reset and the turn-of-the-month effect are general market-structure background, not measurements from this quarter. No quarter-end flow forecast or realized rebalance size is claimed. References to earlier AlgoIndex outlooks describe what those outlooks published before the session. This article does not grade any trade outcome.
Our June 30 quarter-end outlook is here, and Friday’s S&P 500 futures outlook is here. Outlooks for the equity index, technology index, gold and crude contracts are collected on the market outlook page, and our forward trading record is on the performance statement.



