
At 8:30 on Friday morning the July payroll count came in at minus 23,000 jobs, a miss of more than one hundred thousand against what forecasters had penciled in, and the S&P 500 turned around and went up.
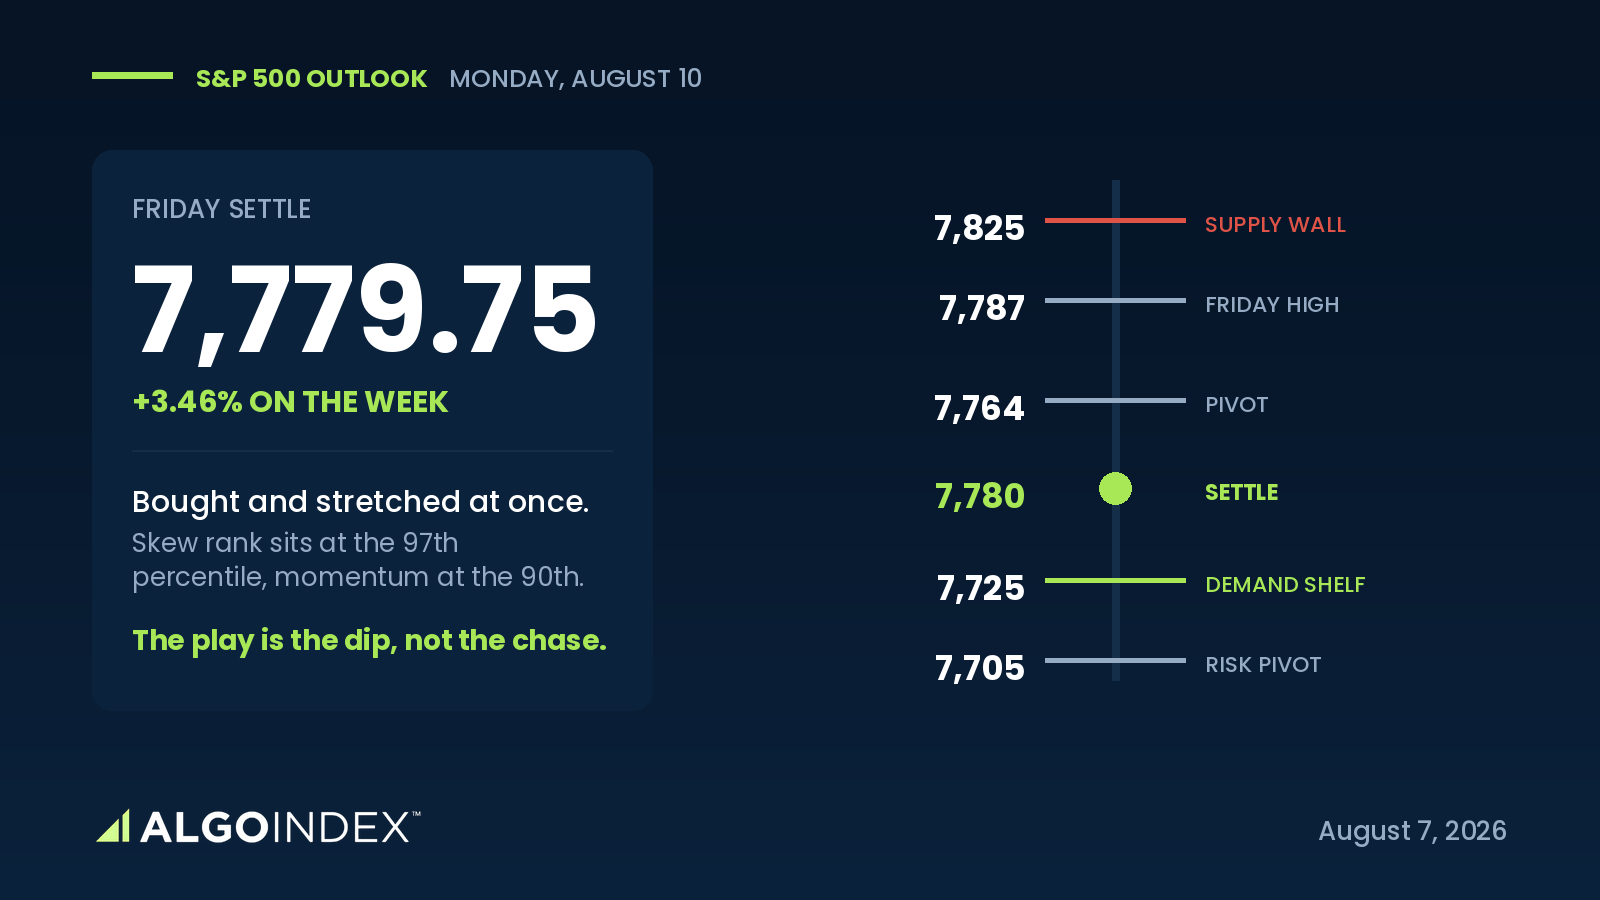
That reaction is the whole story. For weeks traders have been pricing the risk that the Federal Reserve tightens again, not eases, and three policy makers dissented in favor of a hike at the last meeting. So a labor market that's shedding jobs takes pressure off the one threat that actually mattered. The September E-mini closed the week at 7,779.75, up 260 points across five sessions and within seven points of an all-time high. Here's the tension it carries into Monday. The S&P is about as bought as this market gets and about as stretched as it gets, at the same moment, sitting right under a band of supply it hasn't cleared.
The rally nobody is paying to hedge
Start with what the move was, because it changes how you trade Monday. This was a relief rally against the risk of tighter policy, not a bet on easing. Ten-year yields slipped three basis points to 4.65 percent. The odds of a September hike dropped to 44 percent from 58 percent inside the session. Growth did the heavy lifting, with the Nasdaq-100 up 1.19 percent against 0.62 percent for the broad index and 0.28 percent for the Dow.
And here's the part that should set your size. The options market is pricing Monday cheap. At-the-money implied volatility for the session sits near 7 percent against one-month realized of 14 percent, and the implied-volatility rank closed at the 14th percentile of its own year. Cheap protection heading into a week that carries a consumer price release on Wednesday is worth owning. The real event isn't Monday. It's Wednesday.
A stack this clean should not feel this dangerous
The technical picture is, in plain terms, perfect. Price sits above every major moving average. The multi-indicator composite reads a full 100 percent buy, all thirteen component studies aligned, after reading 32 percent sell just one week ago. That's a complete reversal in five sessions.
Now the other side. Stochastics sit between 86 and 97 percent across every lookback from nine days to one hundred. Price is 2.89 percent above its own 20-day average. What saves the setup from looking like a blow-off is the directional read: the 9-day index at 33.62 describes a genuine, powerful short-term trend, while the 50-day at 9.08 says that over a quarter this market has no established direction at all. This is a young impulse coming out of a long range. The tired-old-trend reading doesn't fit, and young impulses out of ranges tend to run further than the oscillators say they should. That's why we aren't fading strength here.
Where the buyers actually showed up
We've tracked this contract since it bottomed at 7,324 on July 29, and Friday it did the thing that turns a bounce into a base. On the payroll release it came back to 7,725.50, and buyers took it. A low that gets tested on the news and defended stops being an incidental low and becomes a reference. Look at what sits in that pocket: the first support projection at 7,741.25, Thursday's settlement at 7,734.75, Friday's defended low at 7,725.50, the translated dealer-positioning support near 7,725, the momentum reset at 7,721.00, and the one-standard-deviation boundary at 7,719.59. Six methods inside 22 points.
Two other things lean the same way. Dealer positioning came out of Friday supportive beneath spot, so hedging flows should soften a probe into that shelf rather than drive through it. And the fast money is short. Speculative funds piled on more than 82,000 short contracts during a week that printed a record. That's fuel. It doesn't make a signal by itself, but it tilts the odds that upside breaks keep going and that downside probes find covering bids early.
When the fast money is short into a record and the real money is holding its length, the surprises tend to come to the upside.
The ceiling, and why we buy the dip
Above the market, the 7,820 to 7,826 band is the wall. It stacks the record high from Wednesday, the second computed resistance at 7,825.25, and the translated dealer-positioning resistance in one place. Chasing into that with momentum at the 90th percentile and skew ranking at the 97th, a near-record one-sided reading, is thin pay for the risk taken. The desk that publishes the positioning data said as much this week, suggesting some length be trimmed and cheap downside added right here.
So the plan stays patient. On a data-free Monday after a strong Friday close, the base case is an early probe lower as short-term traders book profit, absorption at a defined level, then a recovery. We want the rotation into 7,738 to 7,725, with a stop below 7,700 where the constructive read breaks. Targets sit at Friday's high near 7,787, then the record at 7,820, then 7,864. If the market instead gaps and grinds straight through 7,826 on real volume, that's the alternate long, and the short base becomes the reason it keeps running. For how we track these calls after the fact, see our performance methodology.
Monday hands this market no news of its own, which leaves it alone with a shelf it has already defended once.
This is the read our members get every session, before the bell, with the levels drawn and the setup defined. See how the same dealer-positioning work turns into systematic signals.
View pricingThe complete data picture
Every number behind Friday’s plan, charted first; the full numeric reference follows underneath.
Full numeric reference , every remaining figure from the review
| Average | Value | Spot above by |
|---|---|---|
| 5-day | 7,731.55 | +48.20 |
| 20-day | 7,561.08 | +218.67 (+2.89%) |
| 50-day | 7,547.63 | +232.12 (+3.08%) |
| 100-day | 7,327.92 | +451.83 (+6.17%) |
| 200-day | 7,159.55 | +620.20 (+8.66%) |
| YTD | 7,218.07 | +561.68 |
| Level | Reference |
|---|---|
| 7,625.09 | 9-day average crossover |
| 7,576.93 | dealer positioning flip level |
| 7,551.93 | volatility inflection |
| 7,426.93 | primary put-side concentration strike |
| 7,926.93 | primary call-side concentration strike |
| 8,026.93 | primary overall concentration strike |
| Metric | Reading |
|---|---|
| One-day implied move | 0.70% (about 61 index pts) |
| Five-day implied move | 1.56% |
| At-the-money IV for Monday | about 7% vs 14% realized |
| Front-month IV / realized | 13.07% / 14.82% |
| Call vs put positioning | 2.91B vs -4.67B |
| Positioning tilt / notional | 1.337 / 1.052B |
| Real-time hedging delta | +2B (call buying + put selling) |
| Put-to-call OI | 1.28 (puts sold, not bought) |
| 25-delta risk reversal | -0.035 |
| Largest positioning expiry | Aug 20 |
| Cohort | Net |
|---|---|
| Leveraged funds | short 329,999 (+82,598 shorts) |
| Asset managers | long 937,033 |
| Dealers / intermediaries | short 716,826 |
| Commercials | short 84,376 |
| Non-commercials | short 27,258 |
| Equity-fund spec net short | 319,577 (+32,299) |
| Input | |
|---|---|
| Nonfarm payrolls | -23,000 vs +80,000 (prior 57k to 20k) |
| Private payrolls | +30,000 vs +82,000 |
| Avg hourly earnings | +0.1% m/m, 3.2% y/y |
| Unemployment | 4.1% from 4.2% (participation) |
| 10-year yield | 4.65%, -3 bps |
| Sept hike odds | 44% from 58% |
| NDX / SPX / Dow | +1.19% / +0.62% / +0.28% |
| When | Event |
|---|---|
| Sat 13:25 | Fed governor speaks |
| Sat 21:30 | China CPI 0.8% / PPI 3.9% |
| Sun 19:50 | Bank of Japan minutes + current account |
| Mon 04:30 | Eurozone Sentix -0.5 vs -3.1 |
| Wed 08:30 | US CPI: 0.1% m/m, 3.4% y/y, core 0.2%/2.5% |
| Thu 08:30 | US PPI + jobless claims |
| Fri 08:30 | US retail sales +0.2% |



