
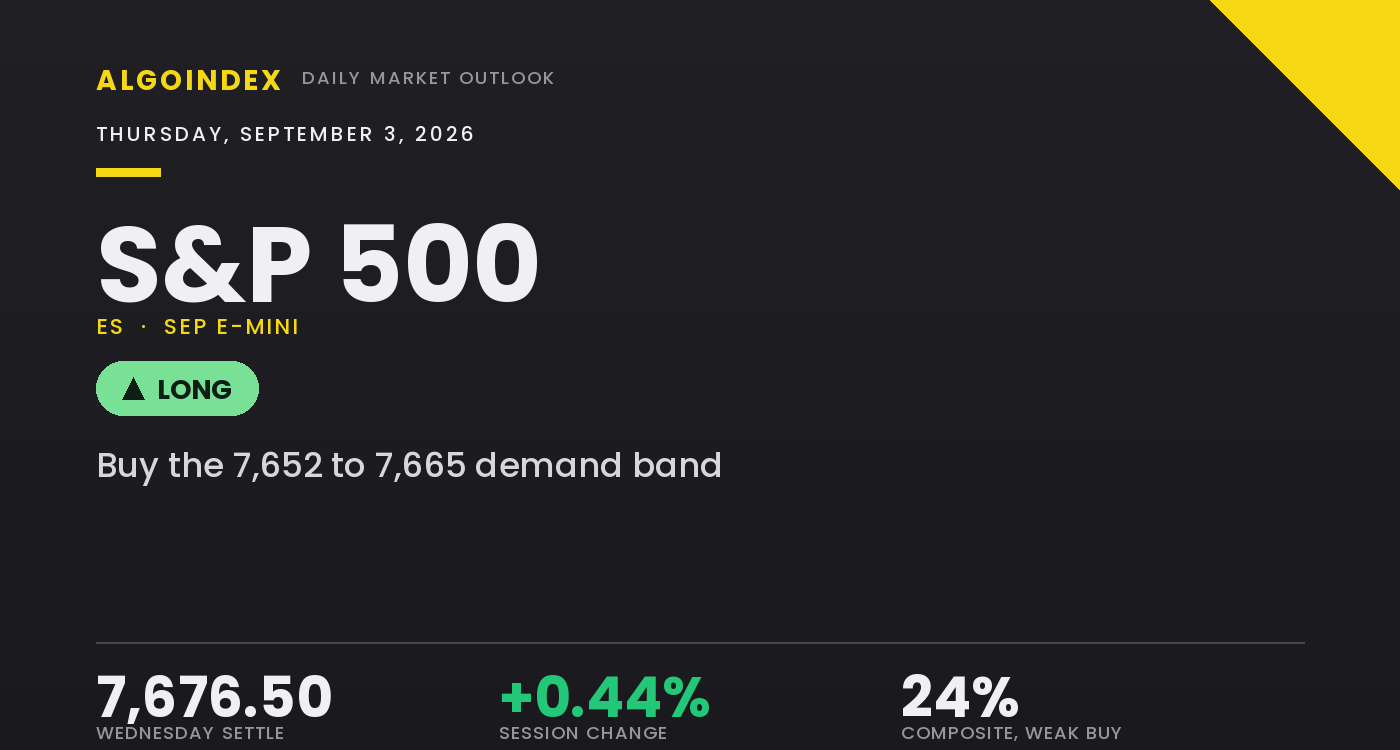
The September E-mini settled Wednesday at 7,676.50 (SPX 7,666), up 33.75 points or 0.44 percent, after a session that spent its first half extending Tuesday's breakdown and its second half undoing it. The contract opened at 7,645.00, sold into a fresh one-month low at 7,618.50, then recovered 58.00 points to close within 14.75 points of the session high at roughly 80 percent of the range, the strongest close quality in a week. The driver was a reversal in rate expectations rather than anything equity-specific. A softer than expected August private payrolls estimate trimmed tightening bets, the 10-year note yield finished close to unchanged near 4.79 percent after backing away from its highs, and dovish remarks from a regional Federal Reserve president accelerated the afternoon bid. Energy pulled the other way, with crude pressing to a six-week high above 91 dollars as hostilities involving Iran escalated.
The internal composition matters more than the point gain. Price has now tested and held the 7,618 to 7,622 (SPX 7,608 to 7,612) shelf on two consecutive sessions and closed back above both the 7,660 (SPX 7,650) primary positioning pivot and the 7,654 (SPX 7,644) dealer gamma flip, a constructive short-term picture. Against that, the 18-day and 20-day averages sit overhead at 7,720 and 7,724 (SPX 7,710 and 7,714), the short-term multi-indicator composite still reads net negative at 24 percent buy, and dealer positioning remains net short gamma, with the gamma index at negative 1.157 on the cash index, so intraday moves get amplified rather than dampened. This is a market that has repaired its immediate downside without yet earning the level that would confirm a trend resumption.
A rate repricing that reclaimed the pivot and the flip
The constructive read starts with location. Cash closed back above the 7,650 primary positioning pivot that has carried since August 20 and above the 7,644 dealer gamma flip, reversing the majority of Tuesday's 58.50 point decline. Two consecutive sessions have now produced lower intraday lows into the same 7,618 to 7,622 band followed by closes well off those lows, accumulation behaviour rather than distribution, and September 1 and September 2 printed lows of 7,621.50 and 7,618.50 within 3 points of each other, a double bottom rather than a continuation of lower lows. The short-term stochastic sits depressed, the 14-day raw at 27.43 percent against a 50-day raw of 68.22 percent, oversold inside a still-elevated intermediate reading, a combination that historically favours mean reversion upward.
The qualifier is what sits overhead and how dealers are positioned. The 5-day average at 7,683.05 and the 9-day at 7,691.81 are the first mechanical objectives, but the heavier band is the 18-day and 20-day at 7,720.32 and 7,723.85, alongside the week high at 7,724.00, and reclaiming that band is what would clear the highs of the last three sessions and put the August 28 swing high at 7,782.50 back in play. Dealer positioning is net short gamma, gamma tilt 0.923 with market-maker gamma notional negative 216.692 million dollars on the cash index, so a move that starts tends to extend rather than fade, which argues for buying a controlled pullback into confluence rather than chasing the recovery into overhead supply. The single condition that would end the lower-high structure dating from August 13 is a reclaim of 7,724.00.
The 7,652 to 7,665 confluence band and the 7,706 resistance shelf frame Thursday
Two zones define the session. Below, the 7,652 to 7,665 (SPX 7,642 to 7,655) band is the densest confluence on the chart, an 11-point pocket containing the 7,665 volatility inflection level, the 7,662.08 computed pivot, the 7,660 positioning pivot and the 7,654 dealer gamma flip, and it is where a controlled pullback is bought. Above, the first genuine resistance shelf runs from Wednesday's 7,691.25 high and the 9-day average at 7,691.81 up to the 7,706 confluence (SPX 7,696), where first pivot resistance at 7,705.67 and one standard deviation resistance at 7,706.09 sit less than half a point apart. The 7,720 to 7,724 average band caps the move beyond that. The volatility surface reads cheap and unloved, implied-volatility rank near the bottom of its year at 16.02 percent and skew rank at 37.70 percent, protection cheap and demand for it muted into a payrolls print two sessions out.
Buy the pullback into the confluence band, respect the shelf, size it down
The plan buys a controlled pullback into the 7,652 to 7,665 (SPX 7,642 to 7,655) band where the computed pivot at 7,662.08, the positioning pivot at 7,660 and the dealer gamma flip at 7,654 overlap, rather than chasing the recovery into overhead supply. The stop is 7,638 (SPX 7,628), beneath both the one standard deviation support at 7,646.91 and Tuesday's 7,642.75 settle, about 20 points from the 7,658 entry midpoint, so the position exits only after every reference the market reclaimed on Wednesday is lost. Targets run to 7,691 (SPX 7,681), Wednesday's high and the 9-day average at 7,691.81, then 7,706 (SPX 7,696), the sub-point pairing of first pivot resistance and one standard deviation resistance, then an extended 7,735 (SPX 7,725) at second pivot resistance, reachable only if the 7,720 to 7,724 average band gives way on volume, for roughly one-to-1.65, one-to-2.4 and one-to-3.85 reward-to-risk. Half size is deliberate: the 8:30 AM ET jobless-claims and trade-balance block, the 10:00 AM ET services report with its 48.7 employment sub-index, and three separate Federal Reserve speakers all land inside the session, and the largest delta expiry sits on Friday's payrolls print. Two developments override the level map in real time. A services employment component printing beneath 47 at 10:00 AM ET would put the 7,654 flip back in play quickly and open the 7,633 pivot support. A material Gulf escalation that carries crude decisively above 95 dollars invalidates the long regardless of price location. A decisive move beneath the 7,618 shelf on expanding volume flips the structure and opens 7,589 then 7,560. Our published record lays out how we grade these calls.
Wednesday repriced rates lower and closed the E-mini back above both its positioning pivot and its dealer gamma flip at 80 percent of the session range. The contract is boxed between a confluence band that has now held twice and an overhead average band that has capped every rally since late August, with net short dealer gamma amplifying whatever move starts. The 7,652 to 7,665 band is where a pullback is bought, the 7,691 to 7,706 shelf is the first objective, and a reclaim of 7,724 held is the single event that would end the lower-high structure.
A close back above both the positioning pivot and the dealer gamma flip in a weak-trend market is a pullback to buy, not a level to chase. The edge is the 7,652 to 7,665 (SPX 7,642 to 7,655) confluence band, and the failure is a sustained session beneath 7,638 or a services employment component beneath 47 at 10:00 AM ET.
This is the read our members get every session, before the bell, with the levels drawn and the setup defined. See how the same dealer-positioning work turns into systematic signals.
View pricingThe complete data picture
Every number behind Thursday’s plan, charted first; the full numeric reference follows underneath.
Full numeric reference, every remaining figure from the review
| Average | Value | Settle vs |
|---|---|---|
| 5-day | 7,683.05 | above spot by 6.55, the nearest mechanical hurdle a recovery must clear |
| 20-day | 7,723.85 | above spot by 47.35, the reference that has capped price since late August |
| 50-day | 7,614.89 | below spot by 61.61, just beneath the two-day low shelf and the line that decides the intermediate picture |
| 100-day | 7,522.19 | below spot by 154.31 |
| 200-day | 7,229.28 | below spot by 447.22 |
| Level | Reference |
|---|---|
| 8,010 | primary gamma concentration strike, cash 8,000 |
| 7,838.50 | 52-week high and structural ceiling, cash 7,828 |
| 7,810 | primary call-side ceiling, cash 7,800 |
| 7,778 | computed third resistance 7,778.42, cash 7,768 |
| 7,754 | 38.2 percent retracement and mapped magnet, cash 7,744 |
| 7,735 | computed second resistance 7,734.83 with the 50 percent retracement 7,728.50, cash 7,725 |
| 7,724 | week high, 20-day average 7,723.85 and 18-day average 7,720.32, cash 7,714 |
| 7,706 | target 2, first pivot resistance 7,705.67 and one standard deviation resistance 7,706.09, cash 7,696 |
| 7,691 | target 1, Wednesday's high and the 9-day average 7,691.81, cash 7,681 |
| 7,676.50 | September settle |
| 7,665 | volatility inflection level and top of the buy zone, cash 7,655 |
| 7,662 to 7,652 | the confluence band and entry, the computed pivot and positioning pivot, cash 7,652 to 7,642 |
| 7,660 | primary positioning pivot, cash 7,650 |
| 7,654 | dealer gamma flip level and base of the buy zone, cash 7,644 |
| 7,647 | one standard deviation support 7,646.91, mapped magnet and 40-day average 7,637.54, cash 7,637 |
| 7,643 | Tuesday's settle 7,642.75, the last reference reclaimed, cash 7,633 |
| 7,638 | stop, beneath the one standard deviation support and Tuesday's settle |
| 7,633 | first pivot support 7,632.92, cash 7,623 |
| 7,620 | two-session low shelf and one-month low, cash 7,610 |
| 7,589 | second pivot support 7,589.33, cash 7,579 |
| 7,510 | primary put-side support base and mapped magnet, cash 7,500 |
| Metric | Reading |
|---|---|
| Call gamma / put gamma | call gamma 5.69 billion against put gamma negative 1.42 billion, cash index |
| Index gamma and notional | the gamma index reads negative 1.157 on the cash index and negative 0.496 on the primary tracking fund, with market-maker gamma notional negative 216.692 million dollars on the cash index and negative 1.005 billion on the tracking fund |
| Gamma tilt | 0.923, net short gamma, meaning dealer hedging amplifies direction rather than dampening it so a move that starts tends to extend |
| Real-time hedging flow | negative 3.7 billion dollars of delta on the day, negative 5.5 billion from zero-day call selling and positive 3.2 billion from zero-day put selling, both volatility-selling behaviours that suppressed range and provided support |
| Volatility inflection and gamma flip | cash 7,655 (ES 7,665) and cash 7,644 (ES 7,654), the flip the market reclaimed on Wednesday |
| Concentration strike, call ceiling, put base | cash 8,000 (ES 8,010), cash 7,800 (ES 7,810), cash 7,500 (ES 7,510) |
| Largest expiries | the largest expiry by gamma is December 18 and the largest by delta is September 4, the Friday payrolls session, stacking the market's directional exposure on that print |
| Put-to-call | put volume 1.116 million against call volume 742,804 for a 1.50 volume ratio, with the published open-interest ratio at 1.34 while 9.687 million calls against 13.843 million puts imply 1.43, the roughly 0.09 gap a snapshot-timing artefact |
| 25-delta risk reversal | negative 0.049, cash index |
| Volatility surface | 30-day implied volatility 12.83 percent over one-month realized 7.35 percent, implied-volatility rank 16.02 percent, skew rank 37.70 percent, cheap absolute volatility with muted demand for protection |
| Cohort | Weekly change |
|---|---|
| Non-commercial accounts | net short by 67,994 contracts as of August 25, holding 241,495 long against 309,489 short, the long side reduced by 33,820 and the short side increased by 23,614 over the reporting week, a speculative-short build into a twice-defended shelf |
| Leveraged funds and asset managers | leveraged funds net short by 315,204, having cut 15,765 longs and added 18,037 shorts, while asset managers remain heavily net long at 1,166,084 against 212,856 short, with open interest at 1,983,601 contracts |
| Input | |
|---|---|
| Fed policy | the August private payrolls estimate came in beneath consensus and a New York district Federal Reserve president stated inflation continues to trend lower, though positioning since the late-August symposium has shifted toward a higher probability of a September tightening move and one governor pushed back on the idea that underlying inflation has improved |
| Dollar and rates | the 10-year note yield finished close to unchanged near 4.79 percent after backing away from its highs, the stabilisation that allowed equities to recover, while July factory orders beat expectations |
| Geopolitics | crude pressed to a six-week high above 91 dollars as hostilities involving Iran escalated, and late Wednesday evening regional defence authorities in Kuwait reported responding to missile and drone strikes at 9:39 PM ET and 9:43 PM ET, after the equity close |
| Cross-asset | the volatility index closed 15.19, lower by 7 percent, the volatility-of-volatility index 86.25, lower by 6 percent, with crude at 91.51, gold at 4,401.57 and the Nasdaq 100 at 29,121.55 |
| Large-cap leadership | the Dow rose 0.56 percent, the broad index 0.46 percent and the Nasdaq 100 only 0.23 percent, so leadership sat in value and cyclicals rather than the mega-cap technology complex, with single-stock hedging flow finishing around positive 2 billion dollars of delta |
| Single names | the dominant semiconductor name rose 3 percent and cleared a gamma threshold at 220 to close at 224, and a major hardware maker rose 16 percent on results, pressing from a base at 420 toward its call-side ceiling at 500 and drawing the largest single-name hedging flow of the past 30 days |
| After the close | a large semiconductor supplier rose 2 percent and an enterprise hardware name fell 5 percent, both inside their implied moves, while a data-warehousing name rose 21 percent, well outside its move, none large enough to dominate Thursday's open |
| Global rates | the Bank of Canada held at 2.25 percent as expected, while a Bank of Japan official implied a 50 basis point move or back-to-back hikes could come in September, a yen-funding consideration for global risk positioning |
| When | Event |
|---|---|
| Thu Sep 3 | the 8:30 AM ET jobless-claims and trade-balance block with a Federal Reserve governor speaking, then the 10:00 AM ET services report at 54.1 with its 48.7 employment sub-index the first-order number, and two more Federal Reserve speakers at 3:00 PM and 3:55 PM ET |
| Fri Sep 4 | the payroll report at 8:30 AM ET, consensus 55 thousand after a negative 23 thousand prior with unemployment holding at 4.1 percent, the week's dominant number and the largest delta expiry in the options structure |
| Mon Sep 7 | the Labor Day holiday, a shortened calendar into the following week |
| Sep 11 to 18 | consumer inflation on September 11, the policy decision and updated projections on September 16 and the quarterly expiry on September 18 frame the rest of the month |
The economic releases referenced above are published on the official government calendars below. Price levels are derived from standard technical and statistical methods, and the market read is AlgoIndex's own analysis. How we grade these calls is set out in our performance methodology.
- US Bureau of Economic Analysis, Personal Income and Outlays (PCE)
- US Bureau of Economic Analysis, Gross Domestic Product
- US Bureau of Economic Analysis, release schedule
- US Census Bureau, Advance Durable Goods (M3) release schedule
- US Energy Information Administration, Weekly Petroleum Status Report
- US Department of the Treasury, auction schedule and results
- AlgoIndex performance methodology



