
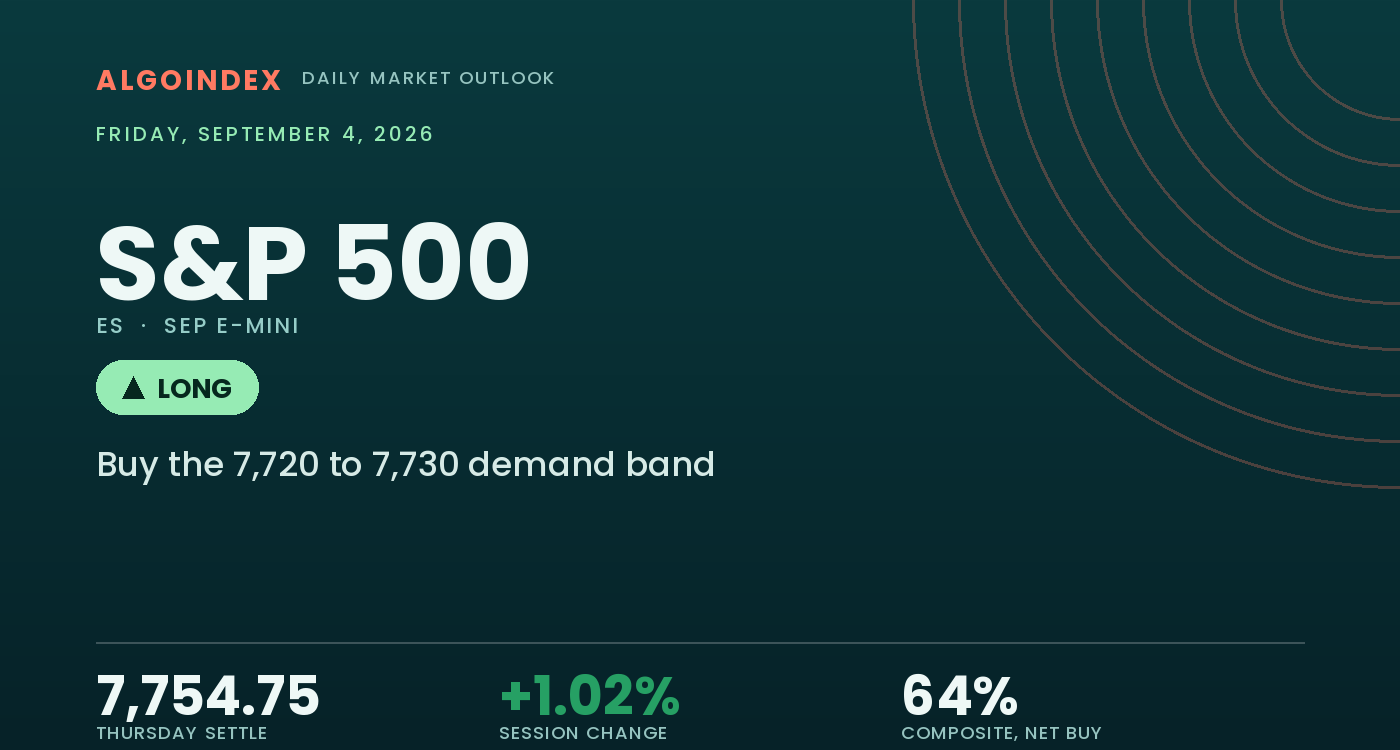
The September E-mini settled Thursday at 7,754.75 (SPX 7,748), up 78.25 points or 1.02 percent, in a full session that ran from 7,661.25 to 7,766.50 and closed at 88.8 percent of that 105.25-point range, the strongest close of the week. The contract opened the Globex session at 7,673.50, printed its low at 7,661.25 and then recovered on a sequence of hourly closes at their own extremes, the signature of accumulation rather than short covering. The driver arrived early and was singular. Fed Governor Waller, speaking at 8:30 AM ET, said policymakers are finally seeing signs of disinflation and indicated he would support holding rates steady if next week's inflation report shows continued progress, which reset a September meeting the market had been pricing as a live increase. Odds of a September rate rise fell roughly 13 percentage points on the session to about 50 percent, the dollar index fell 0.58 percent to 99.001, and the volatility index was sold hard, down 5.79 percent to 14.31.
The internal composition frames Friday as a genuine tension. Price now sits above every major moving average, the short-term multi-indicator composite reads 80 percent buy, and dealer positioning is comfortably positive with the settle 123.25 points above the gamma flip at 7,631.5 (SPX 7,622), an arrangement that historically dampens realized movement. Against that, trend strength is absent rather than merely soft: the 14-day directional index sits at 13.45, the medium-term composite reads only 25 percent buy, and implied volatility is compressed to a 16.02 percent rank, which leaves little room for a further volatility-compression bid to do the work. The market has repaired its damage without yet proving it can extend, and it must clear the August 13 contract high at 7,838.50, still 83.75 points overhead, before the repair becomes a trend.
A rate repricing that lifted price above every average
The constructive read starts with location and breadth. Thursday's advance carried the contract above the 5-day at 7,699.00, the 20-day at 7,727.84 and every longer average, with the settle 26.91 points above the 20-day it had struggled beneath through the early week. The reversal was broad rather than narrow, the Dow up 1.18 percent and the Nasdaq 100 up 1.16 percent against the broad index's 1.06 percent, and NYSE breadth finished firmly positive with net advancers at 615 and net advancing volume at 1.48 billion shares. Relative strength readings confirm without stretching, the 14-day at 57.14 after a 6.90-point advance and nothing near an overbought boundary, so Thursday's move did not exhaust the oscillator picture.
The qualifier is trend strength and the ceiling overhead. The 14-day directional index at 13.45, the 20-day at 10.76 and the 50-day at 7.04 all sit far beneath the level that denotes a directional environment, so the advance is a repair inside a rangebound structure rather than a trend. The one blemish in the average stack is the 5-day still beneath the 20-day, a residue of the early-week drawdown that Thursday began to resolve. Above the settle, the first obstacle is Thursday's high at 7,766.50 (SPX 7,759), then the first pivot resistance band at 7,793.75 (SPX 7,787), and the primary upside gamma boundary at 7,809.5 (SPX 7,800) caps a normal-range Friday. The structural ceiling for the entire recovery is the 7,838.50 contract high, 83.75 points and 1.08 percent above the settle.
The 7,720 to 7,730 confluence band and the 7,794 resistance shelf frame Friday
Two zones define the session. Below the settle, the 7,720 to 7,730 (SPX 7,713 to 7,723) band is the densest confluence on the chart, where the computed pivot point at 7,727.50, the 50 percent retracement of the four-week span at 7,728.50 and the 18-day average crossing at 7,720.75 converge, and it is where a controlled pullback is bought. Above, the first genuine obstacle is Thursday's 7,766.50 high with the computed target at 7,764.17 immediately beneath it, then the 7,793.75 to 7,797.49 (SPX 7,787 to 7,790) shelf where first pivot resistance and one standard deviation resistance sit less than four points apart. The primary upside gamma boundary at 7,809.5 (SPX 7,800) caps the move beyond that. The volatility surface reads cheap, implied-volatility rank near the bottom of its year at 16.02 percent and a mild put skew, protection inexpensive into a payrolls print that carries the largest near-dated delta expiry.
Buy the pullback into the confluence band, respect the shelf, size it down
The plan buys a controlled pullback into the 7,720 to 7,730 (SPX 7,713 to 7,723) band where the computed pivot at 7,727.50, the 50 percent retracement at 7,728.50 and the 18-day average crossing at 7,720.75 overlap, rather than chasing Thursday's close into overhead supply. The stop is 7,688 (SPX 7,681), beneath both the first pivot support at 7,688.50 and the two standard deviation support at 7,694.30, about 37 points from the 7,725 entry midpoint, so the position exits only after the invalidation area gives way. Targets run to 7,766 (SPX 7,759), Thursday's session high with the computed target at 7,764.17, then 7,794 (SPX 7,787), the pairing of first pivot resistance and one standard deviation resistance, then an extended 7,809 (SPX 7,800) at the primary upside gamma boundary, reachable only if momentum extends through the second target on expanding volume, for roughly one-to-1.1, one-to-1.9 and one-to-2.3 reward-to-risk. Half size is deliberate: August nonfarm payrolls print at 8:30 AM ET, one hour before the cash open, with consensus at 55,000 against a prior negative 23,000, and Friday carries the largest near-dated delta expiry. Two developments override the level map in real time. A payrolls figure far from the 55,000 consensus in either direction, plausible given the prior contraction, revives growth concern and overrides the positioning-based support case. A strong beat alongside average hourly earnings above the 0.3 percent estimate would restore rate-increase pricing and pressure the long even on a growth-positive headline. A sustained session beneath 7,688.50 flips the structure and exposes the volatility inflection level near 7,684.5 (SPX 7,675) then the gamma flip at 7,631.5. Our published record lays out how we grade these calls.
Thursday repriced rates lower and closed the E-mini above every major moving average at 88.8 percent of its range, pinned to the 38.2 percent retracement shelf. The contract is boxed between a confluence band at 7,720 to 7,730 and an overhead ceiling that runs from Thursday's 7,766.50 high to the 7,809.5 gamma boundary, with positive dealer positioning dampening realized movement and payrolls the print that resolves the tension. The 7,720 to 7,730 band is where a pullback is bought, the 7,766 to 7,794 shelf is the first objective, and a decisive break of the 7,838.50 contract high is what would turn the repair into a trend.
A close above every major average in a weak-trend market is a pullback to buy, not a level to chase. The edge is the 7,720 to 7,730 (SPX 7,713 to 7,723) confluence band, and the failure is a sustained session beneath 7,688.50 or a payrolls figure far from the 55,000 consensus at 8:30 AM ET.
This is the read our members get every session, before the bell, with the levels drawn and the setup defined. See how the same dealer-positioning work turns into systematic signals.
View pricingThe complete data picture
Every number behind Friday’s plan, charted first; the full numeric reference follows underneath.
Full numeric reference, every remaining figure from the review
| Average | Value | Settle vs |
|---|---|---|
| 5-day | 7,699.00 | below spot by 55.75, still beneath the 20-day, the residue of the early-week decline the advance has begun to repair |
| 20-day | 7,727.84 | below spot by 26.91, reclaimed on Thursday after capping price through the early week |
| 50-day | 7,616.48 | below spot by 138.27, the line that keeps the intermediate uptrend intact |
| 100-day | 7,522.99 | below spot by 231.76 |
| 200-day | 7,229.68 | below spot by 525.07 |
| Level | Reference |
|---|---|
| 8,010 | primary gamma concentration strike, cash 8,000 |
| 7,899 | third pivot resistance 7,899.00, cash 7,892 |
| 7,838.50 | August 13 contract high and 52-week high, cash 7,831 |
| 7,832.75 | second pivot resistance with the three standard deviation band 7,828.78, cash 7,826 |
| 7,809.50 | target 3, the primary upside gamma boundary, cash 7,800 |
| 7,793.75 | target 2, first pivot resistance with one standard deviation resistance 7,797.49, cash 7,787 |
| 7,782 | momentum-stall band 7,781.64 to 7,783.30, cash 7,775 |
| 7,766.50 | target 1, Thursday's session high with the computed target 7,764.17, cash 7,759 |
| 7,754.75 | September settle, pinned to the 38.2 percent retracement 7,754.46 |
| 7,747.50 | top of the retracement shelf, the 18-day average stall, cash 7,740 |
| 7,730 to 7,720 | the confluence band and entry, the 50 percent retracement 7,728.50, the pivot 7,727.50 and the 18-day average crossing 7,720.75, cash 7,721 to 7,714 |
| 7,712 | one standard deviation support 7,712.01, cash 7,705 |
| 7,702 | 9-day average crossing 7,702.44 with the 38.2 percent retracement from the four-week low 7,702.54, cash 7,695 |
| 7,694 | two standard deviation support 7,694.30, cash 7,687 |
| 7,688.50 | stop reference, first pivot support, cash 7,681 |
| 7,684.50 | volatility inflection level, cash 7,675 |
| 7,676.50 | Wednesday's close with the three standard deviation support 7,680.72, cash 7,669 |
| 7,641 | 40-day average crossing 7,640.99, cash 7,634 |
| 7,631.50 | dealer gamma flip level, cash 7,622 |
| 7,618.50 | one-month low and the week's low, cash 7,611 |
| 7,583.25 | third pivot support, cash 7,576 |
| 7,510 | primary downside gamma boundary, cash 7,500 |
| Metric | Reading |
|---|---|
| Call gamma / put gamma | call gamma 5.69 billion against put gamma negative 1.42 billion, a net positive 4.27 billion, cash index |
| Index gamma and notional | gamma tilt reads a positive 1.06 on the cash index and market-maker gamma notional a positive 189.913 million dollars, while the primary tracking fund reads negative 914.486 million, the Nasdaq tracking fund negative 581.859 million and the small-cap fund negative 1.369 billion, so positive positioning concentrates in the index itself |
| Positioning versus the flip | the 7,754.75 settle sits 123.25 points above the dealer gamma flip at ES 7,631.5, a positive arrangement in which hedging works against movement, selling strength and buying weakness |
| Real-time hedging flow | index-level flow finished negative 3.5 billion dollars of delta, driven by zero-day call selling ahead of the long weekend, while single-stock flow ran positive 5.4 billion from longer-dated call buying, 3.2 billion of it mega-cap |
| Volatility inflection and gamma flip | cash 7,675 (ES 7,684.5) and cash 7,622 (ES 7,631.5), the two modeled thresholds beneath the market |
| Concentration strike, call ceiling, put base | cash 8,000 (ES 8,009.5), cash 7,800 (ES 7,809.5) 54.75 points overhead, cash 7,500 (ES 7,509.5) 245.25 points below |
| A dampening episode | a 15,000-lot zero-day dealer long call spread at cash 7,750 by 7,775 created heavy positive gamma, and near 11:00 AM ET and 2:00 PM ET the index pinned to that band, the 7,750 strike registering 99th-percentile positive gamma, though a Thursday zero-day structure supplies no Friday gamma of its own |
| Largest expiries | the largest expiry by gamma is December 18 and the largest by delta is Friday September 4 itself, stacking near-dated directional exposure on the payrolls session |
| Put-to-call | call volume 579,812 against put volume 702,273 for a 1.21 volume ratio, with call open interest 9.798 million against put open interest 13.909 million for a 1.42 ratio |
| 25-delta risk reversal and surface | the 25-delta risk reversal at negative 0.043, a mild put skew, with implied-volatility rank 16.02 percent, the volatility forecast rank 13.34 percent and skew rank 37.70 percent, cheap absolute volatility with muted demand for protection |
| Cohort | Weekly change |
|---|---|
| Asset managers and dealers | asset managers net long by 953,228 contracts as of August 25, holding 1,166,084 long against 212,856 short, with dealers and intermediaries carrying the offsetting net short of 761,036, the standard structural arrangement |
| Leveraged funds and non-commercials | leveraged funds net short by 315,204, having cut 15,765 longs and added 18,037 shorts, and non-commercials cutting 33,820 longs while adding 23,614 shorts, fast money adding downside exposure into the week that produced the low, with September open interest at 1,973,750 and 15 days to the September 18 expiration |
| Input | |
|---|---|
| Fed policy | Governor Waller at 8:30 AM ET said recent data finally show signs of disinflation and that he would support holding rates steady if the August inflation report shows continued progress, cutting market-implied odds of a September increase by roughly 13 percentage points to about 50 percent, with two more speakers, Hammack at 3:00 PM ET and Goolsbee at 3:55 PM ET, leaving the setup undisturbed |
| Dollar and rates | the 10-year yield eased around 2 basis points to near 4.77 percent and the dollar index fell 0.58 percent to 99.001, its weakest since May, the dovish repricing that drove the session |
| Volatility | the volatility index fell 5.79 percent to 14.31 with the volatility-of-volatility measure at 83.80, and with 30-day implied volatility 12.83 percent against realized 7.35 percent and a 16.02 percent rank, further compression has limited room to fuel an additional bid |
| Large-cap leadership | the mega-cap complex gained roughly 2 percent and software roughly 3 percent while semiconductors added only 0.2 percent and trailed the 1.06 percent index gain, a rates-driven advance rather than a growth-driven one, with Tesla up 5 percent on a product launch and Snowflake up 17 percent on earnings |
| Breadth | NYSE net advancers finished at 615 and net advancing volume at 1.48 billion shares, the arms index at 0.840 beneath the neutral line and the closing cumulative tick at 21, an orderly advance rather than a buying climax, all readings passing the freshness guard before use |
| Cross-asset | equities higher, the dollar lower, yields lower, volatility sharply lower and bitcoin up 4.95 percent to 81,132.87 describe a single coherent easing of financial conditions, with gold at 4,521.2 and crude at 91.78 |
| Geopolitics | the Iran situation stayed active, with the average US diesel price setting a record 5.820 dollars per gallon, a live input into the inflation prints that now determine the September decision, while the energy sector fell 0.74 percent to 64.62 even as crude held near 91.78 |
| Institutional cash | US money market fund assets reached a record 7.98 trillion dollars, a hold leaving those yields lower than a rate increase would have produced, a marginal narrowing of the advantage of holding cash over risk assets rather than a forcing mechanism |
| When | Event |
|---|---|
| Fri Sep 4 | the August employment report at 8:30 AM ET, nonfarm payrolls consensus 55 thousand after a negative 23 thousand prior with unemployment holding at 4.1 percent, the week's defining event and the largest delta expiry in the options structure, followed by the Canadian Ivey index at 10:00 AM ET |
| Mon Sep 7 | Labor Day, with US cash equity markets closed while index futures trade an abbreviated session that halts at 1:00 PM ET before reopening at 6:00 PM ET under the Tuesday September 8 trade date |
| Sep 8 to 11 | a Treasury auction sequence on September 8 and 9, the ECB rate decision and US producer prices on September 10 and the August consumer price report on September 11, the release Waller identified as decisive for the meeting |
| Sep 16 to 18 | the policy statement and updated projections on September 16 and the September contract expiry alongside monthly options expiration on September 18 |
The economic releases referenced above are published on the official government calendars below. Price levels are derived from standard technical and statistical methods, and the market read is AlgoIndex's own analysis. How we grade these calls is set out in our performance methodology.
- US Bureau of Economic Analysis, Personal Income and Outlays (PCE)
- US Bureau of Economic Analysis, Gross Domestic Product
- US Bureau of Economic Analysis, release schedule
- US Census Bureau, Advance Durable Goods (M3) release schedule
- US Energy Information Administration, Weekly Petroleum Status Report
- US Department of the Treasury, auction schedule and results
- AlgoIndex performance methodology



