
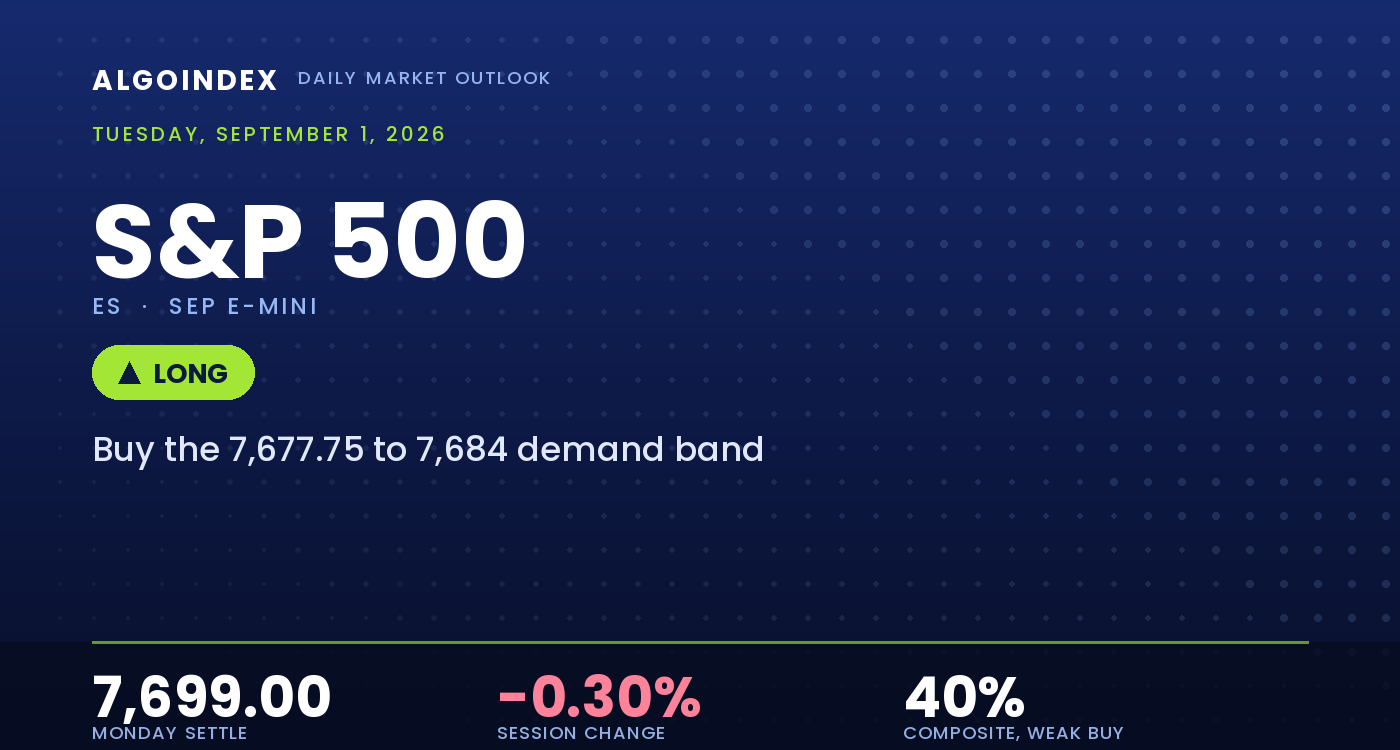
The September E-mini settled Monday regular trade at 7,699.00 (SPX 7,686), lower by 23.00 points or 0.298 percent from Friday's 7,722.00, inside a full electronic band of 7,674.75 to 7,724.00. The session had one dominant driver and it was not domestic. The United States and Iran exchanged military strikes for the first time in roughly a month, crude rose more than two percent, and the ten-year yield printed 4.77 percent intraday, its highest since January 2025, closing at 4.76 percent. Equities absorbed that in a strikingly uneven way. The industrial average fell 0.698 percent and closed near its low, the broad index fell 0.332 percent, and the technology-heavy index actually finished higher by 0.080 percent. This was not a uniform risk-reduction session but a rotation, with rate-sensitive and cyclically exposed names carrying the damage while large-cap technology absorbed a concentrated bid.
The contradiction heading into Tuesday sits in the positioning data. Index-level dealer positioning remains net stabilizing, with the cash index closing 19.14 points, or 0.249 percent, above its 7,667 dealer gamma flip level, a thin cushion. Monday's cash low of 7,665.06 traded 1.94 points beneath that flip and was rejected; in the futures domain the 7,674.75 low traded 3.00 points beneath the corresponding 7,677.75 and was likewise rejected. Both domains agree the flip was tested and held. Against that stabilizing backdrop the volatility surface is pricing an expanded Tuesday: the implied one-day band is 92.23 points wide, 1.33 times the fourteen-day average true range of 69.50 and 1.62 times the fourteen-day average daily range of 57.04. Options are paying for a larger day than the market has recently delivered, and the reason is the 10:00 AM ET data block.
A rotation held above a thin gamma flip
The constructive read starts with location. The 7,699.00 settlement holds 95.85 points above the 50-day average at 7,603.15 and 481.20 points above the 200-day at 7,217.80, and that longer sequence remains ordered for an uptrend, everything from fifty days out supportive and comfortably so. Index-level dealer positioning is net long gamma, with gamma notional positive at 502.475 million dollars and a tilt of 1.143, a mean-reverting condition in which dealers sell strength and buy weakness rather than feed a trend. That is the mechanical basis for expecting Monday's shelf at 7,674.75 to 7,677.75, tested and rejected in both the futures and cash domains within the session, to be defended again on a first test. First tests of a defended shelf in a positive positioning environment carry a favorable outcome distribution, and the flip itself carries the highest conviction on the board at a score of 92.
The qualifier is that the front end is resistive and the trend is weak. Everything inside twenty days caps price: the five-day average at 7,709.10 sits about ten points overhead as the nearest mechanical hurdle, and the twenty-day at 7,736.63 sits 37.63 points above a settle that has now spent several sessions beneath it without a decisive reclaim. Trend strength is genuinely absent, with the fourteen-day directional index at 14.31 and the positive and negative directional indicators less than one point apart at 20.39 and 19.46, so moves revert rather than extend. The stabilizing reading also exists only at the index level; every tracked fund surface is destabilizing, from the broad-index fund at negative 405.851 million dollars to the small-cap fund at negative 1.289 billion, so the cushion is concentrated where the largest notional sits and is absent in the vehicles tactical participants actually trade.
The 7,678 shelf and the 7,721 band frame Tuesday
Two zones define the session and they sit about 43 points apart. Below, the 7,674.75 to 7,677.75 (SPX 7,664 to 7,667) shelf is the most important support on the board, pairing Monday's verified electronic-session low with the dealer gamma flip; a sustained loss of it exposes the 7,667.05 two standard deviation band and then the 7,660.75 (SPX 7,650) risk inflection that has divided constructive from defensive conditions since August 20. Above, the 7,720.75 to 7,724.00 (SPX 7,710 to 7,713) band pairs the volatility inflection level with Monday's electronic-session high, which traded 3.25 points through the inflection level and failed, the cleanest rejection signature the session produced, and it carries a conviction score of 88. Between them the pivot at 7,699.25 is the fulcrum, and price is sitting on it, which is the definition of an undecided market. The volatility surface carries the session's sharpest contradiction: implied-volatility rank near the bottom of its year at 5.75 percent while skew rank sits near the top at 90.51 percent, options cheap overall while downside protection specifically stays bid.
Buy the defended shelf, respect the inflection band, size it down
The plan buys the defended 7,677.75 to 7,684.00 (SPX 7,667 to 7,673) shelf that held rather than chase strength into the 7,720.75 band. That shelf combines Monday's verified electronic-session low at 7,674.75 with the dealer gamma flip at 7,677.75, two independent references arriving at nearly the same price, so it is a defended level rather than an arbitrary line. The stop is 7,665.50 (SPX 7,655), placed beneath both the 7,674.75 low and the 7,667.05 two standard deviation band, about 15.5 points from the 7,681 entry midpoint, so the position exits only after the shelf has genuinely failed rather than merely been probed. Targets run to the 7,699.25 pivot and Monday settle area, then the 7,720.75 (SPX 7,710) inflection level at the top of the mean-reversion corridor, then 7,730.75 (SPX 7,720) first mapped resistance only if the inflection band is cleared on expanding volume, for roughly one-to-1.18, one-to-2.56, and one-to-3.21 reward-to-risk. Half size is deliberate: four releases land together at 10:00 AM ET, thirty minutes after the cash open, so the setup stands down across the 9:55 AM ET to 10:15 AM ET data reaction and re-arms only after that window closes with the shelf intact. Two developments override the level map in real time. A manufacturing prices-paid print materially above the 70.5 consensus converts the hawkish policy thesis from a risk into a confirmed path and pressures the futures through the shelf; an overnight headline indicating disruption to Strait of Hormuz transit converts the energy story from an inflation problem into a growth problem, at which point Monday's index dispersion collapses and the indices fall together. Either voids the long regardless of price. The higher-conviction alternate is a short on rejection in the 7,720.75 to 7,724.00 band, stop 7,733.00, with objectives at 7,699.25, 7,677.75, and 7,660.75. Our published record lays out how we grade these calls.
Monday repriced energy and rates without breaking the trend. The E-mini bounded itself, on both sides, by the two levels the positioning surface publishes as the environment's edges, and settled back on the pivot. The 7,674.75 to 7,677.75 shelf is where the cushion works or fails, the 7,720.75 to 7,724.00 band is where recoveries are sold, and a sustained loss of 7,674.75 with the cash index beneath 7,667 turns a mean-reverting market into an amplifying one.
A defended flip in a net-long-gamma environment is a shelf to buy, not a level to abandon. The edge is the 7,677.75 to 7,684.00 (SPX 7,667 to 7,673) shelf, and the failure is a sustained futures close beneath 7,674.75 with the cash index beneath its 7,667 flip.
This is the read our members get every session, before the bell, with the levels drawn and the setup defined. See how the same dealer-positioning work turns into systematic signals.
View pricingThe complete data picture
Every number behind Tuesday’s plan, charted first; the full numeric reference follows underneath.
Full numeric reference, every remaining figure from the review
| Average | Value | Settle vs |
|---|---|---|
| 5-day | 7,709.10 | below by 10.10, the nearest mechanical hurdle a recovery must clear |
| 20-day | 7,736.63 | below by 37.63, the reference lost through the correction |
| 50-day | 7,603.15 | above by 95.85 |
| 100-day | 7,500.25 | above by 198.75 |
| 200-day | 7,217.80 | above by 481.20 |
| Level | Reference |
|---|---|
| 8,010.75 | absolute gamma concentration strike, cash 8,000 |
| 7,810.75 | primary call-side ceiling, cash 7,800 |
| 7,782.50 | Friday session and five-day high, cash 7,772 |
| 7,760.75 | second mapped resistance, cash 7,750 |
| 7,738.13 | three standard deviation upper band, cash 7,727 |
| 7,730.75 | first mapped resistance, cash 7,720, target 3 |
| 7,724.00 | Monday electronic-session high, cash 7,713 |
| 7,720.75 | volatility inflection level, cash 7,710, target 2 |
| 7,709.10 | five-day average, cash 7,698, nearest overhead hurdle |
| 7,699.25 | computed pivot point, cash 7,689, target 1 |
| 7,699.00 | September settle |
| 7,690.63 | 50 percent retracement of the four-week range, cash 7,680 |
| 7,684.00 to 7,677.75 | the buy shelf and entry zone, cash 7,673 to 7,667 |
| 7,677.75 | dealer gamma flip level, cash 7,667, highest conviction on the board |
| 7,674.75 | Monday electronic-session low, cash 7,664, the proven shelf |
| 7,667.05 | two standard deviation lower band, cash 7,656 |
| 7,665.50 | stop, beneath the shelf and the two SD band |
| 7,660.75 | risk inflection and mapped support, cash 7,650 |
| 7,650.00 | second pivot support, cash 7,639 |
| 7,625.25 | third pivot support, cash 7,615 |
| 7,610.75 | deeper mapped support base, cash 7,600 |
| 7,510.75 | primary put-side support base, cash 7,500 |
| Metric | Reading |
|---|---|
| Call gamma / put gamma | call gamma 6.43 billion against put gamma 343.72 million, a ratio of 18.71 to one, cash index |
| Index gamma tilt and notional | tilt 1.143, gamma notional positive 502.475 million with a positioning index of 1.927, net positive and stabilizing |
| Product-level positioning | every tracked fund is destabilizing while the index stabilizes: broad-index fund negative 405.851 million, technology fund negative 140.221 million, small-cap index negative 135.101 million, small-cap fund negative 1.289 billion |
| Real-time hedging flow | positive 1.5 billion net delta on the day, driven by zero-day call buying that does not carry into Tuesday, while the notable longer-dated structures were uniformly defensive |
| Single-stock concentration | aggregate single-stock delta positive about 2.8 billion, roughly 2.6 billion from one name at 92.86 percent of the complex, the rest of the index near 0.2 billion combined |
| Volatility inflection and gamma flip | cash 7,710 (ES 7,720.75) and cash 7,667 (ES 7,677.75), the flip 19.14 points beneath the cash close |
| Concentration strike, call ceiling, put base | cash 8,000 (ES 8,010.75), cash 7,800 (ES 7,810.75), cash 7,500 (ES 7,510.75) |
| Put-to-call | open interest 1.33, put volume 970.88 thousand over call volume 698.39 thousand for a 1.39 volume ratio, the day more defensive than the standing book |
| 25-delta risk reversal | negative 0.034, confirming the downside skew, cash index |
| Volatility surface | one-month implied 11.24 percent over realized 10.56 percent for a 1.064 ratio, implied-vol rank 5.75 percent, skew rank 90.51 percent |
| Cohort | Weekly change |
|---|---|
| Commercial participants | long 1,493,154 contracts against 1,557,219 short in the week ended Aug 25, the long side adding 10,285 and the short side cutting 39,203 |
| Non-commercial longs | fell 33,820 to 241,495, with September contract open interest at 1,991,516 |
| Input | |
|---|---|
| Fed policy | the chair told the Jackson Hole audience that inflation remains the problem and rate increases are the tool, and on August 28 said summer data was better while underlying trends had not improved; commentary read the symposium as raising, not lowering, September hike odds |
| Dollar and rates | the 10-year yield opened 4.73 percent, traded to 4.77 percent and closed 4.76 percent, up four basis points to its highest since January 2025, driven by the inflation read-through from crude rather than domestic data |
| Geopolitics | the United States and Iran exchanged military strikes for the first time in about a month, crude rose more than two percent with the international benchmark briefly back above ninety dollars, and the President struck a de-escalatory tone while declining to say what comes next |
| Index dispersion | the industrial average fell 0.698 percent and closed near its low, the broad index fell 0.332 percent, and the technology index rose 0.080 percent, a 0.778 percentage-point spread that identifies rotation rather than liquidation |
| Large-cap leadership | Tesla drove roughly 2.6 billion of the 2.8 billion single-stock delta on longer-dated call buying ahead of a Thursday product launch, breaking above its 350 gamma flip into amplifying dealer positioning as a September 400 call rose 167 percent |
| Breadth | direct market internals were not captured this run and none are quoted; the read is built from index dispersion, cyclicals and rate-sensitive names sold while longer-duration technology was spared |
| Volatility | the volatility index closed 14.92 up 3.40 percent yet at 9.68 percent of its range near the low, volatility-of-volatility roughly unchanged at 86.29, protection added into the headline then released |
| Positioning tension | the 43-point corridor between the 7,677.75 flip and the 7,720.75 inflection level is narrower than the 92.23-point band options price for Tuesday; either the implied move is rich and Tuesday rotates inside, or the corridor breaks and the cushion stops applying |
| When | Event |
|---|---|
| Tue Sep 1 | the 10:00 AM ET manufacturing prices-paid component is the single first-order event, inside a four-release block that also carries job openings and the headline manufacturing survey |
| Wed Sep 2 | employment change data at 8:15 AM ET with consensus at 47 thousand, alongside a Canadian rate decision |
| Thu Sep 3 | services activity and jobless claims, with a central bank official at 8:30 AM ET and another at 3:00 PM ET |
| Fri Sep 4 | the payrolls report at 8:30 AM ET with consensus at 55 thousand against a prior of negative 23 thousand and unemployment unchanged at 4.1 percent, the week's dominant number |
| Sep 16 to 18 | the September 16 policy meeting carries an updated projection summary, with the September 18 quarterly expiration two days after |
The economic releases referenced above are published on the official government calendars below. Price levels are derived from standard technical and statistical methods, and the market read is AlgoIndex's own analysis. How we grade these calls is set out in our performance methodology.
- US Bureau of Economic Analysis, Personal Income and Outlays (PCE)
- US Bureau of Economic Analysis, Gross Domestic Product
- US Bureau of Economic Analysis, release schedule
- US Census Bureau, Advance Durable Goods (M3) release schedule
- US Energy Information Administration, Weekly Petroleum Status Report
- US Department of the Treasury, auction schedule and results
- AlgoIndex performance methodology



