
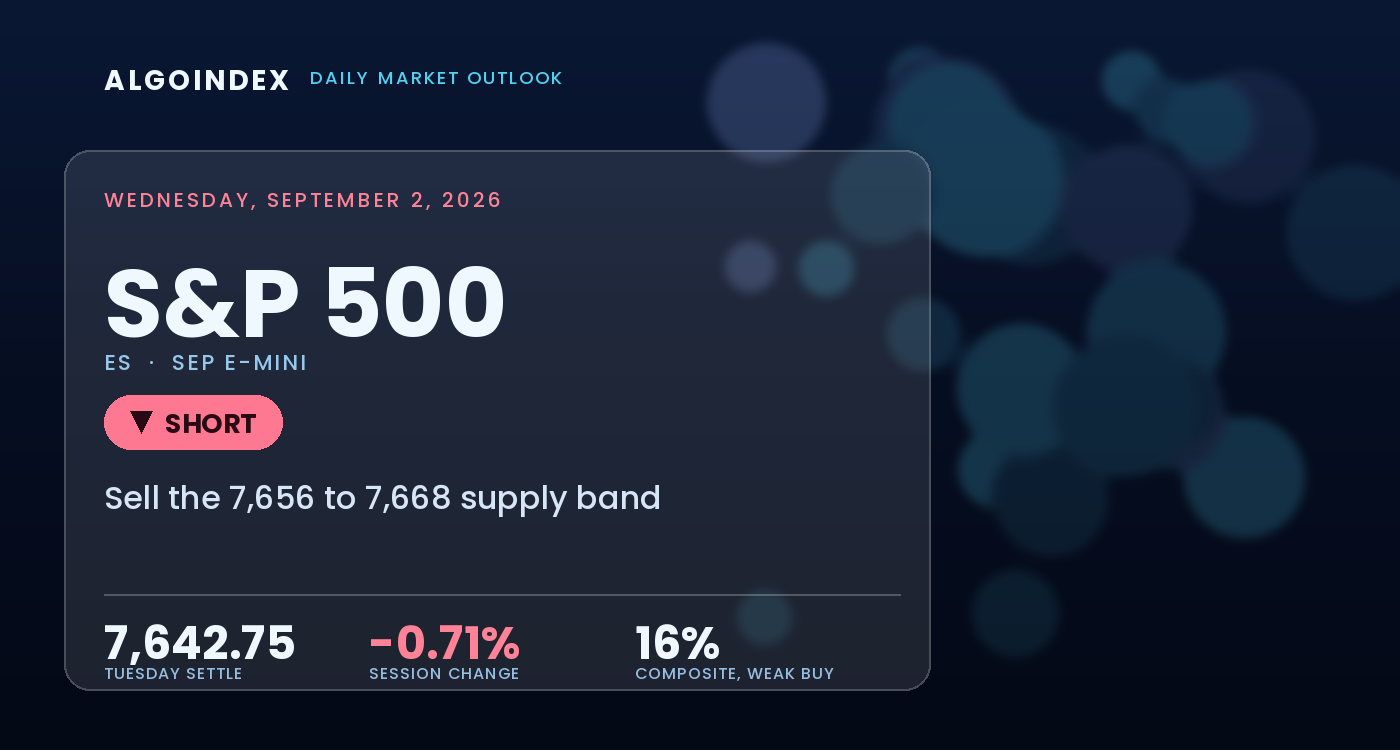
The September E-mini settled Tuesday at 7,642.75 (SPX 7,631), with the cash index down 54.67 points or 0.71 percent from the prior 7,686.14 close, finishing in the lower portion of a contained session range. The move was not a function of domestic data. It was a function of an escalating military exchange between the United States and Iran that ran through the New York afternoon and dragged crude, bonds and equities in the same direction at once. The international crude benchmark settled 94.65 dollars, up 4.6 percent, the ten-year yield rose to 4.802 percent, and the dollar index firmed to 99.747. A simultaneous rise in the dollar, yields and oil against falling equities is the signature of an inflation repricing rather than a growth scare, and it removes the usual bond hedge from a long equity book.
The internal composition of the decline matters more than its size. The volatility index closed 16.33, up 9.38 percent, its highest close in a month and at its session high with the second derivative also at its high. Breadth was decisively negative, the advance-decline line finishing at negative 1,028. Yet the cash range spanned only about 68 basis points, roughly 52 index points, so this was a wide volatility repricing inside a narrow realized range, a market that repriced risk without yet repricing price. The structural contradiction into Wednesday is clean: index-level positioning remains net long gamma, with call gamma of 6.18 billion against put gamma of negative 697.7 million, which mechanically damps follow-through, while the close landed beneath the 7,650 (SPX 7,639) primary directional pivot and beneath the 7,651.57 (SPX 7,641) dealer gamma flip with negative breadth and rolled-over short-term averages.
A repricing of rates and oil beneath a lost pivot
The bearish read starts with location. Cash closed 18.53 points beneath the 7,650 primary directional pivot that has carried since August 20 and 9.53 points beneath the 7,641 dealer gamma flip, which mechanically places dealers in the destabilizing half of their hedging profile and argues for wider ranges than the low historic volatility readings would otherwise suggest. The short-term average stack has rolled over: the five-day at 7,688.10 sits 45.35 points overhead and the twenty-day at 7,724.73, support through most of August, now stands 81.98 points above the settle as resistance. The directional index reads 13.83 on the fourteen-day with the negative indicator above the positive at 22.66 against 18.23, a trendless structure tilted lower. The plan sells a rally into that overlapping pivot band rather than chasing weakness beneath a level that already broke.
The qualifier is the positioning cushion. Net gamma remains positive at the index level, with gamma tilt at 1.077 and market-maker gamma notional positive at 295.481 million dollars, a mean-reverting condition that biases the session toward concentrated strikes and damps directional continuation. That is why a straight momentum short is the wrong expression and a fade of strength is the right one. The split within positioning is the tell: the index surface is long gamma while the exchange-traded fund surface runs short, with tilt 0.788 and gamma notional negative 497.954 million, which is precisely why intraday reversals have been sharp while the closing range has stayed narrow. The one condition that would quiet Wednesday is a reclaim and hold of 7,641 cash, the flip the market spent the close on the wrong side of.
The 7,662 pivot band and the 7,607 demand shelf frame Wednesday
Two zones define the session. Above, the 7,656 to 7,668 (SPX 7,645 to 7,657) band overlaps the computed pivot at 7,657.42 and the positioning pivot at 7,660.57 and is where a bounce is expected to stall; immediately above it the first genuine supply band runs 7,689.29 to 7,693.33 (SPX 7,679 to 7,683), pairing the one standard deviation resistance with the computed first resistance. Below, the first high-quality magnet is 7,627.57 (SPX 7,617), the cash options confluence carrying a 95.29 conviction score, and beneath it the demand band runs 7,606.83 to 7,612.57 (SPX 7,596 to 7,602), reinforced by the 50-day average at 7,609.11 and a 95.71 conviction score. The session low at 7,621.50 (SPX 7,611) held on its first test on the 7,621 to 7,622 crossover shelf. The volatility surface carries the sharpest contradiction: implied-volatility rank near the bottom of its year at 8.75 percent while skew rank sits elevated at 78.09 percent, options cheap overall while downside protection specifically stays bid.
Sell the rally into the pivot band, respect the demand shelf, size it down
The plan sells strength into the 7,656 to 7,668 (SPX 7,645 to 7,657) band where the computed pivot at 7,657.42 and the positioning pivot at 7,660.57 overlap, rather than chasing weakness beneath a pivot that already broke. The stop is 7,694 (SPX 7,683), above both the 7,689.29 one standard deviation resistance and the 7,693.33 computed first resistance, about 32 points from the 7,662 entry midpoint, so the position exits only after acceptance back inside the first supply band. Targets run to 7,628 (SPX 7,617), the cash options confluence at a 95.29 conviction score, then 7,607 (SPX 7,596), the computed first support reinforced by the 7,602 confluence and the 50-day average at 7,609.11, then an extended 7,559 (SPX 7,548) at a 96.79 conviction score only if momentum extends through the second target on expanding volume, for roughly one-to-1.1, one-to-1.7 and one-to-3.2 reward-to-risk. Half size is deliberate: the 8:15 AM ET employment change survey, the 9:45 AM ET Bank of Canada decision and the 10:30 AM ET energy inventory report all land inside the session, so the setup stands down across the 8:10 AM to 8:25 AM ET survey reaction and again across the 10:25 AM to 10:40 AM ET inventory reaction. Two developments override the level map in real time. Any credible de-escalation or ceasefire headline out of the Gulf would collapse the crude premium and reverse the entire rates-and-inflation channel driving this setup, lifting equities regardless of the positioning map. In the opposite direction, a confirming inventory draw combined with further escalation would accelerate the move and argue for holding through the second target rather than scaling out. A reclaim of 7,660.57 that holds for a full hour without rejection weakens the thesis before the stop is reached and is grounds for reducing rather than waiting. Our published record lays out how we grade these calls.
Tuesday repriced energy and rates and closed the market beneath both its directional pivot and its dealer gamma flip. The E-mini is boxed between a pivot band that caps strength and a demand shelf that held on a first test, with net-long index gamma damping continuation while a short-gamma fund surface keeps reversals sharp. The 7,656 to 7,668 band is where a rally is sold, the 7,606.83 to 7,612.57 shelf is where a decline should first stall, and a reclaim of 7,641 cash held for an hour is the single condition that quiets the session.
A close beneath both the directional pivot and the dealer gamma flip in a weak-trend market is a rally to sell, not a level to chase. The edge is the 7,656 to 7,668 (SPX 7,645 to 7,657) pivot band, and the failure is sustained acceptance above 7,694 or a reclaim of 7,641 cash held for a full hour.
This is the read our members get every session, before the bell, with the levels drawn and the setup defined. See how the same dealer-positioning work turns into systematic signals.
View pricingThe complete data picture
Every number behind Wednesday’s plan, charted first; the full numeric reference follows underneath.
Full numeric reference, every remaining figure from the review
| Average | Value | Settle vs |
|---|---|---|
| 5-day | 7,688.10 | below by 45.35, the nearest mechanical hurdle a recovery must clear |
| 20-day | 7,724.73 | below by 81.98, the reference that flipped from support to resistance |
| 50-day | 7,609.11 | above by 33.64, the line that decides the intact-uptrend argument |
| 100-day | 7,514.78 | above by 127.97 |
| 200-day | 7,224.97 | above by 417.78 |
| Level | Reference |
|---|---|
| 8,010.57 | primary gamma concentration strike, cash 8,000 |
| 7,838.50 | 52-week high and structural ceiling, cash 7,828 |
| 7,810.57 | primary call-side ceiling, cash 7,800 |
| 7,779.83 | computed third resistance, cash 7,769 |
| 7,743.92 | computed second resistance, cash 7,733 |
| 7,724.73 | 20-day average inside the 7,723 to 7,726 confluence, cash 7,714 |
| 7,710.57 | volatility inflection level, cash 7,700 |
| 7,694.00 | stop, above the first supply band |
| 7,693.33 | computed first resistance, top of the first supply band, cash 7,683 |
| 7,689.29 | one standard deviation resistance, base of the supply band, cash 7,679 |
| 7,673.75 | September 1 session high, cash 7,663 |
| 7,668.00 to 7,656.00 | the sell zone and entry band, cash 7,657 to 7,645 |
| 7,660.57 | positioning pivot, cash 7,650 |
| 7,657.42 | computed pivot, cash 7,647 |
| 7,651.57 | dealer gamma flip level, cash 7,641, closed beneath |
| 7,642.75 | September settle |
| 7,632.25 | overnight low, cash 7,622 |
| 7,627.57 | first options confluence and target 1, cash 7,617 |
| 7,621.50 | September 1 session low and 3x10 crossover shelf, cash 7,611 |
| 7,612.57 | cash 7,602 options confluence near the demand band |
| 7,609.11 | 50-day average inside the demand band, cash 7,599 |
| 7,606.83 | computed first support and target 2, cash 7,596 |
| 7,596.21 | one standard deviation support, cash 7,586 |
| 7,558.57 | cash 7,548 options confluence and target 3, cash 7,548 |
| 7,510.57 | primary put-side support base, cash 7,500 |
| Metric | Reading |
|---|---|
| Call gamma / put gamma | call gamma 6.18 billion against put gamma negative 697.7 million, cash index, net positive |
| Index gamma tilt and notional | tilt 1.077 with market-maker gamma notional positive 295.481 million, index-level positioning long and mean-reverting |
| Product-level positioning | the exchange-traded fund surface is short gamma, tilt 0.788 and gamma notional negative 497.954 million, opposite the long index surface, which explains sharp intraday reversals inside a narrow closing range |
| Real-time hedging flow | negative 10 billion net delta on the day, driven by longer-dated put buying and diverging from zero-dated activity, consistent with hedges established ahead of Friday's payroll release |
| Volatility inflection and gamma flip | cash 7,700 (ES 7,710.57) and cash 7,641 (ES 7,651.57), the flip 9.53 points above the cash close |
| Concentration strike, call ceiling, put base | cash 8,000 (ES 8,010.57), cash 7,800 (ES 7,810.57), cash 7,500 (ES 7,510.57) |
| Put-to-call | open interest 1.41 from 13.47 million puts over 9.572 million calls, put volume 801.51 thousand over call volume 635.77 thousand for a 1.26 volume ratio; the positioning platform's published 1.32 open-interest ratio does not reconcile and is computed on a different option universe |
| 25-delta risk reversal | negative 0.038, confirming the downside skew, cash index |
| Volatility surface | one-month implied 11.70 percent over realized 9.45 percent, implied-volatility rank 8.75 percent, skew rank 78.09 percent, cheap absolute volatility with expensive relative downside protection |
| Best-performing positions | an approximately 10,000-lot November 530 semiconductor put gained 19 percent and an approximately 5,000-lot September 7,550 index put gained 53 percent, the day's strongest flagged structures |
| Cohort | Weekly change |
|---|---|
| Index-level dealer gamma | call gamma 6.18 billion against put gamma negative 697.7 million with tilt 1.077, net long and stabilizing at the index level while every tracked fund surface runs short gamma |
| Aggregate hedging flow | negative 10 billion of delta on the day driven by longer-dated put buying, downside hedges established ahead of Friday's payroll release rather than intraday trading |
| Input | |
|---|---|
| Fed policy | Jackson Hole commentary was read as signalling unfinished policy work, one bank note observes a December rate increase is now fully priced, the August 26 headline consumption price index printed 3.7 percent against a 3.6 percent forecast and a policymaker warned August 28 that better summer inflation should not be read as improved underlying trends |
| Dollar and rates | the dollar index firmed to 99.747, up 0.09 percent, and the ten-year yield rose to 4.802 percent with its index up 0.80 percent, a simultaneous rise in the dollar, yields and oil against falling equities that reads as an inflation repricing rather than a growth scare |
| Geopolitics | an open and escalating United States and Iran military exchange ran through the New York afternoon from shortly after 2:00 PM ET, with a stated intent to tighten the closure of the Strait of Hormuz, an active conflict with no scheduled resolution |
| Cross-asset | the international crude benchmark settled 94.65 dollars, up 4.6 percent, with the domestic front contract up roughly 6 percent above 90 dollars, natural gas higher and European gas at its highest since 2023 |
| Precious metals anomaly | gold fell rather than rallied on the escalation, the December contract settling 4,396.4 with the exchange-traded proxy down 2.86 percent, a rising dollar and real yields overwhelming the haven bid and pointing at rates rather than fear as the driver |
| Large-cap leadership | leadership failed in the highest-multiple names, the software sector proxy down 4 percent, memory 3 percent and semiconductors 2 percent against a 0.71 percent headline decline, the Nasdaq-100 proxy underperforming the broad proxy by 57 basis points |
| Breadth | the advance-decline line closed negative 1,028, a 383 deterioration, the volume-weighted measure near negative 1.21 billion shares, the short-term trading index a mildly constructive 0.750 and the cumulative tick reading negative 3, internals verified live before use |
| Volatility | the volatility index closed 16.33 up 9.38 percent to a one-month high and at its session high, the volatility-of-volatility measure up 5 points to 91 and also at its high, a market pricing more to come |
| When | Event |
|---|---|
| Wed Sep 2 | the 8:15 AM ET employment change survey at 45 thousand against a 44 thousand prior leads, with a 9:45 AM ET Bank of Canada hold at 2.25 percent, 10:00 AM ET factory orders at positive 0.6 percent and the 10:30 AM ET energy inventory report the transmission channel through crude |
| Wed evening ET | a Chinese services survey at 9:45 PM ET forecast 50.6 against a 50.4 prior, positioning into it and Friday's payroll report keeping hedging demand elevated through the Globex reopen |
| Fri Sep 4 | the payroll report at 8:30 AM ET, forecast at 58 thousand against a negative 23 thousand prior with unemployment holding at 4.1 percent, the week's dominant number and the expiry into which volatility is being bid |
| Sep 11 to 18 | consumer price data on September 11 and the policy meeting with updated projections on September 16 frame the rest of the month, with monthly expiration on September 18 |
The economic releases referenced above are published on the official government calendars below. Price levels are derived from standard technical and statistical methods, and the market read is AlgoIndex's own analysis. How we grade these calls is set out in our performance methodology.
- US Bureau of Economic Analysis, Personal Income and Outlays (PCE)
- US Bureau of Economic Analysis, Gross Domestic Product
- US Bureau of Economic Analysis, release schedule
- US Census Bureau, Advance Durable Goods (M3) release schedule
- US Energy Information Administration, Weekly Petroleum Status Report
- US Department of the Treasury, auction schedule and results
- AlgoIndex performance methodology



