
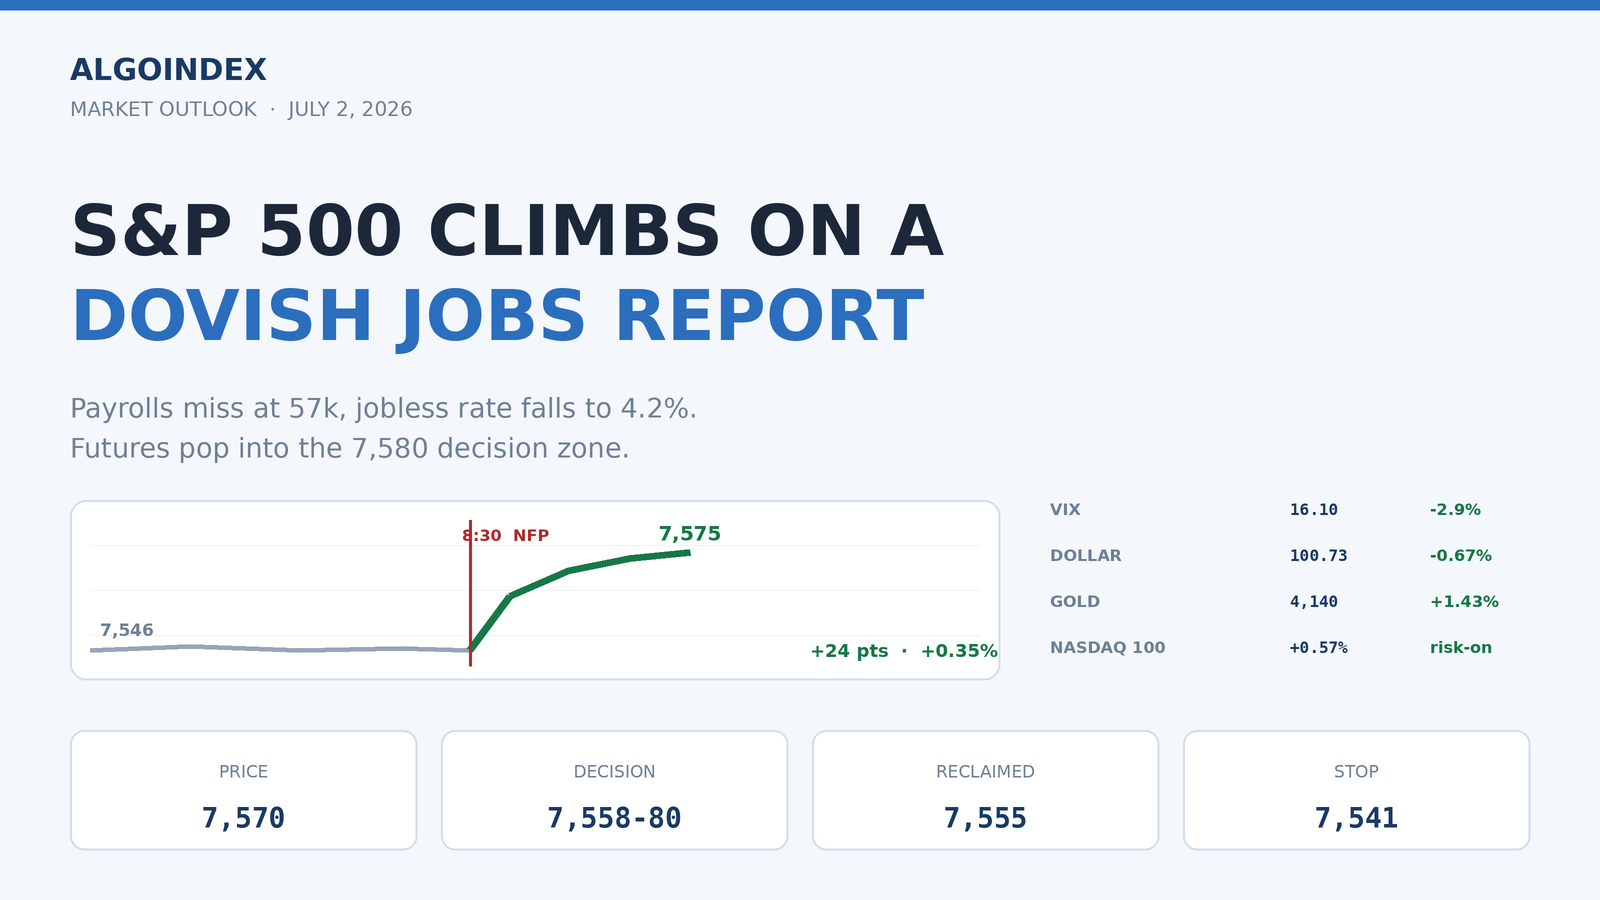
The consolidation resolved higher. For hours the S&P 500 E-mini sat pinned on its 7,543 pivot, waiting on the one print that would set the day, and at 8:30 the June employment report delivered a soft headline the market read as friendly: nonfarm payrolls rose just 57,000 against a 113,000 forecast, with the prior month revised down to 129,000 and private payrolls at only 49,000. On its own that reads weak, but the details told a gentler story. The unemployment rate ticked down to 4.2 percent from 4.3 percent, average hourly earnings were in line at plus 0.3 percent on the month, and jobless claims were benign. The net is a cooling-but-not-collapsing labor market that reinforces the case for policy easing without triggering a growth scare.
The reaction confirmed the dovish read. The E-mini rallied roughly 24 points from its pre-report level near 7,546 to a session high of 7,575.25 and traded near 7,570, up 0.35 percent, pressing directly into the 7,558 to 7,580 decision band. Cross-asset signals were cleanly risk-on: the volatility index fell to 16.10, the dollar index dropped to 100.73, gold jumped 1.43 percent to 4,140 on lower yields, and the Nasdaq 100 turned positive at plus 0.57 percent, a sign the semiconductors that dragged the market on Wednesday were stabilizing. Price has now reclaimed the index 7,500 area, roughly 7,555 on the E-mini, that carried negative same-day-expiry positioning into Wednesday's close, flipping that zone from resistance toward a potential support base. The question shifts from direction to follow-through.
Why the market liked a weak number
A 57,000 payrolls print is soft, but the composition kept it from reading as a growth scare. The jobless rate improving to 4.2 percent, contained wages at plus 0.3 percent, and benign claims at 215,000 initial together describe a labor market that is easing gradually rather than cracking. That is the mix a market positioned for policy easing wants: enough softness to keep the easing path intact, not enough deterioration to signal recession. The dollar extending its decline to 100.73 and the volatility index falling to 16.10 are the tells that the bond and options markets took it the same way.
The internal story matters as much as the macro one. Wednesday's session stalled a multi-day rally as semiconductors fell 5.4 percent and dragged the Nasdaq 100 down 1.5 percent, even as capital rotated into software. The tell today is that the Nasdaq turned positive after the data, which suggests the chip complex is steadying rather than leading a second leg lower. Structurally the market still carries net-positive dealer gamma, with call gamma near 3.1 billion against put gamma near negative 1.63 billion, but the index 7,500 zone flipped from dampening to amplifying into Wednesday's close, which is exactly why the 7,558 to 7,580 futures band matters: a sustained push above it can feed on itself, while a rejection there points back toward the pivot and the 40-day support base.
The structure, level by level
All levels are E-mini prices; the futures carry roughly a 55-point premium to cash. Overhead, the immediate ceiling begins at the overnight high of 7,558, the prior-session stall near 7,570.75, and the first pivot resistance at 7,579.75. That 7,558 to 7,580 band is the pivotal decision zone the market is now testing, aligning with the underlying 7,500 to 7,520 area that capped Wednesday. Above it sit the second pivot resistance at 7,616 (index 7,550, a mapped magnet), the third at 7,653 (index near 7,600), the one-month high at 7,690, and the 52-week high at 7,693.75 as the structural ceiling.
Beneath spot, the first support base is the reclaimed 7,555 to 7,560 shelf, then the rising 40-day at 7,522.65 and the overnight low at 7,520.25, essentially one shelf, then daily pivot support at 7,506.50 and a dense pocket at 7,491 (the 50 percent retracement of the four-week range) and the 18-day at 7,489.87, which map to the underlying 7,400 dealer-support base. The second pivot support at 7,469.50 aligns with the 50-day near 7,471, the line separating consolidation from a deeper pullback. With the initial post-data pop already lifting price roughly 24 points into resistance, the reclaimed 7,555 area is the level that separates a durable break from a spent spike; holding it on a pullback is the higher-quality long, while chasing the 7,570 to 7,575 highs into the open is not.
The complete data picture
Level map (ES futures)
| Zone | Level (ES) | What it is |
|---|---|---|
| Resistance | 7,690 / 7,693.75 | 1-month high / 52-week high (ceiling) |
| Resistance | 7,616 / 7,653 | 2nd / 3rd pivot (index 7,550 / 7,600 magnets) |
| Decision band (here) | 7,558 to 7,580 | O.N. high, 7,570 stall, pivot R1; NFP high 7,575.25 |
| Reclaimed shelf | 7,555 to 7,560 | Index 7,500 area, flipped to support |
| Pivot | 7,543.50 | Prior settle; stop reference below |
| Support | 7,520 to 7,522 | O.N. low + 40-day (first base) |
| Support | 7,506.50 / 7,491 | Pivot S1 / 50% retr + 18-day (index 7,400) |
| Support | 7,469.50 / 7,471 | 2nd pivot support + 50-day (trend line) |
By the numbers
Employment detail: private payrolls 49k (f'cast 107k), average hourly earnings +0.3% m/m and +3.5% y/y (in line), initial claims 215k, continued claims 1.814M, average workweek 34.3 hours, prior payrolls revised 172k to 129k. Moving averages: 5-day 7,506.95, 20-day 7,499.75, 50-day 7,471.04, 100-day 7,172.27, 200-day 7,074.17, year-to-date 7,149.51. Oscillators: RSI 9-day 54.84, 14-day 53.86; stochastic 9-day 75.9%; 14-day trend index 20.4. Volatility: 14-day ATR 99.75 (1.32%); implied session move about 70 index points. Dealer gamma net positive (call 3.1B vs put -1.63B); the 7,500 index zone had flipped to amplifying into Wednesday's close. Cross-asset: gold 4,140 (+1.43%), crude 67.35 (-1.79%), bitcoin +2.1%.
The three paths (post-data)
Path A, follow-through (about 45%): a post-open hold of the reclaimed 7,555 shelf, an accepted break of 7,580, and a grind toward the 7,605 to 7,616 zone (index 7,550 magnet).
Path B, spent-spike digestion (about 35%): the 7,575 to 7,580 ceiling holds, price mean-reverts toward the 7,543 pivot, and chops inside 7,520 to 7,580 into a thin pre-holiday afternoon.
Path C, fade (about 20%): a rejection of 7,580 loses the 7,541 pivot, opening 7,520 then 7,506 and 7,491 if a hawkish 10:00 headline or a second chip wobble revives caution.
Expected range today: low band 7,491 to 7,520, most-likely mid 7,543 to 7,580 around the reclaimed shelf, high band 7,605 to 7,655; the remaining swing factor is the 10:00 ET Fed Chair testimony.
Today's calendar (ET)
- 8:30 (RELEASED) · Nonfarm payrolls 57k actual (113k f'cast, prior revised to 129k), unemployment 4.2%, average hourly earnings +0.3% m/m and +3.5% y/y, private payrolls 49k, initial claims 215k, continued claims 1.814M. Read: soft headline, lower jobless rate, dovish and risk-supportive
- 10:00 (pending) · Factory orders -2% f'cast (prior +4.8%); Fed Chair congressional testimony (remaining headline risk)
- Rolling · Monthly energy reports (second-order for the E-mini)
- Friday July 3 · Cash market closed for the Independence Day holiday
The updated setup is a pullback-continuation long, not a breakout chase, because the dovish pop has already lifted the E-mini into resistance. The preferred entry is 7,556 to 7,562 on a pullback that holds the reclaimed 7,555 to 7,560 shelf after the 9:45 ET opening range, or an accepted break-and-hold above 7,580 with continuation volume, targeting 7,580, then the index-7,550 magnet at 7,605, and 7,616 to 7,653 if the advance carries into the pre-holiday drift, with a stop at 7,541 below the pivot. The mirror is a mean-reversion short if the open rejects the 7,575 to 7,580 ceiling and loses 7,541, targeting 7,522, then 7,506 and 7,491, managed tightly against the intact uptrend.
Do not chase the session highs into the open; the first spike after a data release is frequently the fake-out, and the level structure matters more than the initial thrust. Watch the 10:00 ET Fed Chair testimony for a hawkish headline that could stall the advance at resistance. Hold 7,555 on a pullback and the holiday-week bid can carry the index toward the 7,550 magnet; lose 7,541 and the pop was spent. Today the S&P traded the payrolls, and the payrolls said easing stays on the table.
Trade the levels, not the noise.
AlgoIndex marks the dealer-positioning levels before each session and scores whether they hold. See the running numbers in the gamma level accuracy tracker, then view pricing.
Foundational guides: gamma exposure explained, call walls and put walls, cumulative volume delta, and what are ES futures.
Related: S&P 500 futures press into a wall of dealer resistance into the July 6 ISM services print.



