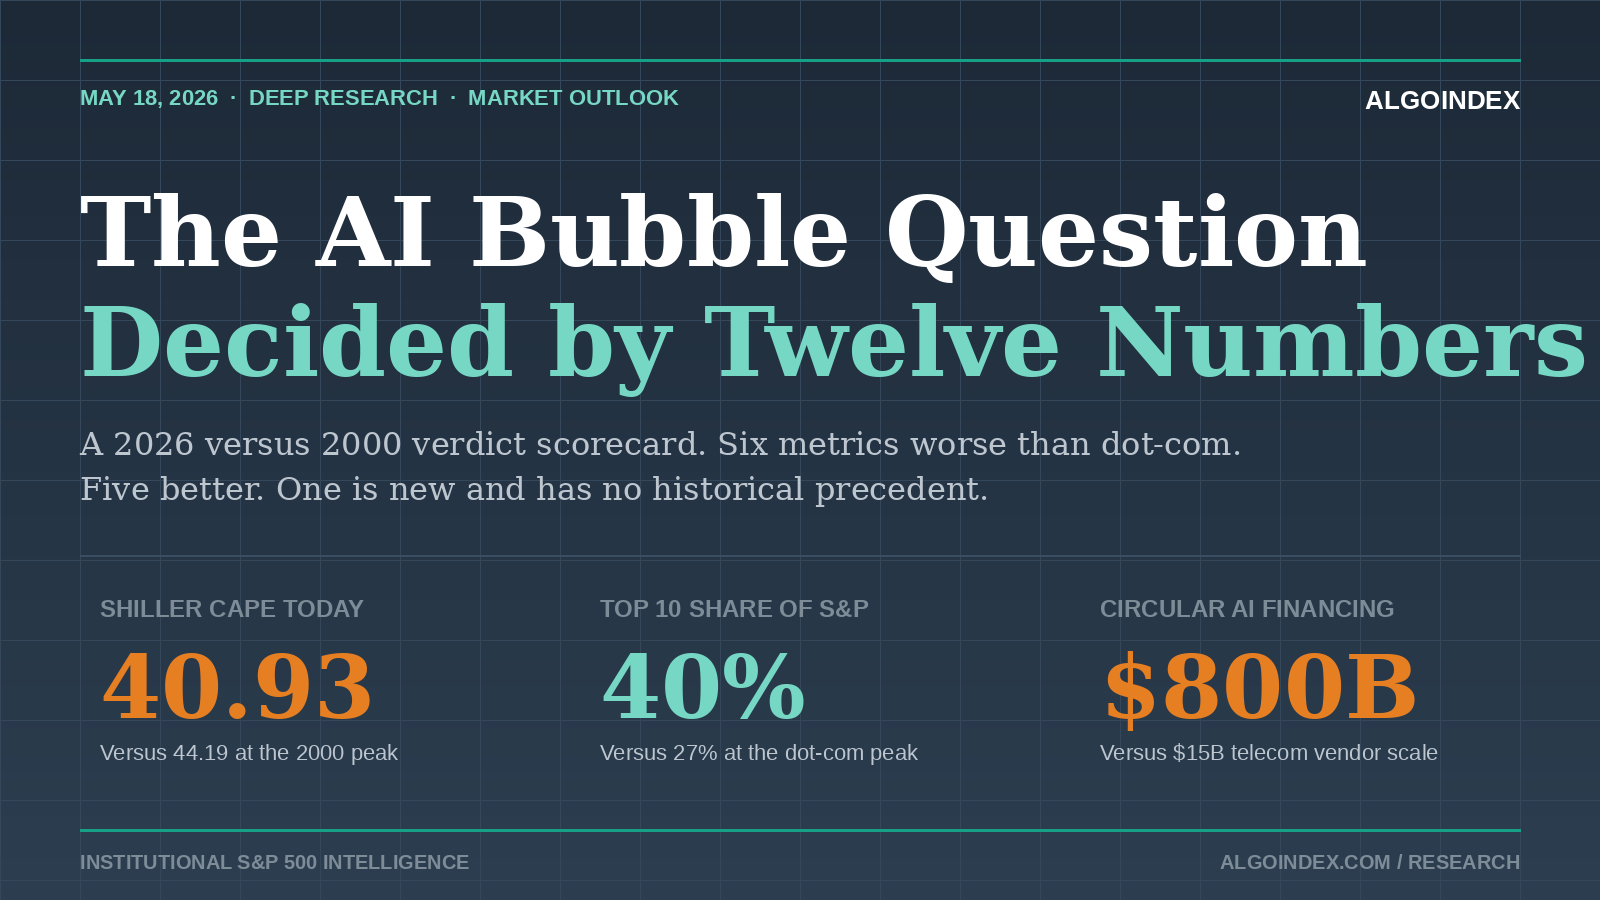
On May 8, Michael Burry posted a single line on his Substack. It read: feeling like the last months of the 1999-2000 bubble. The Shiller cyclically adjusted price-to-earnings ratio stood at 40.1 that day. Subsequent filings showed he had purchased January 2027 put options on the iShares semiconductor ETF with strike prices placed approximately 30 percent below the spot price at the time of purchase. He highlighted that the top 10 stocks in the S&P 500 had surged 78.4 percent in the trailing 12 months, against a 62.2 percent surge in the top 10 names in the 12 months that preceded the March 2000 dot-com peak. The historical reference was not subtle. He was positioning for the parallel, not just warning about it.
Three days later, Bloomberg ran the warning across its front-page financial coverage. Jeremy Grantham, the GMO co-founder who publicly identified all three major market dislocations of the last 30 years before they occurred, gave an interview reaffirming his view that the current setup is the real McCoy: a fully fledged major bubble whose eventual correction could echo the scale of the Great Depression. Torsten Slok at Apollo published research arguing that today's top 10 names are more overvalued than the equivalent group at the 1999 peak. Man Group's institutional client note warned that the AI cycle exhibits unprecedented circular financing patterns recalling the vendor financing structures of Nortel, Lucent, and Cisco. Goldman Sachs maintains a year-end S&P 500 target of 7,600 while explicitly modeling a bear case in which concentration risk drags the index back to 5,800.
The disagreement is not about whether the market is expensive. Both sides agree it is. The disagreement is about whether the underlying earnings power justifies the multiple, whether the circular financing structure under the AI capital expenditure cycle is sustainable or fragile, and whether the eventual reset is a 12 to 18 percent correction or a 50 percent structural break. This article is a synthesis of the deep-research workup we built on this question, organized around the data that resolves the debate.
What the data actually says about 2026
| METRIC | 2000 PEAK | MAY 2026 | VERDICT |
|---|---|---|---|
| Shiller CAPE ratio | 44.2 | 40.93 | COMPARABLE |
| Tech forward P/E | 50x | approx. 31x | BETTER |
| Top 10 share of S&P 500 | 27% | approx. 40% | WORSE |
| Top 10 share of earnings | <20% | approx. 31% | BETTER |
| Top 10 trailing 12mo return | +62.2% | +78.4% | WORSE |
| Top company P/E (Nvidia vs Cisco) | 201x trailing | approx. 30x forward | BETTER |
| Federal funds rate | 6.0-6.5% | 3.50-3.75% | BETTER |
| Fed posture | Hiking 175bps | On hold, 1 cut | BETTER |
| Vendor financing scale | approx. $15B | approx. $800B | WORSE |
| Hyperscaler annual capex | approx. $100B | approx. $700B | WORSE |
| Buffett indicator (mkt cap/GDP) | 153% | approx. 205% | WORSE |
| 0DTE options share | N/A | approx. 50% | NEW RISK |
The metrics where 2026 is worse: top 10 share of S&P 500 (40 percent versus 27 percent), top 10 trailing 12-month return (78.4 percent versus 62.2 percent), vendor financing scale (approximately 800 billion dollars in disclosed circular arrangements versus 15 billion dollars at the telecom peak), annual hyperscaler capital expenditure commitment (700 to 725 billion dollars in 2026 versus roughly 100 billion at the dot-com telecom peak), annual AI-adjacent debt issuance (250 to 300 billion dollars projected versus 200 billion at the prior peak), the Buffett indicator (205 percent of GDP versus 153 percent at the 2000 peak), and the existence of zero-day-to-expiration options as 50 percent of S&P 500 options volume on heavy days, a product structure that did not exist at all in 2000.
What makes 2026 genuinely different
The first reassurance is real earnings and real cash flow. In 1999, Cisco traded at 176 times free cash flow. JDS Uniphase had revenue of approximately 2 billion dollars and a market capitalization above 100 billion dollars at peak. Pets.com had no path to positive cash flow at the time of its initial public offering. In 2026, Nvidia reported net income above 120 billion dollars in fiscal 2026 and generated free cash flow approaching 90 billion dollars. Microsoft, Alphabet, Meta, and Amazon each produce annual operating cash flow above 100 billion dollars. The AI leaders are not selling a story. They are selling chips, cloud capacity, and advertising inventory at gross margins between 50 and 80 percent.
The second reassurance is customer concentration. In 1999, the largest customers of optical networking and routing equipment vendors were other internet startups that themselves had no revenue. The vendor financing arrangements of Nortel, Lucent, and Cisco were designed to keep that buyer base solvent long enough to recognize revenue. When the buyers failed, the vendor revenue evaporated. In 2026, the largest customers of Nvidia, Microsoft Azure, and Amazon Web Services are profitable Fortune 500 enterprises and well-funded private companies. Enterprise generative AI spending reached 37 billion dollars in 2025, more than triple the prior year. Seventy-one percent of organizations report regular generative AI use in at least one business function.
The third reassurance is forward multiples. Nvidia trades at roughly 30 times forward earnings. Microsoft trades at 33 times. Alphabet at 23 times. Meta at 26 times. Amazon at 38 times. These multiples are elevated relative to the 16-times long-term S&P 500 average but nothing close to the 50 times forward multiple the technology sector reached in March 2000, and nothing remotely close to the 201 times trailing multiple Cisco printed at its peak.
The fourth reassurance, and the most decisive of the four, is that the Federal Reserve is not actively tightening. The dot-com bubble did not collapse because investors collectively woke up to the absurdity of Pets.com. It collapsed because the Federal Reserve raised the federal funds rate from 4.75 percent in June 1999 to 6.50 percent in May 2000. That cumulative 175 basis points of tightening sucked liquidity out of the high-multiple end of the equity market while pulling capital into newly attractive short-term yields. In 2026, the Federal Reserve held rates at 3.50 to 3.75 percent at the April 29 meeting and the dot plot implies one further cut this year and another in 2027. Liquidity is not being actively withdrawn from the system.
What makes 2026 genuinely concerning
Against the four reassurances stand five structural concerns that did not exist in 1999, or existed at smaller scale. Concentration risk has surpassed 2000, the Buffett indicator sits at a record 205 percent of GDP, circular financing exists at unprecedented scale, AI debt now represents 15 percent of new investment-grade corporate issuance, and the zero-day-to-expiration options environment amplifies short-term moves through a microstructure that did not exist in 2000.
In the 28-session rally between late March and early May 2026, just 10 stocks drove 69 percent of the index gains. The Buffett indicator has never sustained above 200 percent without an eventual reset. To return to a long-term average of approximately 100 percent would require either a 50 percent decline in equity values, a doubling of US nominal GDP, or some combination. The math of mean reversion is unforgiving when the starting point is this extreme.
The hidden risk layer: circular financing
Circular financing is the single feature of the present AI cycle that has no counterpart in any prior bull market at this scale. The vendor financing of the dot-com era, which exceeded 15 billion dollars at its peak across Nortel, Lucent, and Cisco combined, looks small relative to the disclosed 800 billion dollars in circular arrangements currently active.
None of the individual transactions in this loop are illegal or accounting frauds. Each one is a legitimate, arms-length contract under generally accepted accounting principles. The problem is that the consolidated picture, in which Nvidia's revenue is partly self-funded and OpenAI's reported growth is partly funded by its own vendors, is invisible at the level of any single regulatory filing. By the first quarter of 2026, equity analysts began demanding what they called clean revenue numbers, meaning revenue from customers that have no equity, debt, or vendor financing relationship with the seller.
The first observable signal of stress within the loop has already appeared. In September 2025, Nvidia announced a letter of intent to invest up to 100 billion dollars in OpenAI. By November 2025, the company disclosed the deal might not come to fruition. In January 2026, the agreement was reported as on ice. In March 2026, Jensen Huang told investors directly that the 100 billion dollar investment was not in the cards. The largest disclosed circular financing commitment in the cycle has already been quietly withdrawn, while the broader market continues to treat that capital expenditure commitment as embedded in the AI demand picture. This is the single most underappreciated fact in the current setup.
The Federal Reserve as the swing variable
The Federal Reserve is the second decisive variable. The April 29, 2026 FOMC meeting concluded with the third consecutive hold, leaving the federal funds rate at 3.50 to 3.75 percent. The March dot plot implies one cut in 2026 and one more in 2027, taking the funds rate to a 3.0 to 3.25 percent expected neutral by end-2027. Without active Fed tightening, the structural mechanism that punctured the 2000 bubble is absent.
There is one scenario in which the Fed becomes the trigger. If headline CPI re-accelerates to 3.5 percent or above on a sustained basis, perhaps driven by a second leg in energy prices or a renewed tariff impulse, the Fed may be forced to abandon the one-cut bias and signal a possible hike. A hawkish pivot would be the single most equity-negative catalyst available in 2026. The probability of this scenario is low at present, perhaps 15 to 20 percent, but its impact would be severe if realized.
Three scenarios for the rest of 2026
The base case carries a 50 percent probability and lands the S&P 500 in the 6,400 to 6,800 range by year-end. The bull case carries a 25 percent probability and lands the index in the 8,000 to 8,400 range. The bear case carries a 25 percent probability and lands in the 5,200 to 5,800 range. The catalyst calendar that resolves the scenario weighting runs from the second-quarter 2026 hyperscaler earnings in late July, through the Jackson Hole symposium August 21-23, the September 16-17 FOMC meeting, the October 20-30 third-quarter hyperscaler earnings window, and the December 9-10 final FOMC meeting of 2026.
The trader action guide
The asymmetric risk profile in the second half of 2026 supports a modest reduction in gross exposure relative to the first-half 2026 norms, combined with higher cash reserves than the strategy default. Retaining 15 to 20 percent of buying power in cash through the end of October, with intent to deploy on a 7 to 10 percent S&P 500 pullback, is consistent with the base-case probability weighting. Our performance methodology documents the sizing framework that governs major-event conditions like the one ahead.
On single names, Nvidia should be held in reduced gross size, with covered calls sold at delta 25 to 30 on rallies, as the highest earnings-quality name in the basket. Broadcom should be reduced by half through July earnings, with consideration of a full exit before the third quarter, given its highest exposure to the capital expenditure cycle. Microsoft, Alphabet, Meta, and Amazon should be maintained, with Meta at reduced size given that its capex pace exceeds reasonable medium-term return math. Oracle should be reduced or exited and re-entered 25 to 30 percent below current as the most exposed pure-play AI debt vehicle. Tuesday's daily article tracked the immediate pre-NVDA-earnings positioning; this research piece sets the strategic frame within which those tactical entries operate.
The bottom line
The investors warning of a 1999-style top are not wrong about the warning signs. They are likely wrong about the precise outcome. The 2026 market exhibits concentration risk, valuation extremes, and circular financing structures that exceed the 2000 peak on several measures. It also exhibits earnings quality, free cash flow generation, and a supportive monetary policy backdrop that are materially better than 2000. The two sets of facts produce a different forward path: a meaningful multiple reset and a sharp rotation, rather than a full structural collapse.
The single highest-conviction forward risk is the 2027 hyperscaler capital expenditure guidance, which will be set during the third and fourth quarter 2026 earnings cycles. The second highest-conviction risk is a credit event in the AI debt complex. The third risk, and the one most under-discussed, is the Federal Reserve losing patience with the policy hold the moment headline CPI re-accelerates above 3.5 percent.
The dot-com analogy is not wrong. It is incomplete. The features that rhyme are concentration, capex frenzy, vendor financing loops, and retail euphoria. The features that do not rhyme are earnings reality, free cash flow generation, and monetary policy posture. The asymmetric risk is not a 78 percent NASDAQ collapse. It is a 25 to 35 percent reset in semiconductor and AI infrastructure names that drags the broad index down 12 to 18 percent and rotates leadership for the next cycle.
A market that combines the rhyming features and the non-rhyming features will not produce a 78 percent crash. It will produce a meaningful reset that resolves the imbalances while leaving the underlying business franchises intact for the next cycle. That is the base case. The trader positioning is what monetizes it.
AlgoIndex turns this same multi-source synthesis into automated entries, sizing, and exits across ES, NQ, GC, and CL.
View pricing