Every options-analytics service on the internet will tell you where the call wall is. Almost none will tell you whether it held. The levels get published each morning with confidence, the market does whatever it does, and by the next morning a fresh set of levels has quietly replaced yesterday's, with no scorecard kept. If a number is worth trading around, it is worth measuring. So we built a public tracker that measures ours.
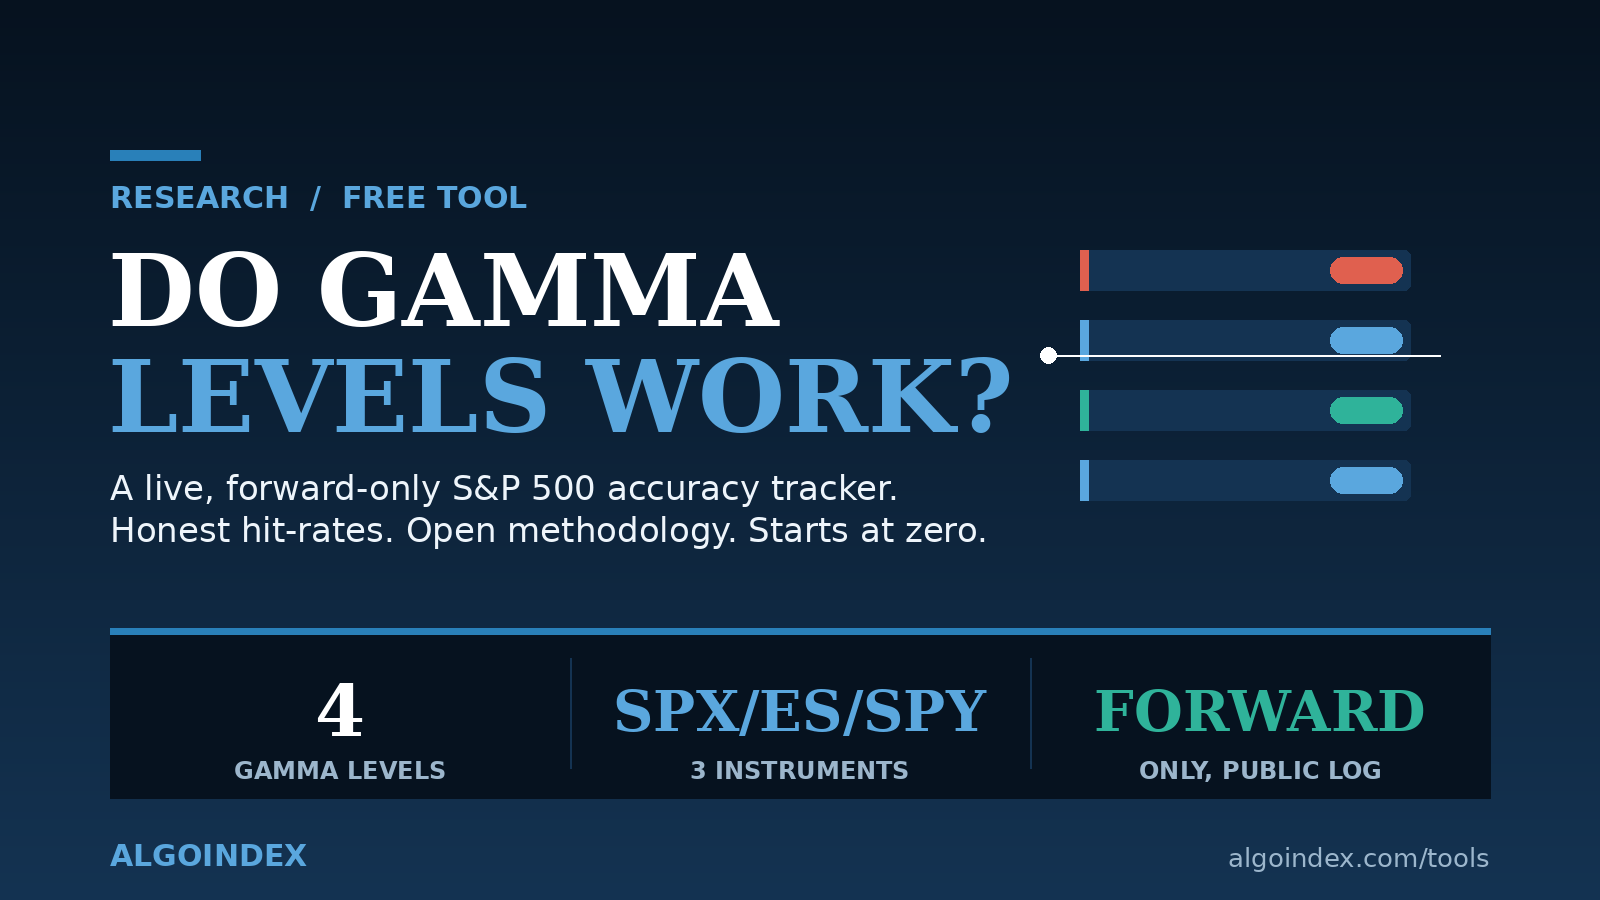
The S&P 500 Gamma Level Accuracy Tracker computes four gamma levels from the options chain every trading morning, checks after the close whether price respected them, and publishes the running hit-rate in the open. The record started at zero and accrues in public, weak stretches included. This guide explains exactly what the tracker measures, how the levels are computed, how accuracy is scored, and how to use the whole thing in your own trading.
What the Tracker Actually Measures
The premise is narrow on purpose. Every morning the tool reads the live S&P 500 options chain and computes four levels: the call wall, the put wall, the gamma flip, and the expected range. After the cash close, it grades each one against what price actually did and updates a running accuracy figure. Nothing is back-filled, nothing is revised, and no day is quietly dropped because it looked bad.
One distinction matters before anything else. This measures how reliably a market-structure computation describes where price reacts. It is not a trading-signal win rate. A level that holds 70 percent of the time it is tested is telling you that price respects that price more often than not, which is useful as context. It is not telling you that buying or selling there makes money, because that depends on your entry, your stop, your size, and your timing. The tracker answers one question cleanly, does this computed level describe where price reacts, and refuses to pretend it answers a different one.
The Four Gamma Levels, in Plain Terms
The levels come from how options dealers are positioned, and each one marks a price where their hedging tends to do something specific. Read them as reference prices where buying and selling pressure concentrates, so price often pauses, reverses, or accelerates as it arrives, not as instructions to buy or sell.
The call wall is the strike above the current price with the heaviest call-side positioning. As price rises toward it, dealer hedging tends to slow the advance, so it often acts as a ceiling and a common upside target. The put wall is its mirror below price, the heaviest put-side strike, where declines tend to stall and bounces become more likely, a support area rather than a hard line. The gamma flip is the price that separates a stabilizing environment above it, where hedging dampens moves, from an amplifying one below it, where hedging extends them. It works as a directional dividing line: calmer above, choppier below. The expected range is the high-to-low band the options market is implying for the session, computed from at-the-money implied volatility. Its edges act as stretch targets, and a close outside the band marks an unusually strong day.
The tool also surfaces a fifth, the key gamma strike, the strike nearest price with the largest total positioning. It behaves as an intraday magnet, the price the market is most likely to gravitate back toward, which is why it is useful as a mean-reversion pin. Together these five describe a structure: a ceiling, a support area, a volatility dividing line, a magnet, and a band around the whole thing.
Why These Levels Exist At All: The Hedging Mechanics
A level only matters if there is a real flow of money that defends it. The gamma levels qualify because of how options dealers manage risk. When a dealer sells an option, they take on directional exposure they do not want, so they hedge it in the underlying and keep re-hedging as price moves. The direction of that re-hedging depends on the sign of the dealer's net gamma, and that single fact is what turns an abstract strike into a price where order flow concentrates.
When dealers are net long gamma, their hedge runs against the move: they sell into strength and buy into weakness to stay neutral. That mechanical flow absorbs volatility and pulls price back toward the strikes where the positioning sits, which is why the area above the gamma flip behaves as a stabilizing, mean-reverting environment and why the heaviest strikes act like magnets. When dealers are net short gamma, the hedge runs with the move: they must buy as price rises and sell as it falls, which feeds the trend instead of fading it. That is the amplifying environment below the flip, where the same headline produces a larger range. The gamma flip is simply the price where the net of all this positioning crosses from one behavior to the other.
This is why the levels are worth grading rather than just plotting. The call wall and put wall are the strikes where this hedging flow is heaviest, so price tends to stall as it arrives. The flip is the switch between the two environments. None of it is guaranteed on any given day, because real order flow includes far more than dealer hedging, but the mechanism is real and persistent enough that the levels describe where price reacts more often than chance, which is exactly what the tracker sets out to measure.
How the Levels Are Computed
The methodology is fixed and published so the figures are reproducible, which is the whole point of a credibility tool. For each contract in the chain, the tool computes its gamma from implied volatility using the standard Black-Scholes formula, then converts that into a dollar gamma exposure per strike using the dealer sign convention, where dealer call positioning and put positioning carry opposite signs. Summing across strikes produces a gamma-by-strike profile for the index.
d1            =  [ ln(S/K) + (r + sigma^2/2) * T ] / (sigma * sqrt(T))
gamma         =  phi(d1) / (S * sigma * sqrt(T))

call GEX[K]   =   sum( gamma_call * OI_call * 100 * S^2 * 0.01 )
put  GEX[K]   =  -sum( gamma_put  * OI_put  * 100 * S^2 * 0.01 )
net GEX[K] = call GEX[K] + put GEX[K]From that profile the four levels fall out directly. The call wall is the strike with the largest call-gamma concentration above spot. The put wall is the largest put-gamma concentration below spot. The gamma flip is the price where the running cumulative net gamma crosses zero, the mathematical boundary between the stabilizing and amplifying zones. The expected range is a one-session band of the spot price plus and minus the spot times at-the-money implied volatility times the square root of time. There is no discretionary overlay. The same inputs always produce the same levels.
A few parameters keep the computation honest. Standing levels aggregate every expiration within 45 days, with a separate same-day set computed alongside. Strikes with under 100 contracts of open interest are filtered out so thin, illiquid strikes do not distort the profile. The risk-free rate is a fixed short-term constant, and open interest is the prior-day figure, the standard input for this kind of gamma math.
A Worked Example: From One Strike to the Call Wall
To make the math concrete, take a simplified single-strike example with the index near 6,000. Consider the 6,100 call with 30 days to expiry, implied volatility of 20 percent, and 40,000 contracts of open interest. Plugging those into the gamma formula gives a per-share gamma of roughly 0.0021. The dollar gamma exposure for that strike is the per-share gamma times open interest times the 100 contract multiplier times the square of spot times the one-percent move scaler:
gamma (6,100 call)  =  0.0021 per share
GEX[6,100]          =  0.0021 * 40,000 * 100 * 6,000^2 * 0.01
                    =  about $302 million of gamma per 1% move
Run that same computation for every strike in the chain, attach the dealer sign convention so call positioning and put positioning carry opposite signs, and you get a profile of dollar gamma across all strikes. The strike that returns the largest positive concentration above spot is the call wall; in a real chain it is rarely the roundest number, it is wherever the open interest actually piled up. The largest concentration below spot is the put wall. The price where the running cumulative total crosses zero is the flip. Because each output traces back to published inputs and one fixed formula, anyone can reproduce the same levels from the same chain, which is what separates a measured tool from an opinion.
Charm, Vanna, and Why the Levels Drift Intraday
Gamma sets where the levels sit, but two higher-order sensitivities explain why they migrate during the session and why some days the flip matters far more than others. Charm is the rate at which an option's delta decays as time passes. As expiry approaches, charm forces dealers to unwind hedges, and into the final hours of an expiration day that unwind becomes a one-directional flow that pulls price toward the heaviest strikes, the mechanical engine behind end-of-day pinning. Vanna is the rate at which delta changes as implied volatility changes. When volatility spikes, vanna flows can move dealer hedges sharply even if price has barely moved, which is why a level that looked solid in a calm market can give way the moment volatility expands.
Two Clocks: Same-Day Levels vs Standing Levels
The tracker computes two sets of gamma levels in parallel because options positioning runs on two clocks. The standing set aggregates every expiration within 45 days and describes the structural pressure that holds across sessions. The same-day set isolates only the contracts expiring that day, and because same-day options carry enormous gamma per contract near the close, that set dominates intraday behavior, especially the pinning into the final hour. A trader watching for a multi-day reaction leans on the standing levels; a trader working the last two hours of an expiration day leans on the same-day set. Showing both keeps the tool honest about which force is in control at a given moment, rather than blending two different time horizons into one misleading number.
How Accuracy Is Scored
Scoring is where most "our levels work" claims fall apart, because the grading rule is left vague enough to flatter the result. Here the rule is mechanical and stated up front. A level uses a touch tolerance of 0.10 percent and a tested threshold of 0.25 percent. A level counts as tested when price comes within the threshold of it during the session. Once tested, it counts as held if price closes on the expected side of the level, and broke if it does not.
Only tested days count toward the score. A level price never came near was never proven, so it never inflates the figure.
Two design choices make the number trustworthy rather than cosmetic. First, untested days are excluded from the denominator entirely. A call wall sitting far above a quiet session was never challenged, so counting it as a hold would inflate the hit-rate with days that proved nothing. Only days where price actually tested the level count toward its score. Second, every percentage is published next to its tested-day count, so a 75 percent hit-rate over 8 tested days is visibly different from 75 percent over 80, and you can judge for yourself how much weight the sample deserves.
A hit-rate with no sample size is an assertion. A hit-rate with its sample size attached is evidence.
That tested-day count is the detail that separates an honest tracker from a marketing chart. A hit-rate with no sample size attached is an assertion. A hit-rate with its sample size attached is evidence.
Why Forward-Only and Public Is the Whole Point
It is easy to make any set of levels look accurate after the fact. Pick the days that worked, describe the misses as the level was never really tested, round generously, and publish the highlight reel. A forward-only public log removes every one of those escape hatches. The record began at zero on the day the tracker went live and has accrued one session at a time ever since, with no ability to reach back and edit a bad day into a good one.
This is deliberately uncomfortable. A forward-only tracker will have weak stretches, and ours has shown them, because real market structure does not respect a computed level every single day. Publishing those stretches is the cost of the credibility. A number you are willing to show on its bad days is worth more than a number that only ever appears when it flatters the author. The tracker is, in effect, a standing bet that the methodology is sound enough to survive being measured in public.
Two Families of Levels, and Why Confluence Matters
Alongside the dealer-gamma levels, the tool publishes a second family computed from price and volume, where the market actually transacted rather than where dealers are positioned. These include the volume point of control, the single price with the most volume in the prior session, the value-area high and low that bracket roughly 70 percent of the prior session's volume, the prior-day high and low, and the overnight high and low. A handful of session-derived references like the volume-weighted average price and the opening range are shown too, though those carry no accuracy badge because grading a level against the same session it was drawn from would be circular.
Put wall
Gamma flip
Key gamma strike
Expected range
Value area high / low
Prior-day high / low
Overnight high / low
Two independent families on one screen: positioning-based and transaction-based references.
The reason both families live on one screen is confluence. When a put wall sits right at the prior-day low and the lower value-area edge at the same price, three independent methods, dealer positioning, price, and volume, all point at one number. A reaction there is more likely than at any one of them alone, because the agreement is not a coincidence of one model but a convergence of several.
This is how the tracker is meant to be used in practice. Do not treat any single level as a line in the sand. Look for the prices where several levels stack, weight them by the accuracy badges that show which have earned the most respect over time, and use them as the reference points around which you plan, not as triggers that fire on their own.
Using It in Your Own Trading
The tool covers three instruments, SPX, ES, and SPY, so the same dealer-positioning structure is available whether you trade the index, the futures, or the fund. Start with the gamma levels to frame the day: where is the ceiling, where is the support area, which side of the gamma flip are we on, and where is the magnet. Then overlay the volume and price levels to find the confluence prices. Then read the accuracy badges to see which of those levels has actually held when tested, and lean on the ones with both a strong hit-rate and a meaningful tested-day count.
None of this replaces judgment about momentum, catalysts, and risk. It gives that judgment a map. If you want the deeper mechanics behind the levels, our complete guide to gamma exposure and our explainer on how dealer gamma positioning shapes the day go under the hood, and our framework for reading support and resistance covers the price-and-volume side.
Put the Tracker on Your Own Site
Because the tracker is meant to be checked, not taken on faith, it ships in two embeddable forms. The compact card shows today's four levels and the running accuracy figure in a small footprint. Paste a single iframe and it renders in place, updating on its own each session:
<iframe src="https://algoindex.com/tools/gamma-level-accuracy/embed"
        width="360" height="420" frameborder="0"
        title="S&P 500 Gamma Level Accuracy"></iframe>
And for the full visual, the live chart itself, the one at the top of this article, is embeddable the same way, with the day's candles and every computed level drawn on:
<iframe src="https://algoindex.com/tools/gamma-level-accuracy/embed/chart"
        width="100%" height="460" frameborder="0"
        title="S&P 500 Gamma Levels, live chart"></iframe>
Both are small, self-contained ways to keep an honest, live read in front of your own readers, and both point back to the full methodology for anyone who wants to verify the numbers. An optional underlying parameter switches either embed to ES or SPY.
What the Tracker Cannot Tell You
An honest tool is clear about its blind spots. Three matter most. First, open interest is the prior-day figure, the standard input for this math, which means the profile does not capture positioning that opens and closes within the same session, so a level can be overtaken by fresh intraday flow that the morning snapshot never saw. Second, the dealer sign convention is a well-established assumption, not a measured fact; on the rare day when the real dealer book runs opposite to the convention, the environment can behave inversely to what the flip implies. Third, these are index-level computations, so they describe broad S&P structure and will not capture a single-name shock that moves the index through a level for reasons that have nothing to do with gamma. The levels are a high-quality map of one real force. They are not the entire market, and the accuracy badges exist precisely so you can see, in the open, how often that one force wins.
Frequently Asked Questions
Some are, some are not, and the only honest answer is to measure it in the open. Our tracker computes the call wall, put wall, gamma flip and expected range every morning and publishes the share of tested sessions each level held, next to its tested-day count, so you can judge the reliability yourself rather than take a claim on faith.
The call wall is the strike above the current price with the heaviest call-side options positioning. As price rises toward it, dealer hedging tends to slow the advance, so it often behaves as a ceiling and a common upside target. It is watched as resistance, not as a guaranteed stopping point.
The walls are price levels where reactions concentrate: the call wall as a ceiling, the put wall as a support area. The gamma flip is a dividing line, the price above which dealer hedging dampens moves and below which it amplifies them. The walls mark where price reacts; the flip marks the change in how volatile the environment is.
Yes. The tracker computes the same dealer-positioning structure for SPX, ES and SPY, so you can read the levels on the index, the futures, or the fund depending on what you trade. The underlying options math is the same; only the instrument the levels are expressed on changes.
No. It measures how reliably a computed level describes where price reacts, not whether trading at that level is profitable. Profitability depends on entry, stop, size and timing. The tracker answers the structural question cleanly and does not pretend to answer the trading-performance one.
Gamma exposure is the dollar amount dealers must hedge for a given move in the underlying. For each strike it is the option's gamma times open interest times the 100 contract multiplier times the square of spot times a one-percent scaler, with call and put positioning carrying opposite signs. Summed across strikes it produces the gamma-by-strike profile from which the call wall, put wall and gamma flip are read.
Dealer hedging is one real force among many. It dominates on quiet, positioning-driven sessions and gets overwhelmed when a macro catalyst or single-name shock drives flow that has nothing to do with options. Higher-order sensitivities also matter: charm concentrates flow into expiration-day closes, and a volatility spike can move dealer hedges through a level via vanna. The accuracy badges exist so you can see, day by day, when the levels are earning respect and when they are not.
Standing levels aggregate every expiration within 45 days and describe structural pressure that holds across sessions. Same-day levels isolate only the contracts expiring that day, which carry very large gamma near the close and therefore dominate intraday pinning. The tracker publishes both so you can tell which time horizon is driving price at a given moment instead of blending them into one number.
See it applied: Thursday's ES read built around an eleven-billion-dollar dealer cushion.
Related: Call walls and put walls, and whether they actually hold, and max pain, the expiration magnet, explained.
See the live hit-rates, today's levels, and the full daily log.
Open the Gamma Level Accuracy Tracker →Want the levels turned into a disciplined daily signal? See how AlgoIndex works.