
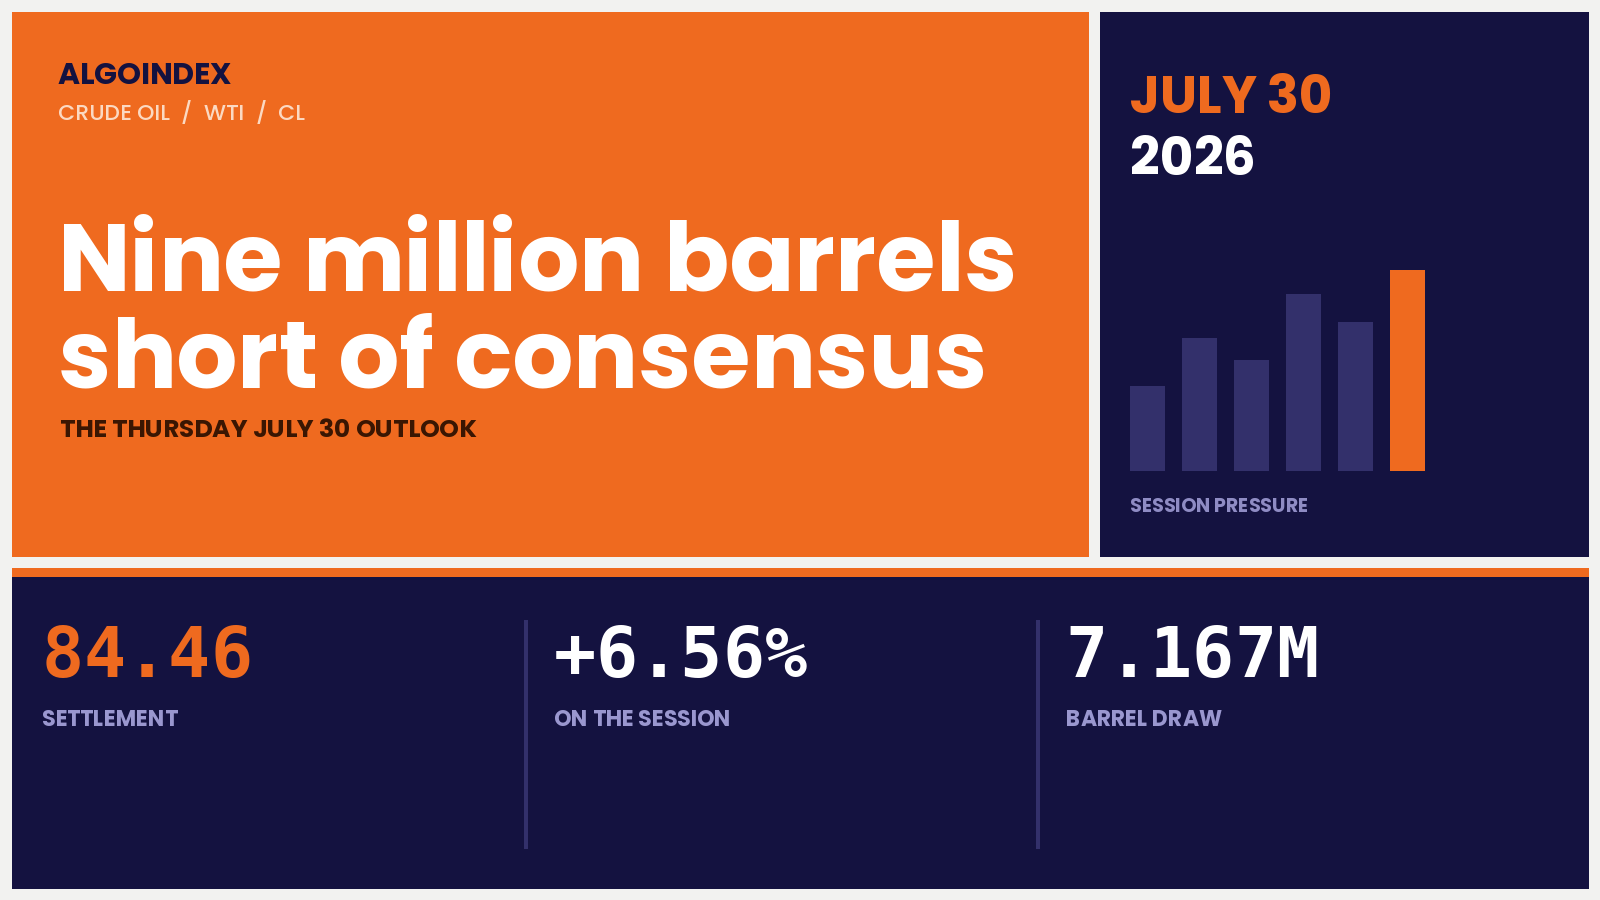
At 10:30 Wednesday morning the weekly crude inventory print landed more than nine million barrels away from where consensus had it. Forecasters wanted a build of 1.0 million. What came out was a draw of 7.167 million, and it took total crude stocks to a 7.75 year low while Cushing, the physical delivery point for this contract, fell to a nearly twelve year low.
September WTI had been climbing since the electronic open. It did not stop.
The contract settled 84.46, up 5.20 or 6.56 percent, the largest single advance of this cycle and 80.4 percent of the way up a 5.65 point range. Volume printed 304,542 contracts, 12.0 percent above the twenty day average. After the settle it stood bid 84.60 against 84.68 offered. Nobody was fading that close.
Two engines fired inside the same session, and that separates Wednesday from the headline spikes of the prior fortnight. Iran's Revolutionary Guard put ballistic missiles into a US airbase and command center in Jordan, claimed it had halted three tankers in the Strait of Hormuz, and the US and Saudi Arabia answered with a joint strike on Iran-aligned militias in Iraq. At 15:21 ET the President said it was America's turn. Tuesday's ceasefire, the one that underwrote a 4.06 percent decline, is gone.
A war premium sitting on the tightest visible physical position in almost eight years is a different proposition entirely. Our bias into Thursday is constructive higher at moderate conviction, and the trade is a long on a pullback that holds 83.32 to 83.90 after 09:45 ET, targeting 85.57, then 86.71, then 88.90. The dominant risk isn't technical failure. It's a de-escalation headline that gaps the contract under the shelf before a stop can work.
Worth recording last night's call, because the outcome matters more than the direction. Tuesday night's review carried a counter-trend short that faded the escalation spike, conditional on failure at 83.25 to 83.42, with three invalidations listed: any sustained trade above 83.42, confirmation of retaliatory strikes, or a Hormuz closure attempt. All three fired inside one session. The entry never armed, because price never failed at the band, so the setup was voided. When an invalidation list names an unscheduled event and that event arrives, the entry logic stops mattering.
The measurement systems have not caught up
None of Wednesday's violence has reached them yet. The multi-indicator composite reads 16 percent BUY with strength weak and direction weakening. The medium term grouping still reads 25 percent SELL, the long term grouping is neutral, the short term grouping averages 40 percent BUY. Three of its twelve studies are on sell, and all three are moving average crossover studies, built to turn last.
Price closed above five of six tracked averages: the twenty day at 78.52, the fifty day at 80.51, the hundred day at 81.39, the two hundred day at 70.63 and the year to date at 75.48. Two of those were reclaimed Wednesday in a single session. One average is still overhead, the five day at 85.66, nine cents above the 85.57 session high. That is Thursday's whole argument in one number. The nine day crossing point at 84.85 sits 0.39 above the settle, and the five day change is still negative 1.91 points. Read the composite as a slow instrument, and weigh the directional index above it.
Relative strength should surprise people. A 6.56 percent session left the fourteen day measure at 56.52 after a 7.57 point rise, the nine day at 57.01, the twenty day at 55.20. All three sit mid range. The 70 percent threshold does not arrive until 102.07 and the 50 percent line sits at 79.94, so more than twenty two points of runway exist before momentum argues against buying. Stochastics are the caution, with %K under %D on both windows and the nine day %K down at 28.53. Directional measurement is the strongest input on the buy side: fourteen day index 29.65, positive direction 30.87 against negative 20.46, and a nine day index at 42.76 that says the measurement is accelerating.
Nine million barrels wrong, and a delivery point nearly empty
Supply changed because of the data. A draw of 7.167 million against a consensus build of 1.0 million and a prior build of 2.010 million is a miss of more than nine million barrels. Total crude stocks sit at a 7.75 year low, Cushing at a nearly twelve year low. Delivery point scarcity is what turns a paper contract into a physically squeezed one, and it explains why the forward curve held steep backwardation straight through the 15 percent collapse.
Barrels at risk are still barrels flowing. A 400,000 barrel per day regional refinery remains shut after an earlier strike. Drones aimed at eastern Saudi oil facilities were intercepted. The Revolutionary Guard claims three tankers were halted in the Strait. Crude keeps moving, and each attempt raises the insurance priced into it.
Demand is the weak leg. Gasoline gained 2.59 percent against crude's 6.56, so the refining margin absorbed part of the move instead of widening with it. Natural gas added 2.37 percent off a three month nearest futures low, on short covering into the August expiration. Thursday brings advance US growth expected at 2.0 percent against 2.1 prior and Chinese manufacturing at 50.1 against 50.3. A rally led by crude with products trailing is a supply rally. Supply rallies reverse hardest when the threat is withdrawn.
The Fed put the dollar on the other side
The Federal Reserve held at 3.75 percent and the composition was the news. Nine to three, with Hammack, Kashkari and Logan dissenting in favor of a 25 basis point increase, and a statement conceding inflation remains elevated against the 2 percent goal. Pricing going in implied roughly a 30 percent chance of a hike. Thirty year yields rose to a nearly two decade high, equities closed materially lower, and the S&P futures contract finished down 1.2 percent at the cash close before extending toward negative 1.5 percent in the evening.
For crude that cuts both ways and leans negative past a few days. Firmer long end yields and a hawkish tilt support the dollar, which presses dollar priced crude and erodes demand. The uncomfortable part: an oil driven inflation impulse is exactly what those three dissenters fear, so a sustained advance raises the odds of the minority becoming a majority. Missing from Wednesday is a large safe haven bid, and its absence says the market is pricing a supply disruption rather than a systemic conflict.
Positioning is stale and must be read that way. The July 21 report predates both the 93.50 high and the collapse to 77.78. It shows speculative accounts long and adding on both sides, managed money net long 63,979 and non-commercials net long 81,689. If that length survived the collapse, Wednesday was short covering plus fresh buying into a crowded market. If it did not, buyers have room. Unresolved, and the next report arrives after Thursday.
Where Thursday gets decided
The daily bar is a wide range outside day closing near its high, engulfing the prior session and taking back roughly two thirds of the three day collapse. Price sits 15.7 percent above the July 2 low of 67.12 and 9.7 percent below the July 23 high of 93.50. Month to date the contract is up 20.61 percent from the June 29 open of 70.41. A broken uptrend under repair is the honest description.
Four consecutive lower highs and lower lows ran into Wednesday on the four hour and one hour charts. The overnight reversal printed the change of character, and the cash session confirmed it by taking out the prior lower high. The first higher low is still missing. A pullback that holds above 83.32 and turns up creates it.
Overhead, 84.85 is the first friction. Then the decision: 85.57 stacked on 85.66, the session high and the last unreclaimed average, nine cents apart. Clear them and the first target zone is 86.52 to 86.71, four references inside 0.19 of each other with the forty day crossing at 86.33 reinforcing it. Underneath, the settle band runs 84.43 to 84.54 and the shelf runs 83.25 to 83.42. Lose the shelf and six references compress into 79.82 to 80.51, the most defended area on the chart. Every level sits in the map below, and we score them all afterward against the published performance methodology.
How much room one session has
Volatility governs sizing here more than any level does. Nine day average true range reads 4.74, fourteen day 4.39, twenty day 4.20, and Wednesday's realized range of 5.65 exceeded all three. Historic volatility on the nine day window sits at 73.98 percent against 51.24 on the hundred day, roughly 44 percent above the longer baseline. One fourteen day range around the settle spans 80.07 to 88.85. A normal session moves 4.2 to 4.8 points, and any stop tighter than about a point is inside the noise.
Constructive continuation carries 45 percent: hold above 83.32, work through 84.85, test 85.57 to 85.66, with 86.52 to 86.71 available on a fresh escalation headline. Digestion carries 35 percent, failing at the convergence and finishing inside 83.42 to 85.57. A de-escalation gap carries 20 percent, and it does not stop at the shelf, because premium installed in one session comes out in one print. The long runs 83.32 to 83.90 with an 82.55 stop, never before 09:45 ET.
Everything Wednesday bought can be handed back by one sentence from a podium, and nobody has put that on the calendar.
The complete data picture
Every number behind Thursday's plan, charted first; the full numeric reference follows underneath.
| Electronic open | 80.04 |
| Session low, early electronic hours | 79.92, within a few cents of Tuesday's settle |
| Session high | 85.57, printed into the settle window |
| Settlement | 84.46, only 1.11 below the high |
| Post settle bid and offer | 84.60 bid against 84.68 offered |
| Prior settlement | 79.26 Tuesday, down 3.35 or 4.06 percent, a third lower close |
| Tuesday session low | 77.78, the origin of the reversal |
| Overnight band into Thursday | 84.43 to 85.66, with 84.85 the first friction |
| Expected range envelope | 80.07 to 88.85 on the 14-day, 79.72 to 89.20 on the 9-day, 80.24 to 88.68 on the 14-day daily range |
| Practical planning band | 80.10 to 88.85, a normal move of 4.2 to 4.8 points |
| Four hour and one hour structure | four consecutive lower highs and lower lows with confirmed breaks, then a change of character; the first higher low is undefined |
| Intraday swing pivots | 79.92 low, 83.25 shelf, 83.42 breakout trigger, 85.57 first supply |
| 102.07 | 70 percent relative strength projection, context rather than a session objective |
| 97.35 | moving average convergence stall level, context only |
| 95.30 | 52-week and 13-week high, set May 18 |
| 93.50 | one-month high, July 23, the objective that confirms full trend resumption |
| 92.36 | third pivot resistance, derived |
| 88.97 | second pivot resistance, derived |
| 88.94 | 80 percent raw stochastic projection |
| 88.90 | Target 3 on the primary setup |
| 88.85 | upper one average true range boundary, where a strong trend day exhausts |
| 88.68 | lower edge of the high scenario band |
| 88.21 | third standard deviation resistance |
| 87.10 | stop on the alternate short, above the target grouping |
| 86.71 | first pivot resistance derived from Wednesday's range, Target 2 |
| 86.65 | 70 percent raw stochastic projection, upper edge of the alternate short entry |
| 86.60 | top of the alternate short entry zone |
| 86.57 | second standard deviation resistance |
| 86.52 | third pivot resistance of Wednesday's set |
| 86.33 | forty day average crossing point, reinforcing the first target zone |
| 85.80 | bottom of the alternate short entry zone |
| 85.66 | five day average, the only average still overhead |
| 85.57 | Wednesday session high, Target 1, first supply reference |
| 84.85 | nine day average crossing point, the first friction on Thursday |
| 84.68 | post settle offer |
| 84.60 | post settle bid, above the settle and removing the fade argument |
| 84.54 | 38.2 percent retracement from the thirteen week high |
| 84.47 | second pivot resistance |
| 84.46 | Wednesday settlement, up 5.20 or 6.56 percent |
| 84.43 | first standard deviation resistance, lower edge of the settle band |
| 83.90 | top of the primary entry zone, first objective on the alternate short |
| 83.42 | four week retracement level, Wednesday's breakout trigger |
| 83.32 | Thursday pivot point, derived, bottom of the entry zone, second objective on the alternate short |
| 83.25 | overnight stall, now the shelf beneath the market |
| 83.00 | invalidation line, a sustained trade beneath it breaks the premise |
| 82.55 | stop on the primary long |
| 82.50 | lower edge of the most likely range |
| 82.09 | 50 percent raw stochastic projection, third objective on the alternate short |
| 81.87 | first pivot resistance of Wednesday's set, converts to support if it holds |
| 81.21 | 50 percent retracement from the thirteen week range |
| 81.06 | first pivot support, derived, upper edge of the low scenario band |
| 80.51 | fifty day average, top of the six reference support zone |
| 80.31 | 50 percent retracement from the four week range |
| 80.10 | lower edge of the practical planning band |
| 80.09 | 61.8 percent retracement from the 52-week low |
| 80.07 | lower one average true range boundary, inside the support zone |
| 79.94 | 50 percent relative strength projection |
| 79.92 | Wednesday session low |
| 79.82 | Wednesday pivot point, bottom of the six reference support zone |
| 79.31 | eighteen day average crossing point |
| 79.26 | Tuesday settlement, the gap fill objective on a full unwind |
| 78.52 | twenty day average |
| 78.40 | forty day crossing point beneath the market |
| 77.88 | 38.2 percent retracement from the thirteen week low |
| 77.78 | Tuesday session low |
| 77.67 | second pivot support, derived |
| 77.22 | first pivot support |
| 75.53 | published target price, the extreme downside |
| 75.41 | third pivot support, derived |
| 75.40 | 50 percent retracement of the 52-week range |
| 75.17 | second pivot support |
| 70.41 | June 29 open, the month to date reference |
| 67.12 | July 2 low, 15.7 percent beneath the settle |
| 55.49 | 52-week low, December 16, 2025 |
| 01:30 | French preliminary quarterly growth |
| 02:00 | German flash growth, forecast 0.1 percent quarter on quarter against 0.3 prior |
| 03:00 | Swiss leading indicator |
| 04:00 | Italian preliminary quarterly growth |
| 05:00 | Eurozone preliminary flash growth, forecast 0.2 percent against negative 0.2 prior, and unemployment at 6.2 percent |
| 07:00 | Bank of England rate statement and bank rate, forecast unchanged at 3.75 percent, prior vote seven unchanged and two in favor of a hike |
| 08:00 | German preliminary consumer prices, forecast 2.7 percent year on year against 2.30 prior |
| 08:30 | United States macro block, the single first order event for crude: core consumption inflation forecast 3.3 percent year on year against 3.4 prior and 0.2 percent month on month against 0.3, headline consumption inflation 3.7 percent against 4.1 and negative 0.1 month on month against 0.4, advance quarterly growth 2.0 percent against 2.1 with the growth price index 4.0 against 3.6, initial jobless claims 200,000 against 187,000, personal income 0.3 percent against 0.7, consumer spending 0.4 percent against 0.7 |
| 09:30 | Equity cash open. No entries before 09:45. |
| 14:30 | Contract settlement, earlier than the equity close, so the final ninety minutes trade thinner |
| 16:00 | Amazon quarterly results, after the crude settle but relevant to overnight risk appetite |
| 16:30 | Apple quarterly results |
| 19:30 | Tokyo consumer prices, forecast 1.8 percent against 1.7 prior |
| 21:30 | Chinese manufacturing activity, forecast 50.1 against 50.3 prior, the demand proxy for the Asian session |
| 23:30 | Bank of Japan rate statement and decision, forecast unchanged at 1 percent |
| Friday 06:15 | A major integrated oil producer's quarterly results, relevant for positioning into the week's end but not a Thursday input |
| Friday | Month end, so Thursday afternoon carries the start of index and portfolio rebalancing flows after a month in which crude gained more than 20 percent |
Full numeric reference, every remaining figure from the review
| Wednesday settlement | 84.46, up 5.20 or 6.56 percent, the largest single advance of the cycle |
| Close position in the range | 80.4 percent up a 5.65 point range, only 1.11 below the high |
| Volume | 304,542 contracts, 12.0 percent above the twenty day average |
| Month to date | up 14.51 points or 20.61 percent from the June 29 open of 70.41 |
| Five day change | still negative 1.91 points |
| Three month performance | negative 4.43 percent |
| Fifty two week performance | positive 30.71 percent |
| One month extremes | low 67.12 on July 2, high 93.50 on July 23; price 15.7 percent above and 9.7 percent below |
| Thirteen week and 52-week extremes | high 95.30 on May 18, low 55.49 on December 16, 2025 |
| Contract mechanics | CLU26 expires August 20 in 22 days, first notice August 24 in 26 days, so no roll pressure this week |
| 5-day | 85.66, settle 1.20 below, the only average overhead |
| 20-day | 78.52, settle 5.94 above, reclaimed Wednesday |
| 50-day | 80.51, settle 3.95 above, reclaimed Wednesday |
| 100-day | 81.39, settle 3.07 above |
| 200-day | 70.63, settle 13.83 above |
| Year to date | 75.48, settle 8.98 above |
| Crossing points | nine day 84.85, eighteen day 79.31, forty day 86.33 above and 78.40 below |
| Relative strength, 9 / 14 / 20-day | 57.01 / 56.52 / 55.20, the 14-day up 7.57 on the session |
| Strength thresholds, 14-day | 70 percent at 102.07, 50 percent at 79.94 |
| Raw stochastic, 9 / 14-day | 45.42 / 62.40 percent, with the 70 percent projection at 86.65, the 80 percent at 88.94 and the 50 percent at 82.09 |
| Stochastic %K, 9 / 14-day | 28.53 / 50.76 percent, both beneath their own %D |
| Stochastic %D, 9 / 14-day | 44.26 / 61.74 percent |
| Directional index, 9 / 14-day | 42.76 / 29.65 |
| Directional split, 9-day | positive 31.84 against negative 21.92 |
| Directional split, 14-day | positive 30.87 against negative 20.46 |
| Multi-indicator composite | 16 percent buy, strength weak, direction weakening |
| Composite by horizon | short term 40 percent buy, medium term 25 percent sell, long term neutral |
| Composite components | twelve studies, six buy, three hold, three sell; all three sells are moving average crossover studies |
| Composite trend signal | buy |
| 9-day | average true range 4.74 or 5.58 percent, average daily range 4.80, historic volatility 73.98 percent |
| 14-day | 4.39 or 5.17 percent, daily range 4.22, historic volatility 68.81 percent |
| 20-day | 4.20 or 4.95 percent, daily range 3.77, historic volatility 60.56 percent |
| 50-day | 3.78 or 4.45 percent, daily range 3.72, historic volatility 51.70 percent |
| 100-day | 3.11 or 3.67 percent, daily range 4.04, historic volatility 51.24 percent |
| Realized range Wednesday | 5.65 points, wider than every average true range measure |
| Near term against baseline | 9-day historic volatility runs roughly 44 percent above the 100-day reading |
| Stop sizing note | any stop tighter than about 1.0 point sits inside the noise on this instrument |
| Gasoline | up 2.59 percent, well under crude's 6.56, so the crack narrowed rather than widened |
| Natural gas | up 2.37 percent, rebounding from a three month nearest futures low on short covering into the August expiration |
| Forward curve | entered the week in steep backwardation and Wednesday's data can only have deepened it; the individual spreads were not machine read for this review |
| Options positioning lens | this contract carries no listed gamma surface comparable to the index proxies, so term structure, the product complex and the speculative balance are the equivalent lens |
| Demand expectations | US advance growth 2.0 against 2.1 prior, Chinese manufacturing 50.1 against 50.3, Eurozone growth 0.2 against negative 0.2 |
| Longer dated supply comment | the President repeated that the UK should open the North Sea, a multi year consideration |
| Policy decision | held at 3.75 percent on a nine to three vote, Hammack, Kashkari and Logan dissenting for a 25 basis point increase |
| Statement language | acknowledged inflation remains elevated relative to the 2 percent goal |
| Pricing into the meeting | roughly 30 percent probability of a hike and about 64 percent of no change |
| Long end yields | thirty year rose to a nearly two decade high on inflation concern |
| Equities | S and P futures down 1.2 percent at the cash close, extending to roughly negative 1.5 percent in the evening session |
| Missing signal | no large safe haven bid alongside the oil move, consistent with a supply disruption rather than a systemic conflict |
| Managed money | 187,469 long against 123,490 short, net long 63,979, adding to both sides |
| Non-commercial accounts | 310,182 long against 228,493 short, net long 81,689, longs up 7,753 and shorts down 11,253 |
| Commercial accounts | net short 108,601 after cutting long positions by 27,070 |
| Swap dealers | extended the short book by 9,955 to 586,755 |
| Reading the lag | July 21 precedes both the 93.50 high and the collapse to 77.78, so crowding is an unresolved risk rather than a confirmed one |
| Alternate direction | short, on a failure at the primary decision line, conditional on price trading into 85.57 to 86.65 and failing there |
| Alternate entry, stop and targets | entry 85.80 to 86.60 only after a confirmed failure and never on first touch, stop 87.10, targets 83.90 then 83.32 then 82.09, roughly 1 to 2.6, 1 to 3.2 and 1 to 4.6 from an 86.20 midpoint |
| When the alternate is correct | if the 08:30 ET inflation data comes in hot and the dollar firms while crude is extended |
| Primary invalidation | any sustained trade below 83.00; a confirmed Iran and United States agreement; a credible Hormuz reopening; an announced cessation of strikes; an upside inflation surprise at 08:30 that drives a dollar spike while crude fails 84.43 |
| Macro override | a de-escalation announcement voids the long immediately regardless of level, with 79.82 to 80.51 the logical destination; do not defend the position against a deal headline |
| Skip conditions | stand aside if price opens inside 83.42 to 84.54 with no clear rejection; while price chops between 83.42 and 85.57 without committing; for the first fifteen minutes after the 08:30 block and until 09:45 regardless; entirely while any new strike or negotiation headline is actively developing |
| Overnight and Globex | bid above the settle at 84.60 against 84.46, mildly higher inside 84.43 to 85.66, with 84.85 the first friction; European growth data runs 01:30 through 05:00 and the Bank of England lands 07:00, none first order for crude |
| Cash open and opening range | above 84.85 and holding makes it a continuation attempt; breaking 84.43 without recovery makes it a retracement toward the shelf |
| Morning level map | 84.85 first friction, 85.57 to 85.66 the decision line, 86.52 to 86.71 the first target zone, 83.25 to 83.42 the line that must hold |
| Afternoon | settlement at 14:30 compresses the window; headline risk has been an afternoon event in each of the last three sessions; month end Friday brings rebalancing flows |
| Close behavior to watch | a settle above 85.66 confirms the short term average set has flipped; a settle inside 83.42 to 84.54 leaves the day as digestion; a settle below 83.25 says Wednesday was a spike |
| Derived pivot projections | the 83.32 pivot, resistance at 86.71, 88.97 and 92.36, and support at 81.06, 77.67 and 75.41 are computed from Wednesday's high, low and settle rather than vendor published |
| Term structure | described from the prior session's observed curve state; the specific spread values were not machine read |
| Positioning data | reported as of July 21 and labelled stale relative to this week's price action |
| Contract basis | all figures reference the NYMEX WTI front month CLU26, captured at the Wednesday July 29 post settle window |
We publish this level map before every session, then score what held and what broke.
Read the rest of the daily market outlook series, or see how the same read is turned into systematic signals.
View pricing


