
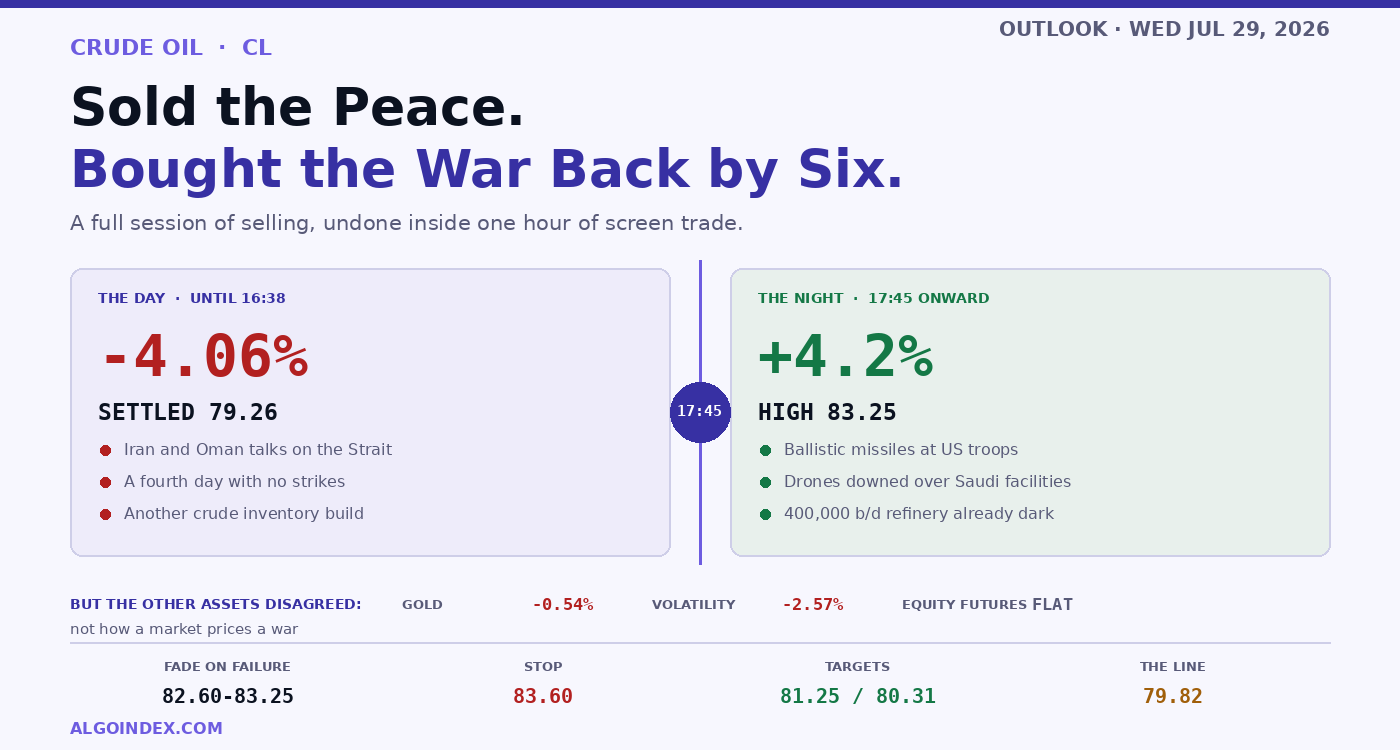
For one full session crude traded as though a deal were coming. September WTI finished at 79.26, a drop of 4.06 percent and the third consecutive lower close, with 77.78 printed along the way. Behind it: talks between Tehran and Muscat that might reopen the Strait, four days running with no strikes, and a President telling reporters the odds of progress looked good. Another crude build helped the case, so did word that the producer group intends one final September increase before it stops lifting quotas month by month.
Then the evening happened.
At roughly 16:38 an American official described Tehran as asking for too much, with demands over the Strait that Muscat, Washington and others were right to turn down. One sentence and the premise underneath the whole day was gone. Physical events piled in behind it. Saudi air defences brought down several drones sent out of Iraqi territory toward oil installations in the east. A possible ship incident got flagged by maritime authorities in Red Sea waters. And the kingdom already had a refinery down, 400,000 barrels a day of Jazan capacity offline since a strike the previous day.
The decisive moment came at 17:45. Revolutionary Guard forces sent multiple ballistic missiles toward American troops in the region, reportedly including a Jordanian base. Every missile was intercepted.
Crude reopened 80.04, climbed to 83.25, and now trades somewhere around 82.5 to 82.7. Call it 4.2 percent above where it settled. An entire day of selling reversed inside one hour of screen trade, and the settlement itself never came back into play. Monday night the premium came out while the tightness stayed. Tuesday put the premium straight back in.
Three assets disagreed about what just happened
This is the detail that ought to shape how Wednesday gets traded. The identical headlines that lifted crude more than four percent left gold 0.54 percent lower at 4,017.0 and knocked 2.57 percent off the volatility index, down to 18.20. Equity futures hardly twitched.
A market genuinely pricing a slide into war bids bullion and bids protection. Neither got bid. Read across the whole board, that says the response is being treated as contained, and that what moved crude was a supply story rather than a general retreat from risk. No casualties reported, nothing hit, everything shot down. Historically that combination gives you a spike followed by a fade.
Which is the honest complication in all of this. Drones aimed at Saudi installations and 400,000 barrels a day of regional refining knocked out are durable, physical facts. They will not unwind because attention moves elsewhere, and they are why treating this as a pure headline spike would be wrong.
The curve is the tiebreaker, and it argues against fading
There is no listed gamma surface to read on this contract, so positioning has to be judged through the energy complex itself. What it shows is steep backwardation. Nearby prices sit around 80 and the curve declines steadily from there, down near 70 across the next two or three contract years and toward 60 by the early 2030s, with the sharpest drop concentrated up front.
Curve shape answers something price alone cannot. Paying more for a barrel today than for one later is what actual scarcity looks like. It is not what a speculative bid or a headline bid looks like. So the premium built overnight is showing up as tightness in the physical market rather than as a risk layer sitting on top of an otherwise normal curve, and that lifts the bar for anyone wanting to fade it. Worth qualifying: this curve stretches ten years out, so a good portion of the slope is long-run structural expectation, and only the nearby section carries a tactical message.
Downstream is where the real strain sits. Work from where things settled Tuesday. A gallon of gasoline at 3.3345 implies a crack somewhere near 60 dollars against a barrel of WTI, and diesel at 4.1509 gives you something closer to 95. Neither is quoted directly, both are computed, and both are remarkable by historical standards. Losing 400,000 barrels a day of refining will do that. Note also that gasoline dropped only 0.80 percent while crude was losing 4.06, and it was last quoted up 1.49.
That gap matters for Wednesday morning. Stocks of crude are what gets measured at 10:30. A crude build is perfectly capable of coexisting with severe product tightness and doing nothing whatsoever to relieve it.
What the structure says
July has been remarkable in both directions. Bottom of 67.12 on the second, top of 93.50 on the twenty-third, so roughly 39 percent gained across three weeks, then better than 15 percent surrendered in the three sessions after. Counting back five sessions crude is still 6.02 percent lower even with the overnight rebound. The wider frame stays constructive though: 39.03 percent higher on the year, 24.41 across twelve months, 42.84 above the December low at 55.49, and 16.83 beneath the annual peak of 95.30. High, wide, violently two-way distribution rather than a trend.
Hourly, the run from July 23 onward is one unbroken downtrend that has finally thrown a warning. Four times over the 26th, 27th and 28th the same pattern repeated: a lower high, then a lower low, then structure breaking. A brief higher high on the 26th got rejected and simply started the next leg down. The final low came in near 77.78.
Then, right at the edge, the overnight reversal produced a change of character. First structural hint in six sessions that the pattern may be finished.
Warning, though, not confirmation. What that signal marks is a downtrend's first higher high. Turning it into an actual reversal requires the pullback afterward to hold above a prior low, and no pullback has come yet. That is precisely why the trade below demands proof instead of front-running it.
Two details tighten the read. Where the overnight rally stopped, 83.25, happens to be the 1.272 projection sitting on the chart, with 81.23 and 79.01 marked beneath it. A rally stopping to the penny on a projected level looks measured, not impulsive. Second, last week's low at 81.99 sits right under the market and becomes the first thing any pullback has to hold.
Where the volume agrees with the levels
Traded volume confirms the map from a completely separate direction. Roughly 167,000 contracts, about 37 percent of everything visible, changed hands between 77 and 78, which is Tuesday's low and the 20-day average at 77.73. Another 136,000 or so, near 30 percent, traded at 84, which is where the pivot arithmetic independently puts a resistance shelf.
Two unrelated methods landing on the same two prices is the best technical evidence anywhere in this review. Underneath, Tuesday's low, that 20-day average and pivot support at 77.22 form a triple confluence with the heaviest volume node stacked on it, and that is the structural line for this entire move. Overhead, three references inside eleven cents around 84.5 plus the second-largest node make that the price which would genuinely change the picture.
In between sits the grouping that decides Wednesday. Six independent references crowd into half a dollar: halfway back on the four-week range, 61.8 percent up from the annual low, the overnight open, the momentum midpoint, the overnight low, and the pivot itself. Whether the reversal built overnight survives the cash session gets settled right there.
The plan, and why it is conditional
Primary trade is a short that fades the overnight move, and only once failure has been demonstrated. Sell between 82.60 and 83.25, but exclusively after price has probed up into the 83.25 through 83.42 area and been turned away, and never earlier than 09:45. Stop sits at 83.60, clear of the retracement, since trading accepted above there means the premium is getting repriced upward rather than bleeding out. Objectives are 81.25, then 80.31, then the pivot. Roughly 1.5, then 2.5, then 3.2 to one.
Arguments for: interception across the board, nobody hurt, gold and volatility both falling as cross-asset confirmation, a rally that stopped precisely on a projection, medium-term indicators reading 75 percent sell, price sitting far under an 86.04 five-day average after a 15 percent three-day slide, and a build expected at 10:30.
Arguments against, which are why this waits: backwardation is genuine tightness, and the hourly chart has already flagged its change of character. Either one alone justifies demanding evidence first.
If escalation instead continues, the alternate is a long, entered 83.42 to 83.70 only once acceptance above 83.42 is established after 09:45, stopped at 82.55 under the overnight balance, aiming 84.43, 84.54, then 86.04. That is the stronger structure in an escalating market because it moves with the driver instead of against it. It does require acceptance rather than just a spike.
Odds as I see them: 45 percent that the spike holds but stalls, failing in the low 83s and rotating back toward the pair of averages just under the market. 30 percent that escalation carries it through 83.42 and up into the 84.4 shelf. 25 percent for the full round trip, which needs de-escalation reporting plus a bigger build, and would fill back to Tuesday's close.
Three provenance notes, stated openly rather than buried. Tuesday's high near 82.42 was solved backwards out of the pivot arithmetic using the confirmed low and close, so it is derived and not observed. Both crack figures are calculated from settlements rather than quoted anywhere. And the swing read came off the hourly chart, which covers July 23 through now and therefore holds the entire recent swing, with daily and weekly context supplied as numbers instead of pictures.
Wednesday reduces to this: both sides are telling the truth. Momentum, the medium-term indicators and the stock picture point down. Curve shape and physical damage point up. Markets built like that get traded in reaction, never in anticipation.
The complete data picture
Every number behind Wednesday’s plan, charted first; the full numeric reference follows underneath.
Full numeric reference , every remaining figure from the review
| September settlement | 79.26, down 3.35 or 4.06 percent, a third consecutive lower close |
| Session low | 77.78, the lowest print of the last five sessions |
| Implied session high | near 82.42, derived from pivot mathematics rather than observed |
| International benchmark | 84.09, down 4.27 or 4.83 percent |
| Globex reopen | opened 80.04, high 83.25, low 79.92, last near 82.5 to 82.7 |
| Move against the settlement | up roughly 3.35 to 3.45, or 4.2 to 4.35 percent |
| Reopen volume | 14,608 |
| Open interest | 280,817 |
| Contract detail | expiration 08/20/26, first notice 08/24/26 |
| Continuous-series overnight high | 83.30, against 83.25 on the contract; the two should not be mixed |
| July low | 67.12 on July 2 |
| July high | 93.50 on July 23 |
| The July advance | roughly 39 percent inside three weeks |
| The decline since | more than 15 percent across three sessions |
| Five sessions | down 5.08, or 6.02 percent, from a July 21 reference close of 84.34 |
| Year to date | up 39.03 percent |
| 52 weeks | up 24.41 percent |
| Above the 52-week low | 42.84 percent, from 55.49 on December 16, 2025 |
| Below the 52-week high | 16.83 percent, from 95.30 on May 18, 2026 |
| Weighted alpha | positive 26.72 |
| 5-day | 86.04, spot below, the clearest bearish marker |
| 20-day | 77.73, spot above |
| 50-day | 80.65, spot above |
| 100-day | 81.25, spot above |
| 200-day | 70.51, spot far above |
| Year-to-date | 75.41, spot above |
| Compressed band | 80.65 to 81.25, the 50-day and 100-day within roughly half a dollar |
| Raw stochastic, 9 / 14 / 20-day | 9.41 / 37.60 / 46.02 percent |
| Stochastic %K, 9 / 14 / 20-day | 38.06 / 57.68 / 62.95 percent |
| Stochastic %D, 9 / 14 / 20-day | 63.39 / 74.80 / 77.51 percent |
| Relative strength, 9 / 14 / 20-day | 46.26 / 48.95 / 49.43, the 14-day down 5.18 on the session |
| Directional index, 9 / 14 / 20-day | 45.79 / 30.37 / 20.83 |
| 14-day direction | positive 28.71 against negative 22.80, a modest bullish tilt |
| Historic volatility, 9 / 14 / 20-day | 66.58 / 65.30 / 57.39 percent |
| Overall | 40 percent sell, strength strong, direction strengthening |
| Short-term group | 20 percent sell |
| Medium-term group | 75 percent sell |
| Composite trend signal | buy |
| Average true range, 9-day | 4.54, or 5.73 percent, daily range 4.42 or 5.58 percent |
| Average true range, 14-day | 4.24, or 5.35 percent, daily range 4.06 or 5.13 percent |
| Average true range, 20-day | 4.09, or 5.17 percent, daily range 3.60 or 4.54 percent |
| Average true range, 50-day | 3.73, or 4.70 percent, daily range 3.68 or 4.64 percent |
| One-range band around 82.5 | roughly 78.30 to 86.75 |
| One-range band around the 79.82 pivot | roughly 75.58 to 84.06 |
| Range already covered overnight | 3.33, roughly 80 percent of a full daily range |
| Overnight high | 83.25, the high-water mark of the impulse |
| Rejection band | 83.25 to 83.42, with 83.42 the 38.2 percent retracement from the four-week high |
| The heaviest band | 84.43 first deviation, 84.47 second pivot resistance, 84.54 the 38.2 percent retracement from the 13-week high, all inside eleven cents |
| Volume corroboration | the second-largest node of the recent range sits at 84 |
| Above | 84.85 where price crosses the 9-day, then the 5-day itself at 86.04 |
| Higher | 86.52 third pivot resistance with 86.57 second deviation, 86.65 stochastic 70 percent, 88.21 third deviation |
| Extended | 93.50 the July high, 95.30 the 52-week high |
| Nearest | 82.09, the stochastic midpoint, then 81.87 first pivot resistance turning support |
| Immediately beneath the market | 81.99, the prior week low, the first line a pullback must respect |
| Compressed averages | 81.25 the 100-day, 81.21 the 13-week midpoint, 80.65 the 50-day |
| The decisive band | 80.31 down to 79.82, holding the 50 percent retracement of the four-week range, the 61.8 percent retracement at 80.09, the overnight open 80.04, the momentum midpoint 79.94, the overnight low 79.92 and the pivot |
| Fibonacci extensions | 1.272 at 83.25, 1.618 at 81.23, 2.0 at 79.01 |
| Beneath the pivot | 79.31 the 18-day crossing, 79.26 Tuesday's settle and gap-fill objective |
| Then | 78.40 the 40-day crossing |
| The structural line | 77.78 Tuesday's low, 77.73 the 20-day average, 77.22 first pivot support, reinforced by the largest volume node |
| Beneath that | 75.53 the published target price, 75.40 the 52-week midpoint, 75.17 second pivot support |
| Largest node | roughly 167,000 contracts, about 37 percent of visible volume, at 77 to 78 |
| Second largest | roughly 136,000 contracts, about 30 percent, at 84 |
| Curve shape | steep backwardation, front near 80 falling toward roughly 70 within two to three contract years and roughly 60 by the early 2030s |
| Interpretation | paying up for prompt barrels is physical tightness rather than a headline bid |
| Qualification | the curve runs a full decade, so part of the slope is long-run structural expectation; the near-dated portion carries the tactical signal |
| Gasoline settlement | 3.3345 per gallon, implying a crack near 60 dollars per barrel, computed |
| Diesel settlement | 4.1509 per gallon, implying a crack near 95 dollars per barrel, computed |
| Gasoline on the session | down 0.80 percent against crude's 4.06, last quoted up 1.49 percent |
| Natural gas | 2.6620, down 3.79 percent, a fourth consecutive decline and a three-month low |
| Equity index future | 7,465.50 |
| Technology index future | 27,867.25, down 0.20 percent |
| Volatility index | 18.20, down 2.57 percent |
| Gold | 4,017.0, down 0.54 percent |
| Dollar index | 101.393, down 0.12 percent |
| Reading | a market pricing genuine escalation would bid gold and volatility; neither happened |
| 16:38 | A United States official describes Iran as overreaching on the Strait |
| Same window | Saudi air defences intercept several drones from Iraqi territory |
| Same window | A potential vessel incident reported in the Red Sea |
| July 27 | The 400,000 barrel per day Jazan refinery shut after a strike |
| 17:45 | Multiple ballistic missiles launched at United States troops, a base in Jordan among the targets, all reported effectively intercepted |
| Standing constraint | a United States blockade of Iranian shipments in the Persian Gulf |
| Diplomatic breakdown | an Iranian official states Tehran is not focused on talks with the United States and is waiting on Oman |
| Managed money | long 187,469, short 123,490, net long roughly 63,979, both sides adding |
| Non-commercial | long 310,182 adding 7,753, short 228,493 covering 11,253, net long near 81,689 |
| Commercials | net short by roughly 108,601 |
| Swap dealers | short 586,755 against long 94,804 |
| Inference | this length was established well above the current market and before a 15 percent three-session decline |
| Entry zone | 82.60 to 83.25, only after a tested failure at 83.25 to 83.42, and not before 09:45 |
| Stop | 83.60, above the 83.42 retracement |
| Target 1 | 81.25, the compressed average band |
| Target 2 | 80.31, upper edge of the major support grouping |
| Target 3 | 79.82, the pivot where six references converge |
| Reward | roughly 1:1.5, 1:2.5 and 1:3.2 from the entry midpoint |
| Invalidation | sustained trade above 83.42, a pullback holding a higher low, or confirmation of casualties, retaliatory strikes or a Strait closure attempt |
| Macro override | a surprise inventory draw, or any headline confirming further attacks on Gulf energy infrastructure, cancels it regardless of price |
| Trigger | acceptance above 83.42 after 09:45 |
| Entry zone | 83.42 to 83.70 |
| Stop | 82.55, beneath the overnight consolidation and the 82.09 midpoint |
| Targets | 84.43, then 84.54, then 86.04 |
| Note | the higher-conviction structure if escalation continues, because it trades with the active driver, but it requires proven acceptance rather than a spike |
| Spike holds but stalls | 45 percent, rotating back into 80.65 to 81.87 with the support band holding |
| Escalation extends | 30 percent, acceptance above 83.42 toward 84.43 to 84.54 and then 86.04 |
| Full round trip | 25 percent, breaking 79.92 and 79.82, filling to 79.26 and testing 77.78 |
| Low band | 78.30 to 80.00 |
| Most likely band | 80.50 to 84.50 |
| High band | 85.00 to 87.00 |
| Overnight boundaries | 83.25 above and 79.92 below |
| No defined risk | opening inside 80.31 to 79.82 with no clear rejection |
| No acceptance | chopping between 81.87 and 83.25 without establishing either edge |
| Event windows | the first two minutes after the 10:30 release or the 14:00 statement |
| Developing headlines | any new missile, strike or Strait headline still unfolding |
| Standing view | given historic volatility above 65 percent and two first-order events, taking no position is fully acceptable |
| 04:00 | Euro area wage tracker |
| 04:30 | UK consumer credit, mortgage lending and mortgage approvals |
| 10:30 | Crude inventories, forecast a build of 1.0 million against 2.010 million prior, first-order for this contract |
| Private estimate Tuesday | another crude build, with distillates drawing 0.125 million against a prior build of 1.759 million |
| 13:30 | Bank of Canada minutes |
| 14:00 | Rate statement and decision, forecast 3.75 percent, prior 3.75 percent |
| 14:30 | Press conference |
| 16:00 onward | Large-cap technology earnings, relevant to risk appetite rather than to crude |
| Thursday | Personal consumption prices expected at 3.7 percent year over year against 4.1 percent prior |
| Derived figure | the implied Tuesday high near 82.42, solved from the published pivot against the confirmed low and settle, must not be presented as observed |
| Computed figures | the gasoline and distillate cracks, calculated from published settlements |
| Chart basis | swing structure read on the 1-hour chart spanning July 23 through the current session, with daily and weekly context supplied numerically |
| Monday reference | the prior settlement at 82.61, just above the derived Tuesday high |
| Tuesday data | consumer confidence 90.8 against a 92.4 forecast and 91.2 prior |
Follow-up: the inventory print came in nine million barrels away from consensus and the contract added 6.56 percent. Read the Thursday July 30 crude oil outlook.



